Both ordinary personal webmasters and professional operation and maintenance personnel need to conduct comprehensive monitoring of their own websites and servers. First, we can monitor the running status of network components, the security and stability status of servers at any time; Second, we can determine whether the cloud services used meet the needs of the project and continue to be used through monitoring and analysis; Third, if the server or project fails, it can be fed back to the IT management personnel in a timely manner, and can be handled with the highest efficiency in the shortest time.
Therefore, we must rely on professional monitoring tools. Among many open source monitoring tools, many professionals will choose Zabbix, Nagios, Ganglia, Zenoss, etc., especially Zabbix is the most popular. Of course, in recent years, domestic and foreign service providers have also provided a variety of free or paid visual and easy to operate online monitoring products. For example, Monitor Treasure, which is widely used in China and has rich functions, has many fans.
Lao Zuo himself has used Zabbix and Monitor Treasure at the same time, and has seen many teams using both products at the same time. In this article, Lao Zuo compares and analyzes the differences and complementarities between Monitoring Treasure and Zabbix monitoring from the perspective of actual user experience.
First, ease of installation
First, let's talk about the difficulty of getting started. Lao Zuo tried to install the Zabbix environment in the new server before he was ready to compare Zabbix with Monitor Treasure. From the perspective of installation experience, it is difficult to successfully complete the deployment of Zabbix if you are a non professional operation and maintenance personnel and are not skilled in using Linux servers. Although there are many Zabbix series tutorials and books on the Internet, there is still a certain threshold in the actual installation process, which is not suitable for individual webmasters and more and more Internet microenterprise entrepreneurs. Of course, there is no problem for operation and maintenance personnel with good foundation.
In sharp contrast, the deployment of Monitoring Treasure does not require any configuration on the server. Users only need to register an account on the official website of Monitoring Treasure, and then add monitoring objects according to the website and project. This SaaS based service mode deployment is all WYSIWYG, easy to start.
In addition, if you use Zabbix, you need a separate server as the monitoring server, while you do not need a separate server to use Monitoring Treasure. It is based on the monitoring services provided by Monitoring Treasure, and the hardware cost is reduced.
Second, alarm mode
One is foreign products, the other is domestic products. The first thing Lao Zuo thought of was the difference between alarm modes. In this regard, especially for domestic users, the alarm of Monitor Treasure has a unique advantage of convenience.
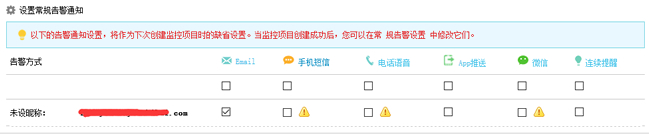
Monitoring treasure alarm supports a variety of mainstream communication tools, including email, SMS, telephone voice, APP push, WeChat, etc. Users can directly select and set when creating monitoring items.
Zabbix monitoring also supports email, SMS and other means in terms of alarm mode, but all alarm modes need to be set and defined by scripts. Although both can be realized functionally, the setting of Zabbix alarm mode is relatively cumbersome and requires skilled use of program script.
Therefore, Monitor Treasure also integrates mainstream open source monitoring products, which can be used for cross application data association analysis and hierarchical alarm. That is to say, the partners who use Zabbix can also use the monitoring treasure for alarm.
Third, differences in monitoring report analysis
For ordinary operation and maintenance, the purpose of enabling the monitoring service is to monitor whether the website, database, server and network services are normal. If problems occur, they can be solved in a timely manner. However, for the management, it is necessary to timely and accurately understand the operation status of business projects and the use of infrastructure resources. Monitoring logs alone are difficult to solve. Reports can help managers focus on core issues, analyze and locate data in real time, and help them make decisions quickly. Therefore, whether the monitoring tool has a powerful and detailed report function is one of the important factors to consider when selecting and using it.
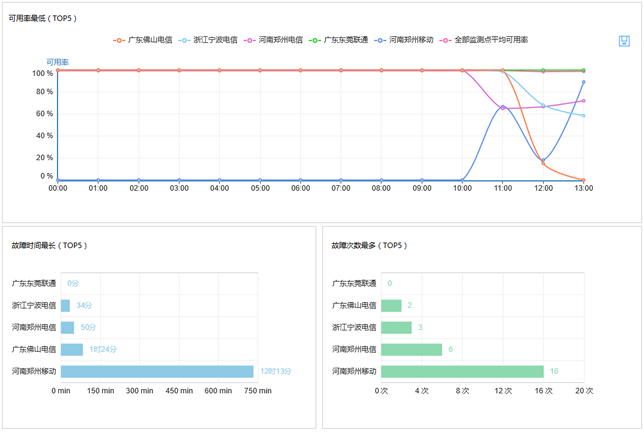
When monitoring the project, Lao Zuo found that as a commercial product, the reports of Monitor Treasure were really rich and beautiful. For example, the response speed of the monitored nodes, the comparison of historical data, the ranking of data, etc. The payment scheme can customize the monitoring nodes, and these data will automatically generate graphical reports, which is very suitable for ordinary operation and maintenance and management. Zabbix monitoring also has the report function, which is the most powerful in customization, but it can only be realized through secondary development by operation and maintenance personnel.
1. Availability and response time statistics
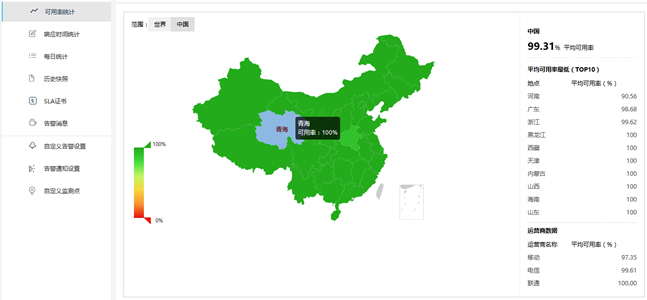
Through the distributed monitoring network, the status of websites and servers visited by users all over the country, even overseas, can be viewed at any time, and visual charts can be automatically generated. Pie chart, curve chart, histogram and experience map provide elegant visual experience. Then we can analyze the stability of purchased virtual machines, storage resources, network resources and CDN according to the response time and availability region, and make targeted adjustments and optimization according to the failure situation.
2. Historical Snapshot
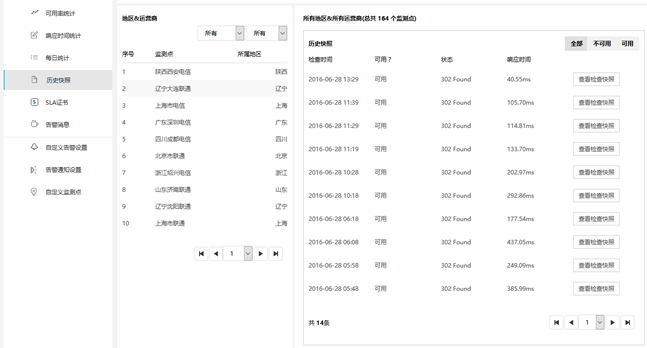
Through historical snapshots, you can quickly restore the scene where the failure occurred, accurately determine the cause of the failure, and quickly repair the service.
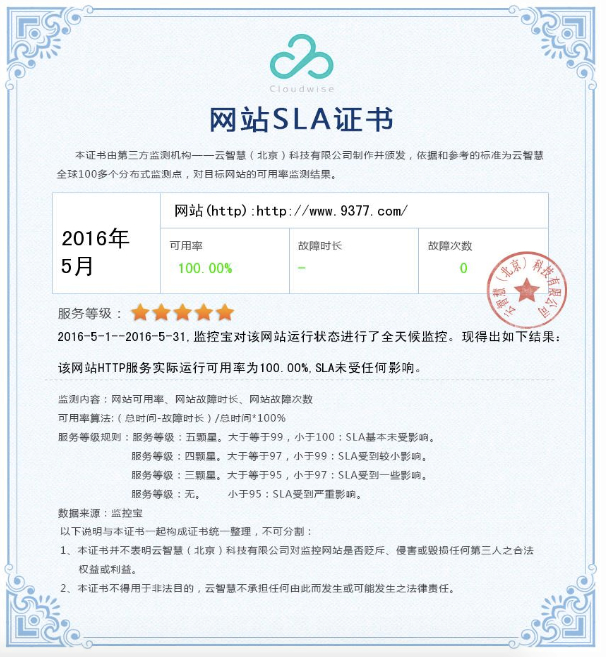
3. SLA report
SLA reports can help enterprises conduct overall analysis and trend prediction on monitoring items. For example, failure reason statistics, stability level, stability ranking statistics, etc. Weekly to help you review and analyze the overall performance of the monitoring website in the past week.

If necessary, Monitor Treasure can also issue SLA service level certificates. Lao Zuo has seen a personal webmaster and blogger hang the monitoring treasure SLA certificate on his website. I wonder if it seems that the service level of the website is relatively high.
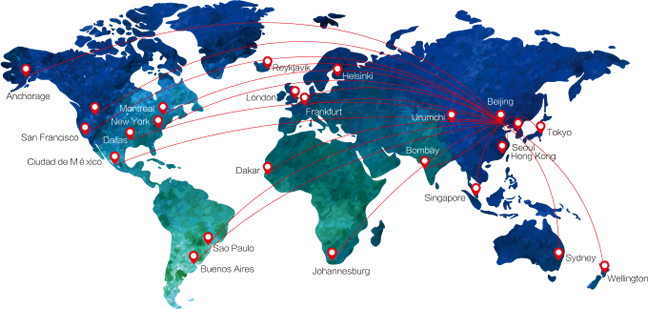
Fourth, deployment of global monitoring nodes
If template, customization and flexibility are the advantages of Zabbix, then the weakness of Zabbix is distributed monitoring.
Let's talk about the monitoring treasure first. Monitor Treasure provides 222 distributed monitoring nodes at home and abroad, and it is increasing in succession. For Zabbix users, although so many monitoring points can be deployed, the cost of the optical server is not a fraction.
Because the monitoring node is selected according to the actual project, it can truly perceive the network access speed and service stability of the region where the enterprise target users are located.
The free version of Monitor Treasure provides users with three free monitoring nodes. Enterprise users can select domestic and overseas monitoring points deployed in different regions and operators from hundreds of monitor nodes of Monitor Treasure according to their own business and user characteristics.
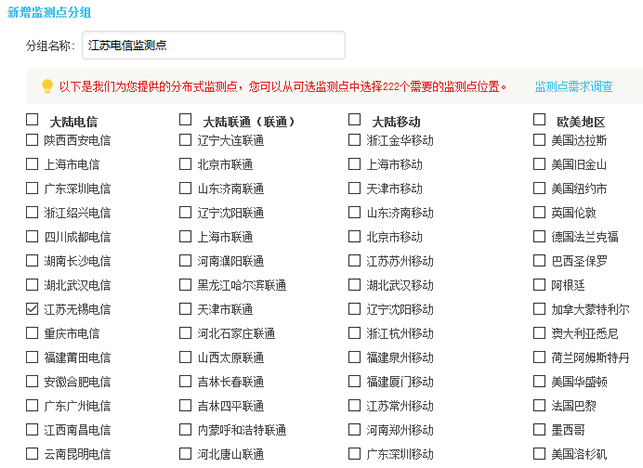
After customizing the monitoring point, we can create a monitoring project to add monitoring for a monitoring area separately. Here I monitor all the nodes of Jiangsu Telecom separately as a group.

Then you can add monitoring items separately for Jiangsu Telecom monitoring points.
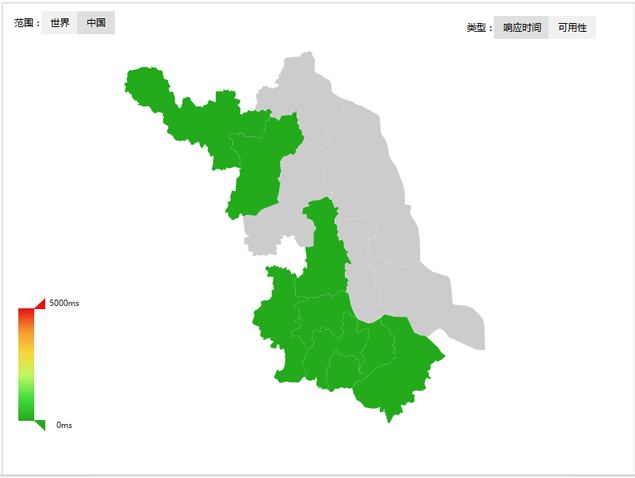
After that, you can see the user response statistics for monitoring points in Jiangsu in the monitoring treasure.
V. Summary
From the function of the product, whether it is Monitoring Treasure or Zabbix, it can achieve most of the monitoring needs of our ordinary users. However, for entry-level operation and maintenance personnel and entrepreneurial projects, Monitoring Treasure is simpler and can be used directly.
As the best open-source monitoring software, if Zabbix can be used freely and flexibly in depth, it needs certain operation and maintenance technology and secondary development ability. After in-depth mastering, it can monitor and set its own projects more freely.
We can't say which is better. We can only say that both of them have their own characteristics. If users lack the ability to operate, maintain and develop, or do not need the monitoring system to conduct in-depth monitoring on the underlying applications, they can meet most of the monitoring needs by using the monitoring treasure without changing the server configuration. If we already have a deep understanding of Zabbix and customized requirements, we can monitor based on Zabbix. Of course, we can also use the monitoring treasure as a supplement to monitoring points, alarms and reports. The two products can also be seamlessly connected.