Opinion Leader | Zhang Yu
Core viewpoints
about one Quarterly economic data, the most noteworthy or four information.
First, 5.3% Actual gross domestic product The growth rate exceeded the annual target, and the endogenous momentum was strong (namely, social zero, export, manufacturing investment, one Total quarterly growth rate is 6.1% ), Or means two The need to increase policies related to quarterly stable growth is diminishing. The policy game may have to yield to the economic fundamentals themselves, four The meeting of the Political Bureau in May may be flat.
Second, for the industrial sector, the pressure of supply and demand may be rising, and the price elasticity of industrial products is still low 。 Static pressure comes from one Quarterly low production and sales rate, low capacity utilization. Dynamic pressure comes from one Investment in the industrial sector that is on the high side of the quarter. This means that the subdivisions with good supply and demand patterns deserve more attention.
Third, for agriculture and service industry, the pressure of supply and demand may be reduced. The logic behind the closed loop may come from the prosperity of migrant workers. The number of migrant workers continued to grow significantly, the growth rate of migrant workers' wages exceeded the growth rate of urban residents' disposable income, the growth rate of residents' consumption must choose and travel chain was higher, and the growth rate of non durable goods above the quota of social zero was higher than that of durable goods. This means that the supply pressure of agriculture will be reduced (the agricultural population will transfer to cities and towns), and some labor-intensive service industries will have the basis for price increase (cost support).
Fourth, the real estate boom is still low, For new houses, both quantity and price are weakening. For second-hand housing, the year-on-year downward range of prices is widening.
To sum up, for two In terms of quarterly assets, the price pressure caused by the supply and demand of industrial products will affect the overall performance of equity, and the trend of profit recovery is still not observed. More attention should be paid to the areas with better supply and demand patterns. In addition, the demand side (consumption sinking) centered on migrant workers may be worth further exploration. The overall visible price performance of house prices, industrial products and consumer goods still cannot form a challenge to bonds, two Although the quarterly interest rate may fluctuate under supply pressure, it is still neutral and more bonds. For this year's resource allocation, "price" is more important than "quantity", PPI Is the core variable of stock debt strategy adjustment.
Report Summary
comment one : The pressure of supply and demand in the industrial sector may be rising
From three perspectives: one )The production and marketing rate is low, and there may be pressure to go to the warehouse later. one Quarterly work increase is relatively strong, reaching 6.1% However, the demand side may not be able to digest this part of output. From the perspective of production and marketing rate, 1-2 Month, and three The monthly production and sales rate is at a very low level in history. two )Low capacity utilization , one The strong quarterly industrial output failed to drive the capacity utilization rate to rise significantly, indicating that the capacity expanded in the earlier stage is in production. one Quarterly, the industrial sector's capacity utilization rate is 73.6% , two thousand and thirteen Only higher than two thousand and sixteen Year and two thousand and twenty The same period of the year. In terms of industry segments, automobile, electrical, general equipment, non-metallic mineral products, ferrous metal smelting and rolling processing industries, etc., declined more year on year 。 three )Investment growth in the industrial sector is relatively high , production capacity is still increasing rapidly. one In the quarter, the growth rate of industrial investment reached 13.4% Of which the growth rate of manufacturing investment reached 9.9% 。
comment two : The supply and demand pressure of agriculture and service industry may be weakened
From three signs: one )The growth rate of agricultural output is falling. one The growth rate of added value of quarterly primary production is 3.3% , two thousand and twenty year two The growth rate is the lowest since the quarter. The slowdown is related to animal husbandry. one Quarterly production of pig, cattle, sheep and poultry two thousand four hundred and ninety 10000 tons, with year-on-year growth 1.4% , among which, the production of pork declined 0.4% And the growth rate fell back to a lower position. two )The transfer of agricultural population to cities and towns has maintained a rapid speed 。 Mainly observe the number of migrant workers employed. one At the end of the quarter, the number of migrant workers increased year on year 2.2% 。 three )The wages of migrant workers are on the rise. one Quarterly, the average monthly income of rural migrant workers was 7.7% , higher than the growth rate of per capita disposable income of urban residents( 5.3% )。 In contrast, two thousand and twenty-three In, the growth rate of the former was 3.6% , the growth rate of the latter is 5.1% 。
comment three : Key data splitting
1 ) gross domestic product : nominal growth rate is low 4.2% , The deflator is -1.1% The deflator has been negative for four consecutive quarters. The contribution rate of consumption and investment is falling. two )Resident department: one Quarterly consumption propensity is better than that of the same period last year, but two thousand and nineteen The gap in two thousand and twenty-three Years. After the combination of consumption and new house purchase, the overall expenditure tends to decline. In terms of consumption, three Monthly non durable goods are better than durable goods. one Quarterly, the growth rate of mandatory and travel chains is high. three )Enterprise sector: For industry, investment growth picked up, but capacity utilization fell back. In terms of infrastructure construction, the growth rate of investment in areas with more central financial contributions and central enterprises' contributions is relatively high. The growth rate of investment in areas dominated by local investment is low.
Risk warning: House prices fell and residents' consumption confidence was insufficient.
Report Contents
Report body
1、 Supply and demand pressure: one rise and one fall
(1) Industrial supply and demand pressure: may rise
From three perspectives, the pressure of industrial supply and demand has risen.
one The production and marketing rate is low, and there may be pressure to go to the warehouse later 。 one Quarterly work increase is relatively strong, reaching 6.1% , the growth rate of industrial growth far exceeds gross domestic product Growth rate( 5.3% )。 The demand side may fail to digest this part of output. From the perspective of production and marketing rate, 1-2 Month, and three The monthly production and sales rate is at a very low level in history. According to the interpretation of the Bureau of Statistics, "from the perspective of the degree of recovery, we find that the recovery of consumption is not as good as that of production... The traditional industry is in the middle of recovery, which is slowed down by the adjustment of real estate."
two Low capacity utilization rate and lack of upward elasticity of subsequent industrial product prices 。 That is, one The strong quarterly industrial output failed to drive the capacity utilization rate to rise significantly, indicating that the capacity expanded in the earlier stage is in production. one Quarterly, the industrial sector's capacity utilization rate is 73.6% , two thousand and thirteen Only higher than two thousand and sixteen Year and two thousand and twenty The same period of the year. In terms of industry segments, automobile, electrical, general equipment, non-metallic mineral products, ferrous metal smelting and rolling processing industries, etc., declined more year on year.
three Investment growth in industrial sector is relatively high, and production capacity is still increasing rapidly 。 one In the quarter, the growth rate of investment in the industrial sector was significantly higher than gross domestic product Growth rate. The growth rate of industrial investment reached 13.4% Of which the growth rate of manufacturing investment reached 9.9% 。 Or it means that the pressure on subsequent capacity delivery is still high.
(2) Supply and demand pressure of agriculture and service industry: may decline
Impact of supply and demand pressure on agriculture agriculture products Price of( CPI : food items). The supply and demand pressure of service industry employees affects the price of service industry (especially labor-intensive ones, such as online car hailing, domestic service, etc.). from one According to the quarterly data, the pressure of supply and demand in agriculture and service industry has eased. It includes the following signs:
one )The growth rate of agricultural output is falling 。 one Quarterly, gross domestic product The growth rate is 5.3% , better than the previous value. However, the growth rate of primary production is 3.3% , significantly lower than the previous value( 4.2% ), Yes two thousand and twenty year two The quarter with the lowest growth rate of primary production since the quarter. The slowdown is related to animal husbandry. one Quarterly production of pig, cattle, sheep and poultry two thousand four hundred and ninety 10000 tons, with year-on-year growth 1.4% , among which, the production of pork declined 0.4% The growth rate of both fell back to a lower position, that is, the supply pressure of animal husbandry is easing. From the leading indicator of pig production, one Pig inventory at the end of the quarter forty thousand eight hundred and fifty 10000, down year-on-year 5.2% , capable of breeding sows two At the end of the month four thousand and forty-two 10000 heads, from two thousand and twenty-three year seven Continuous capacity reduction since January.
two )The transfer of agricultural population to cities and towns has maintained a rapid pace. Mainly observe the number of migrant workers employed. one At the end of the quarter, the number of migrant workers increased year on year 2.2% 。 in consideration of two thousand and twenty-three There is a base reason for the increase of the number of people going out in one The quarterly growth rate is actually high. In contrast, two thousand and nineteen year one Quarterly two thousand and eighteen year one Quarterly growth rates are 1.2% 、 1.1% 。 Migrant workers continue to go out , or It means that the supply pressure of agriculture is reducing.
three )The wage of migrant workers is on the rise, which means that the consumption of migrant workers is good. There is a certain price rise basis for some subsequent labor-intensive service industries and key consumption areas of migrant workers. one Quarterly, the average monthly income of rural migrant workers was 7.7% , higher than the growth rate of per capita disposable income of urban residents( 5.3% )。 In contrast, two thousand and twenty-three In, the growth rate of the former was 3.6% , the growth rate of the latter is 5.1% 。
2、 Detailed analysis of economic data in Q1
(1) 1 Overview of quarterly key economic data
one Quarterly, gross domestic product The actual growth rate is 5.3% , better than the previous value 5.2% 。 name gross domestic product The growth rate is 4.2% , the same as the previous value.
From the supply side, the growth rate of secondary industry rebounded , one Quarterly 6% , better than the previous value 5.5% 。 one The quarterly growth rate of industrial growth is 6.1% , former value is 6% 。 On the demand side, the growth rate of fixed investment and export picked up, but the growth rate of residential consumption and real estate sales area fell back.
Price , one quarter PPI Year on year average is -2.7% , former value is -2.8% 。 CPI Year on year average is 0% , former value is -0.3% , seventy The price of large and medium-sized newly-built housing is -1.9% , former value is -0.7% 。
Revenue , the growth rate of residents' income fell back, one Quarterly 6.2% , lower than the previous value 6.4% However, the income growth of migrant workers has rebounded, one Quarterly 7.7% , former value is 3.6% 。 one At the end of the quarter, the total number of migrant rural labor force eighteen thousand five hundred and eighty-eight 10000 people, with year-on-year growth 2.2% 。
Consumption tendency , one Quarterly 63.3% , better than last year one Quarterly.
Capacity utilization , one Quarterly 73.6% , lower than the same period last year( 74.3% )。
(2) GDP : Actual exceeds expectation, nominal is still low
1 Quarterly, gross domestic product The actual growth rate is on the high side, reaching 5.3% , month on month 1.6% 。 But the nominal growth rate is low, which is 4.2% , the deflator is -1.1% The deflator has been negative for four consecutive quarters.
From the perspective of expenditure method, one In the quarter, the contribution of net exports rebounded, reaching 14.5% , former value is -3.1% 。 The contribution of consumption and investment is declining. Among them, the contribution rate of consumption is 73.7% , former value is 80% 。 The contribution rate of investment is 11.8% , former value is 23.1% 。
(3) Enterprise sector, capacity utilization rate has declined
2024 In the first quarter of, the utilization rate of industrial capacity above designated size nationwide was 73.6% , down year-on-year zero point seven %, down from last quarter two point three Percentage points. In three categories, two thousand and twenty-four In the first quarter of, the capacity utilization rate of the mining industry was 75% , down year-on-year zero point two Percentage points; Manufacturing capacity utilization rate is 73.8% , Down zero point seven Percentage points ; The capacity utilization rate of power, heat, gas and water production and supply industries is 71.2% , Down zero point seven Percentage points.
(4) In the residential sector, the propensity to consume has risen, but the propensity to spend has fallen
For the residential sector, one Quarterly data show that the propensity to consume is better than 2020-2023 At the same time of 63.3% 。 in consideration of 2020-2023 year one Quarterly consumption is affected by the epidemic( two thousand and twenty-one Celebrate the New Year on the spot, two thousand and twenty-two year three In April, the epidemic spread in Shanghai and other places, two thousand and twenty-three year one Monthly epidemic situation quickly peaked), or with two thousand and nineteen The same period of the year is more appropriate. two thousand and nineteen year one Quarterly consumption tendency is 65.2% 。 That is, two thousand and twenty-three year one Quarterly consumption tendency comparison two thousand and nineteen Year on year low one point nine Percentage points, the difference between two thousand and twenty-three It was basically flat throughout the year. two thousand and twenty-three The annual consumption tendency is 68.3% , two thousand and nineteen For the whole year 70.1% 。
If consumption and new house purchase (the total expenditure tendency of the residential sector) are considered together, the first quarter is 74.6% , the same period last year 80% 。 This is mainly due to the heavy drag of new house purchase, one Quarterly consumption of new housing is -30.7% 。
In terms of the breakdown of consumption propensity, one The quarterly growth rate is better than the income growth rate, including five categories: food, tobacco and alcohol, clothing, transportation and communication, education, entertainment, and other supplies and services. It focuses on the mandatory consumption and travel chain.
(5) Employment of migrant workers: the income side has improved
At the end of the first quarter, the total number of migrant rural labor force eighteen thousand five hundred and eighty-eight 10000 people, with year-on-year growth 2.2% 。 In terms of income, one Quarterly, the average monthly wage income of migrant workers increased year on year 7.7% , former value is 3.6% 。
(6) Energy consumption: year-on-year decrease
According to the interpretation of the Bureau of Statistics, "in the first quarter, the unit gross domestic product YoY decrease in energy consumption 0.1% 。 If raw material energy consumption and non fossil energy consumption are deducted, energy consumption will decline more. "
3、 Detailed analysis of economic data in March
(1) 3 Overview of monthly main economic data
three On a monthly basis, production is weak, Year on year increase in industrial production was 4.5% , quarter on quarter ratio is -0.08% 。 The growth rate of exports fell back, three Month on month -7.5% 。 The growth rate of consumption fell back, 1-3 Monthly retail sales of services 10% , below 1-2 Of month 12.3% 。 three The monthly service industry production index is 5% , below 1-2 Of month 5.8% 。 three The zero growth rate of Yueshe is 3.1%, lower than 1-2 Of month 5.5% 。 The growth rate of fixed investment picked up, three Month on month 4.8% , better than 1-2 Of month 4.2% Among them, the growth rate of manufacturing investment and infrastructure investment picked up. Real estate investment three Month on month -10.1% , below 1-2 Of month -9.0% 。 PPI 、 CPI Year on year housing price three Monthly average lower than two Month. Financial data is weak, three month M1 The growth rate of social finance and credit is lower than two Month.

(2) Employment: Unemployment rate and weekly working hours are lower than the same period last year
In terms of employment, three In August, the unemployment rate of the national urban survey was 5.2% , down from last month and the same month last year zero point one Percentage points. three In June, the unemployment rate of migrant agricultural registered labor force was 5% , the same period last year 5.3% 。 thirty-one The unemployment rate surveyed in cities and towns of 5.1% , the same period last year 5.5% 。 three In January, the average weekly working hours of employees in enterprises nationwide are forty-eight point six Hours, the same period last year forty-eight point seven Hours.
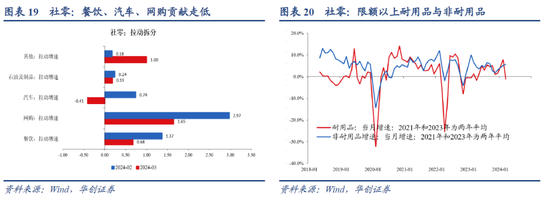
(3) Consumption : Non durable goods are better than durable goods
The year-on-year growth rate of social zero in March was 3.1%, the previous value was 5.5%. Cumulative, the growth rate from January to March was 4.7%.
The reason for the decline is that it is greatly affected by the base number. The base of catering, automobile and online shopping rose significantly in March 。 Specifically, three Monthly catering revenue is 6.9% , lower than the previous value 12.5% 。 three Year on year ratio of monthly automobiles -3.7% , lower than the previous value 8.7% 。 three Monthly online shopping growth rate is 6.77% , lower than the previous value 14.4% 。
In terms of specific categories above quota, the growth rate of durable goods in March was - 1.1%, lower than the previous value of 7.7% 。 Among durable goods, sports and entertainment goods, home appliances and communication equipment grew at a high rate, three The monthly growth rate reached 19.3% 、 5.8% 、 7.2% 。 The growth rate of cultural and office supplies, furniture and automobiles is low. In March, the growth rate of non durable goods was 5.6%, higher than the previous value of 5.1%. Among the non durable goods, clothing, daily necessities, grain, oil and food, and Chinese and western medicines are growing at an increasing rate.
(4) Property: Prosperity further declines
On the data level, the real estate boom continued to fall. The national housing boom index continued to fall to 92.07 in March.
In terms of sales, three The monthly sales area of commercial housing is -18.3% , 1-2 Month is -20.5% 。 three The monthly sales of commercial housing is -25.9% , 1-2 Month is -29.3% 。
In terms of investment, the growth rate dropped 。 three In June, the growth rate of real estate investment was -10.1% , 1-2 Month is -9.0% 。 three In June, the newly started area was -25.4% , 1-2 Month is -29.7% 。 floor space completed three Month on month -21.7% , 1-2 Month is -20.2% 。 Construction area, 1-3 Monthly cumulative growth rate is -11.1% , 1-2 Month is -11.0% 。 The land transaction is still weak, three The year-on-year growth rate of residential transaction area in Baicheng in July was -15.94% , one Quarterly cumulative growth rate is -14.1% 。 According to the interpretation of the Bureau of Statistics, "from the data, the 'three major projects' of real estate drive real estate investment zero point six %, which is effective. "
In terms of capital sources, the growth rate has slowed down 。 The growth rate of real estate fund sources was - 29% in March and - 24.1% in February. Among them, domestic loans, three Month on month -6.3% 。 The growth rate of deposit and advance collection was -41.5% in March, and the growth rate of personal mortgage loan was -46.7% in March. Self raised funds, three The monthly year-on-year growth rate is -13.6% 。 According to the interpretation of the Bureau of Statistics, "from the data of the first quarter, the decline in loans of domestic real estate enterprises has narrowed one point two %, which is directly related to the implementation of "white list" financing policy "
In terms of house prices, the year-on-year decline has expanded 。 In terms of new houses, seventy Large and medium-sized cities three Month on month -2.7% , two Month is -1.9% 。 In terms of second-hand housing, seventy Large and medium-sized cities three Month on month -5.9% , two Month is 5.1% , one Month is -4.4% 。
(5) Work increment: The production and sales rate further fell
In March, the year-on-year growth rate of industrial added value was 4.5%. In terms of quarter on quarter ratio, it has dropped sharply, three Month is -0.08% 。 one On a quarterly basis, the growth rate of industrial growth is 6.1% , which is on the high side. According to the interpretation of the Bureau of Statistics, "in the first quarter, the whole society's electricity consumption increased 9.6% , Industrial power consumption growth 7.7% , freight volume growth 5.3% , increase of passenger traffic volume for business 20.5% , Port cargo throughput growth 6.1% 。”
Three industries , Mining three The monthly growth rate is 0.2% , Manufacturing three Month on month 5.1% , electric heating, gas and water three Month on month 4.9% 。 In terms of ownership, three In July, the added value of state-owned holding enterprises increased year on year 4.1% ; Growth of joint-stock enterprises 5.1% Growth of foreign-invested enterprises and enterprises invested by Hong Kong, Macao and Taiwan 2.6% ; Private enterprise growth 3.7% 。 In total, one The quarterly growth rate of added value of foreign-invested enterprises, Hong Kong, Macao and Taiwan invested enterprises is 4.8% , lower than private and state-owned holding enterprises.
Why fall back? Or related to two reasons. The first is the base effect. Second, demand is weak. From the perspective of production and sales rate, it further declined to 93.1% in March, which was at a very low level in the same period of history. According to the interpretation of the Bureau of Statistics, "In terms of the degree of recovery, we found that the recovery of consumption is not as good as that of production, and the recovery of small, medium-sized and micro enterprises is not as good as that of large enterprises, so there is an obvious imbalance in economic recovery."
From the output of major industrial products: Low growth rate of real estate construction end 。 three In June, the cement output increased year on year -22% , crude steel output increased year on year -7.8% , coke production increased year on year -6.0% 。 solar energy The production capacity of batteries, new energy vehicles and integrated circuits has increased rapidly According to the interpretation of the Bureau of Statistics, "the added value of high-tech manufacturing above designated size increased in the first quarter 7.5% , higher than that of industries above designated size one point four Percent. " Performance differentiation of equipment related to manufacturing investment , three In June, the output of metal cutting machine tools was -6.3% , Industrial robot The output is 6.6% 。
(6) Investment: Investment in manufacturing industry is further rising
The growth rate of fixed asset investment was 4.7% in March, 4.2%% in January and February, and 4.5% in the first quarter 。 By item, three In August, the main reason was that the investment in manufacturing industry went up further, reaching 10.3% , 1-2 Month is 9.4% 。 Real estate investment three Month on month -10.0% , 1-2 Month is -9.0% 。 Infrastructure (broad caliber) three Month on month 8.6% , 1-2 Month is 9% 。 Investment in other industries, three Month is 4% , 1-2 Month is 6.3% 。
From the perspective of the three industries, the growth rate of fixed asset investment in the first industry in the first quarter was 1.0%, that in the second industry was 13.4%, and that in the third industry was 0.8%. In the second industry, industrial investment increased by 13.4% year on year. By registration type, in the first quarter, the investment of domestic enterprises increased by 4.4% year on year, the investment of Hong Kong, Macao and Taiwan enterprises increased by 7.1%, and the investment of foreign enterprises decreased by 10.4%.
For infrastructure, The growth rate of the areas where the central government makes more contributions and central enterprises make contributions is higher, one Quarterly year-on-year growth of investment in railway transportation industry 17.6% , Investment growth in air transport industry 35.4% Investment growth in water conservancy management industry 13.9% 。 Investment growth in power, heat, gas and water production and supply industries 29.1% 。 1-2 In June, the cumulative growth rate of telecommunications, radio and television and satellite transmission services (included in the statistics of narrow infrastructure) was 10.2% 。 Areas with more local investment have a low growth rate , one In the quarter, the investment growth rate of public facilities management industry was -2.4% 。 1-2 Month, Ministry of Transport data, highway construction investment growth rate -6.4% 。
Investment in manufacturing industry may still be related to equipment purchase. one Quarterly, the cumulative year-on-year growth rate of purchase of equipment, engineering and appliances is 17.6% , former value is 17% 。 In the industry segment, one Quarterly investment growth exceeds 10% Agricultural and sideline food processing industry( 17.4% ); Food manufacturing (19%) ; Textile industry; Chemical raw materials and chemical products manufacturing industry; Nonferrous metal smelting and rolling processing industry; Metal products industry; General equipment manufacturing; Special equipment manufacturing industry; Manufacturing of railway, ship, aerospace and other transport equipment; Electrical machinery and equipment manufacturing industry; Computer, communication and other electronic equipment manufacturing.

See Huachuang Securities Research Institute on April 16 for details day Published newspaper Report [Huachuang Macro] Supply and demand pressure: one rise and one fall - comments on economic data in March 》。
(The author of this article is a researcher from the International Monetary Research Institute of Renmin University of China.)