Article/Hong Hao, columnist of Sina Financial Opinion Leader (WeChat official account kopleader)
China's economy has entered the bottom area of a short cycle, but expectations for a strong recovery should be lowered; The three balance sheets are deteriorating, but the leverage has not yet reached the critical point.
I: Impact of Sino US trade war – the machine
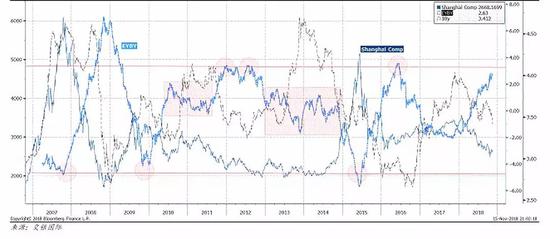
Since the beginning of the trade war, China's stock market has been under heavy load. However, as the initiator of the trade war, the US market has not really felt this impact - until recently, the slowdown of China's economy has become more obvious, and the short cycle of the US economy has gradually peaked. The question now is: after a slump of more than 30% and being listed as one of the worst performing markets in the world this year, has China's stock market digested the impact of the trade war?
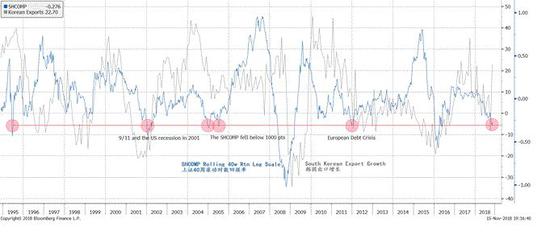
In order to answer the above questions, we calculated Shanghai composite index Rolling 40 week logarithmic return. We want to examine whether the Shanghai Stock Exchange's slump in 2018 has entered the bottom area compared with several significant bear markets in history. It can be seen that after the stock market plummeted in 2018, this return indicator has fallen to the level during the U.S. economic depression in 2001, the Shanghai Composite Index fell below 1000 points in 2005, and the European sovereign debt crisis in 2011. However, the depth of this slump is not as deep as that of the global economic crisis in 2008 and the bursting of China's stock market bubble in 2015( Figure 1 )。 Therefore, unless the trade war next year worsens further, we can say that the recent changes in market prices have largely reflected the impact of the trade war and the slowdown of China's economic cycle 。
chart 1: The extremely low market returns indicate that stock prices have been included in the short-term impact of the trade war.
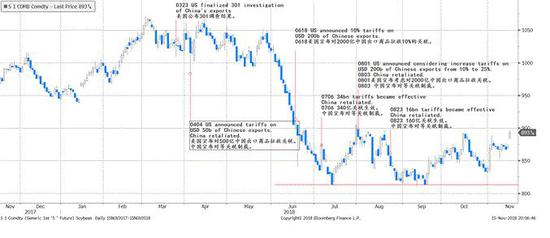
One way to measure the impact of trade wars is to observe the price of soybean futures. This is because of the importance of soybeans in the export trade of the United States to China, and the influence of the midwest agricultural states on the American election. We note that although the trade war seems to have worsened recently, the price of US soybean futures is no longer at a new low (Figure 2). This observation shows that the current market price seems to have taken into account the short-term impact of the trade war. Unless the trade war continues to deteriorate, both the Shanghai Composite Index and the US soybean futures reflect the short-term respite of the trade war in the market price structure. The resumption of bilateral dialogue is a positive signal.
chart 2: US soybean futures prices no longer hit new lows.
 II. Three balance sheets in China's economy
 Our business cycle model shows that, given the implementation of fiscal stimulus and monetary easing policies, the short cycle of China's economy will gradually enter the bottom range in the next few months. Our cycle model also shows that the short economic cycle of the United States is peaking and will continue to disrupt overseas markets in the short term. (Please refer to our report on September 3, 2018《 Hong Hao: Conflicts between Chinese and American cycles 》)
When the economic cycle approaches the upward inflection point, it means that the negative factors in the economy have been exhausted. At this point, we will see that despite the decline in interest rates, credit expansion has slowed to below the nominal economic growth level. Economic activities, especially the growth of China's real estate construction activities, are gradually stagnating; Consumption is weak and inventories are low. As the most closely watched barometer of economic activity, the stock market also performed poorly. China is at such a critical moment.
However, if an economic cycle wants to get out of the trough, it often needs the help of government policies. The greater the challenge, the higher the level of policy support is needed - just like now. The necessary condition for the policy to be effective is that the government still has room for stimulus, and the leverage in the balance sheet of the private sector has not been added to the unsustainable level. In short, there is still room to increase the leverage burden in the balance sheets of the public and private sectors.
In the following section, we will study the leverage of different sectors in China's economy.
2.1 Family: China's real estate bubble – a different perspective
Is China's real estate a bubble? The debate on China's real estate bubble has been inconclusive. Bubble theorists, including the author, once used extremely low rental yields to compare with mortgage interest rates, high real estate prices to compare with incomes, and vacancy rates to confirm their views on the real estate bubble. Despite these arguments, the price of real estate in the past two decades has been unprecedented. Although real estate is a long-term asset, it is difficult to choose the time to exit, but such a strong price performance implies that the current mainstream view may be biased.
With the slowdown of China's economy, the downward pressure on real estate prices has become increasingly evident. The focus of the experts' debate has turned to whether the high housing prices have led to the rise of the leverage ratio of Chinese households to a high unsustainable level and affected the consumption level of residents. Finally, the unsustainable high leverage ratio will probably lead to the bursting of the real estate bubble.
In addition to the traditional indicators that measure housing affordability and the health of household balance sheets, we believe that the study of the solvency of Chinese households across time and regions may be more illustrative. If Chinese families can afford their monthly mortgage payments, it is reasonable to use leverage to invest in real estate as long as the return on home purchase exceeds the mortgage interest rate. In addition, considering that there are significant differences in the real estate market in different regions, the investigation of the real estate market should also vary from place to place.
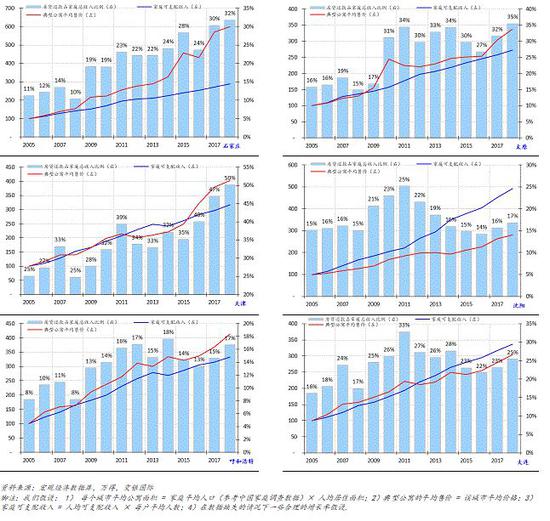
chart three : 35 The city's disposable income grew faster than the monthly housing loan repayment
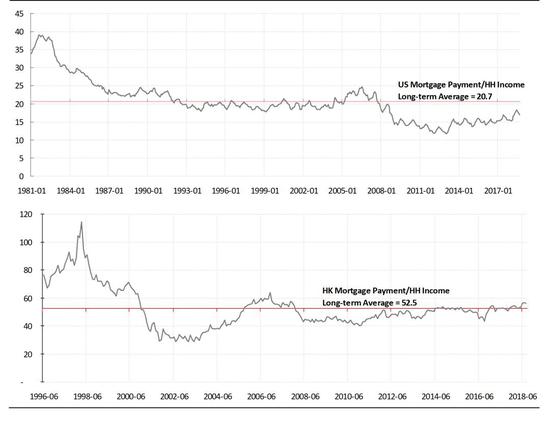
We find that at the national level, the growth of household disposable income is faster than the growth of housing prices. Housing loan repayment accounts for 39% of the total family income. This percentage has climbed to a level similar to that in 2007 and 2011. However, the following two years were both difficult years for China's economy( Figure 3 )。 At present, when American interest rates began to rise from the historical bottom, the corresponding indicator was 21%. This comparison can be understood as that Chinese families seem to be heavily in debt. However, compared with 56% in Hong Kong, it is not worth mentioning. In 1997, when the real estate bubble was in effect, the ratio in Hong Kong even exceeded 100%. Therefore, the cultural differences between China and the West should be an important reason for the different housing loan burdens( Figure 4 )。
chart four : Hong Kong / US housing loan burden
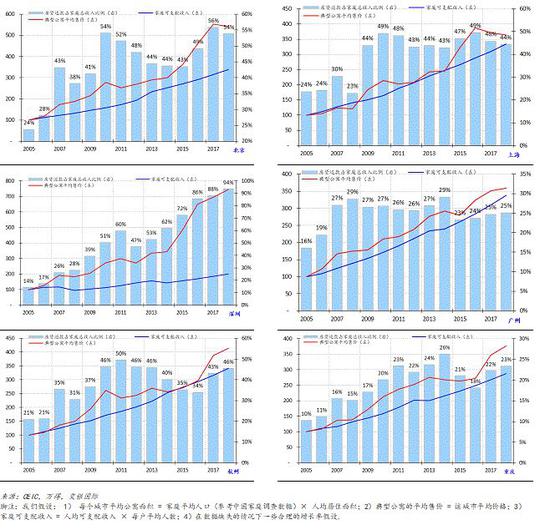
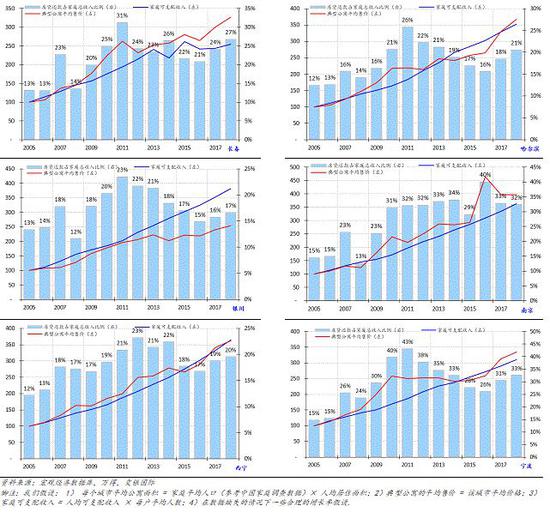
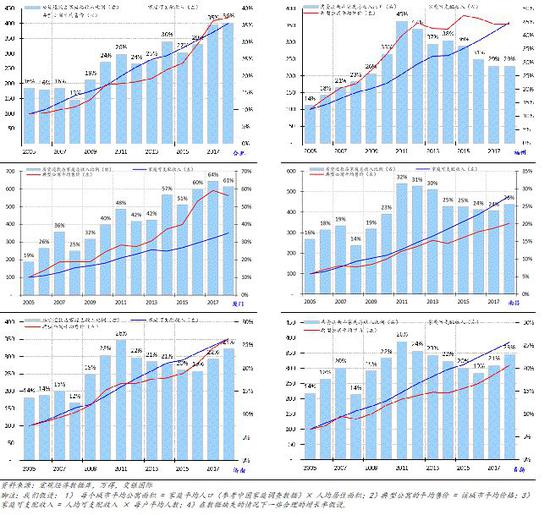
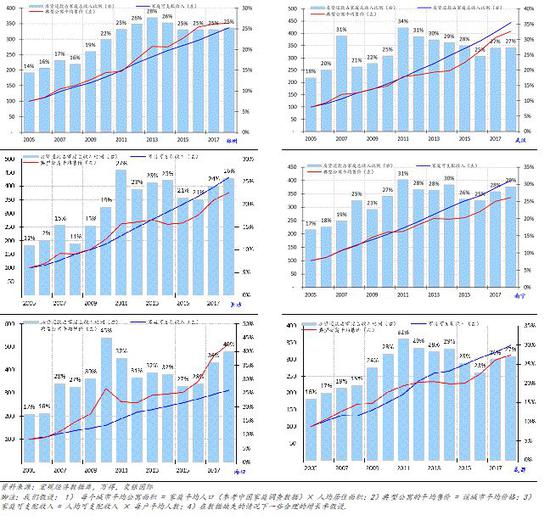
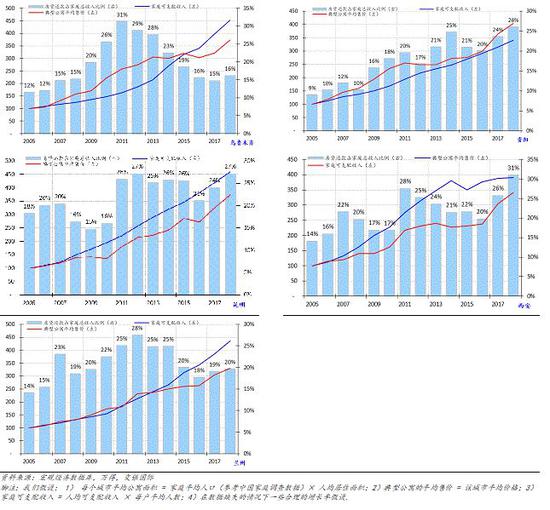
On the basis of some reasonable assumptions, we adopted the same measurement method to consider the housing loan burden of 35 major Chinese cities( Figure 5 Only some important cities are shown. For the remaining cities, please refer to the appendix at the end of the report). We find that since 2005, only 16 of the 35 major cities have seen household disposable income grow faster than house prices. In the first tier cities except Guangzhou, the growth rate of house prices in all cities exceeded the growth rate of household disposable income. Therefore, when considering the differences between different regions, if housing prices continue to grow faster than income, China's real estate bubble will become the straw on the camel's back.
chart five : Housing loan burden in some major cities (see appendix for complete city chart)
To sum up, we conclude that the growth of China's household mortgage burden relative to disposable income has deteriorated to the same level as that in 2007 and 2011. The next two years, 2008 and 2012, were difficult years for the real estate market and economy. These years are also consistent with the downward years of the short cycle of the U.S. economy (we will discuss the short cycle of the U.S. economy in detail in the following report). Overall, the leverage of China's household balance sheets is high and deteriorating. But judging from the solvency, it seems that it is not on the verge of collapse.
two point two Local government debt
With the increasing debt problem, can local governments continue to operate normally? This problem has been puzzling investors. From a historical perspective, since 2009, the state allocated 4 trillion yuan to stimulate economic growth, the local government debt crisis first surfaced in 2010. I still remember leading a large investor team to do due diligence on this issue, and I can clearly remember the scenes of cities in the upper and lower reaches of the Yangtze River. Recently, with some news headlines reporting that some township and county governments have encountered difficulties in paying civil servants' salaries, the problem of government debt has again attracted attention.
The challenge in analysing local government debt is its transparency. First, it is difficult to collect true and reliable data. At the same time, the implicit debt generated by local government financing platforms, local government owned, or indirect debt guarantees for local government affiliated companies further complicates the problem.
Our approach is to use individual debt data (including local government bonds and local government financing platform bonds) to summarize the explicit debt of local governments from the bottom up. These data include information on principal maturity and interest rate payment. Then, we compare the bottom-up summary of these data with various news reports and national audit data to verify its rationality. Obviously, our analysis does not include contingent implicit debt. Compared with the international standard of 3%, our central government's fiscal deficit is still 2.7%. This is a low deficit level, so we focus our analysis on local government debt. Our analysis is considered as the best scenario( Figure 6 )。
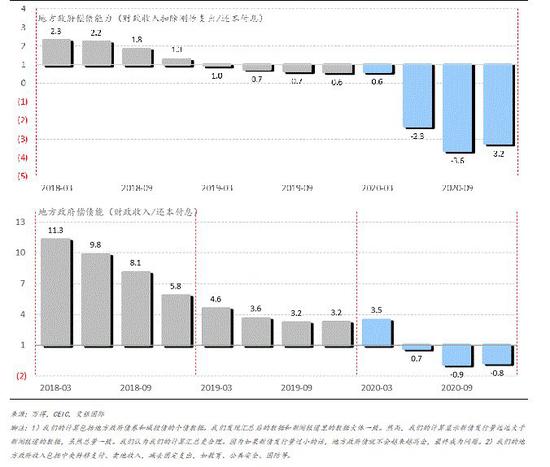
After deducting the fixed expenditures, including the provision of public security and education, and taking into account the schedule of debt maturity, we find that local governments will face a slight lack of funds to repay their debts in 2019. Due to the maturity of a large number of bonds issued in the past three years, the debt problem of local governments will seriously worsen in the second half of 2020. We can assume that these bonds will be replaced by issuing new bonds when they expire in 2020, but this strategy will further increase the leverage of local governments. If we assume that these bonds can be repaid through central government transfer payments, our central fiscal deficit will be raised to nearly 4%.
If we assume that bonds will be replaced by issuing new bonds when they mature, the solvency of local governments will be greatly improved. Even so, it will still be a huge challenge for local governments to refinance their debts in the second half of 2020. In any case, local government debt will eventually face challenges. Fortunately, we are not threatened by this aspect yet.
chart six : The solvency of local governments will be two thousand and twenty Significantly weakened in the second half of
 2.3 Corporate debt
 Recently, some people worry that if the market turmoil continues, China's private enterprises may "fall back" to state-owned enterprises. Many critics point out that the financial situation of state-owned enterprises and private enterprises in the manufacturing industry is seriously polarized, which proves that private enterprises are struggling in the cracks.
Although these concerns are not groundless, manufacturing is only one part of China's economy in the transition to consumption. In addition, in the capital intensive industry composed of many upstream commodity producers, Chinese enterprises have unique advantages. The strength of these industry companies has been further strengthened in the supply side reform. Therefore, just developing manufacturing industry is like looking at the sky and pointing to the ground with a cone.
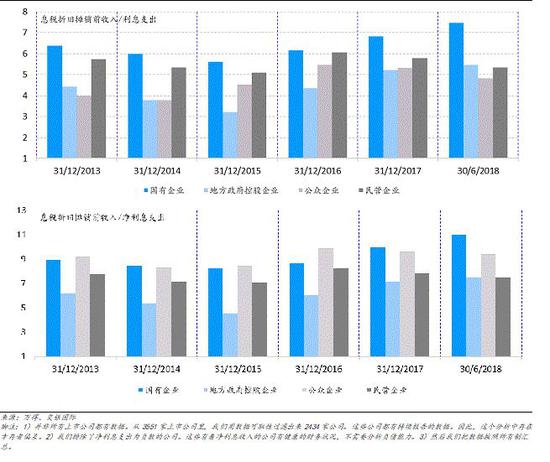
By measuring and summarizing the EBITDA/net interest coverage of each company, we can analyze the debt repayment ability of listed companies. We summarize the financial data of listed companies from bottom to top and group them according to the ownership structure. In fact, we find that while private enterprises have weakened to some extent, the debt repayment ability of state-owned enterprises and local governments has improved in the past five years. Nevertheless, the net interest coverage rate of private enterprises is still about 7 times, that is, it is at a reasonable level relative to any standard( Figure 7 )。
Recently, many people are worried that the market downturn will lead to an explosion of equity pledge positions. In our quantitative analysis, we found that since the beginning of 2005, the absolute amount of equity pledge and its ratio to the total market value have significantly increased. Even if the stock market bubble burst in 2015, it only temporarily suppressed the growth rate of equity pledge. The total market pledge ratio showed an upward trend until March 2018, and then decreased sharply. This shows that with the acceleration of the market crash, the demand for stock pledge to cover positions also increases - for the market downturn at that time, margin calls at this moment are like stepping on the accelerator to accelerate, and exacerbate the volatility of the entire market.
However, since the whole emerging market has been under obvious selling pressure since the end of January, and since the bursting of the stock market bubble in 2015, the market pledge share ratio has been growing along with the repair of the market, equity pledge loans may not be the cause of the bear market, although it does exacerbate the bear market. At the same time, the sharp fluctuations in the US market have also made things worse - this is the result of the downward resultant force generated by the convergence of the short cycle operations of the Chinese and American economies. In the next part of the report, we will continue to discuss the short cycle of China US economy.
chart seven : listed company EBITDA / Net interest coverage
 III. Short cycle of China US economy
 "The only lesson we can learn from history is that we will not learn anything from history." - Hegel
three point one The most pressing problem
The US economy has a 3.5 year cycle( Figure 8 )The cycle in China is three years. In the following space, we will use charts based on quantitative analysis to illustrate the cyclical characteristics of the China US economy.
After our first paper on quantitative business cycle, entitled "China's authoritative guide to business cycle", was published in March 2017, we were invited to teach an open class on business cycle in one of China's most prestigious universities. At that time, a famous outstanding economist joked: "Can you use this cycle theory to trade? How can you be sure that it will be the same next time?"
Admittedly, forecasting is difficult, especially when it comes to predicting the future. Although all models are wrong, there are still some models that are useful. The significance of any periodic model is to evaluate and predict the potential trends that are difficult for many people to detect, as well as the approximate time of inflection points. Although there is no guarantee that such a prediction will be fulfilled, it increases the possibility of trading profits. By the way, in early December 2017, we published《 Outlook for 2018: Infinite Scenes 》2018 Outlook Report. The conservative and pessimistic view is based on the final decline stage of China's three-year cycle. This empty opinion was contrary to the generally optimistic consensus at that time. Since its peak at the end of January, the Shanghai Composite Index has fallen by about 30%. Now the most urgent question is: where is the bottom?
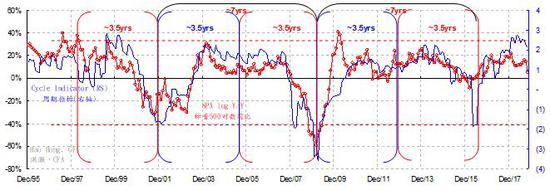
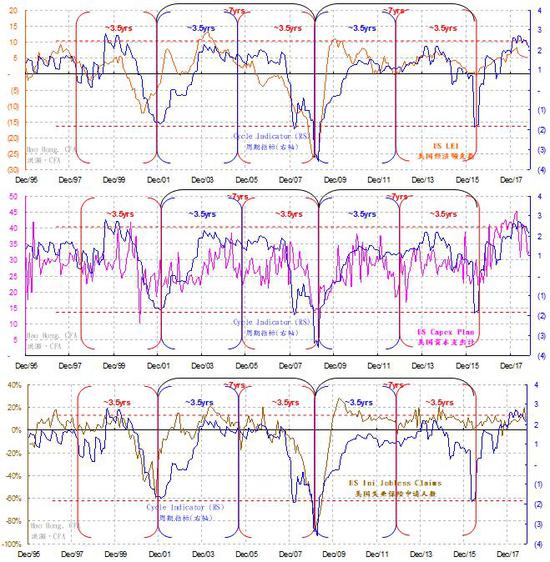
Figure 8: Comparison between the short cycle of the US economy and the Shanghai A-share price earnings ratio. The short cycle of the US economy has peaked.
3.2 Short cycle of American economy
“ In economics, what we mean by cycle is usually seven reach eleven We all agree to call it "China Wave". Recent evidence suggests that three The shorter period of half a year may also exist... The duration of the medium wave is at least between seven reach eleven Between years "—— The Long Wave of Economy, Nikolai Kondratyev
stay Figure 9 In, we use the adjusted earnings per share of the S&P 500 index to measure the short-term fluctuations of the U.S. economy. Our chart analysis shows that the US economy obviously has a 3.5 year cycle. Two 3.5 year short cycles form a complete 7-year middle cycle from the bottom to the next bottom. We are Figure 9 The following conditions were observed in:
1) Since 1994, there have been six 3.5 year short cycles and three 7-year medium cycles (as shown by the blue and red arcs above the timeline at the bottom of chart xxx). The most recent two complete intermediate periods are from December 2001 to December 2008 and from December 2008 to December 2015, while 2005 and 2012 are respectively cyclical intermissions.
2) In the first 3.5 year short cycle within the 7-year medium cycle, when the short cycle ends the upward trend and then the downward trend breaks through the medium cycle (marked by a blue circle), there is often a regional crisis (indicated and marked by a blue shaded time period). For example, the Asian financial crisis in 1997 and Russia's default in 1998, as well as the European sovereign debt crisis in 2011 and the historic sovereign rating downgrade of the United States. The current crisis in Turkey and Argentina seems to be a medium-term crisis of this nature.
3) In the second half of the seven-year cycle, when both the 3.5 year short cycle and the seven-year cycle begin to decline at the same time (indicated by red circles), a larger scale crisis will often occur. For example, the bursting of the Internet bubble in 2000, the September 11th terrorist attacks in 2001 and the US economic recession, and the global financial crisis in 2008 (shown and annotated in the red shadow period). Although few people discussed it, in fact, the decline of the US stock market in 2001 and 2008 was about the same - both halved. These two deep crises gave us a reasonable time anchor to calculate the duration of the cycle. The positive impact of the upward trend on asset prices tends to last longer than the negative impact of the downward trend.
4) History shows that the challenges facing the global market may be the last part of the 11 year cycle. This medium cycle includes three 3.5 year short cycles, starting from the beginning of 2009 and ending at the beginning of 2019. But it may also be the first 3.5 year short cycle in a 7-year medium cycle starting from the beginning of 2016. This slightly shorter 7-year cycle includes two 3.5 year short cycles. If so, the level of turbulence in the future will be far less serious than that caused by the end of the 11 year cycle.
5) In the coming months, China's own three-year economic cycle is entering the final downward phase. Our model conclusion shows that this downward phase of the Chinese cycle is just consistent with the later downward phase of the 3.5 year short cycle of the United States (4Q18 - 1Q19). We will update our China business cycle model later in this report. This will be a turbulent season. Although the Chinese stock market has become much cheaper, the timing coincidence of this cycle stage may be the reason why it is difficult to find the bottom of the current Chinese stock market.
Figure 8 It was drawn by us using the Bloomberg chart tool. Although it is reasonable and has visual impact, we need quantitative modeling to verify its tightness. from chart nine reach chart eleven We use the monthly data of adjusted earnings per share to simulate the short and medium cycles of the US economy. Our quantitative model can clearly show the 3.5 year short cycle of the U.S. economy over the past 20 years and the 7-year mid cycle that includes two 3.5 year short cycles.
Then, we superimpose the US macroeconomic variables such as the S&P 500 index, industrial output, capacity utilization, economic leadership indicators, capital expenditure plans and employment with the US business cycle indicators. Readers can clearly see the close relationship between these variables and cycle indicators.
It is worth noting that the correlation between market prices, outputs, trading volumes or surveys proves the effectiveness of our periodic model: the periodicity defined here cannot be simply dismissed as contingency. All these important time series show clearly defined durations of similar length. Although these data have undergone complex statistical and mathematical processing, their important turning points are largely consistent.
There are few common cases that deviate from the general rules in these periodic sequences. Even if there is a deviation from the fundamental trend, this deviation is often only the potential energy that will accelerate or hinder its own operation, rather than the fundamental trend itself. This rare deviation itself is noteworthy and periodic evidence.
In fact, the 3.5 year short cycle of the US economy is basically the same as the 3-year cycle of the Chinese economy. We previously published in March 2017, entitled《 An authoritative guide to China's business cycle 》The three year cycle of China's economy has been proved quantitatively in the report of. The 6-7 year mid cycle, which consists of two short cycles, is basically the same in the two economies. The convergence of short and medium cycles in China and the United States will inevitably have a profound impact on economic and market performance, as well as policy choices.
Figure 9: A quantitative comparison between the 3.5 year short cycle of the US economy and the S&P 500 index. The short cycle of the US economy has peaked.
3.3 Practical observation and policy choice
In the preceding and subsequent discussions, we used econometrics to define the 3.5 year economic short cycle in the United States and the three-year economic short cycle in China. It is precisely because of the ebb and flow of the economic cycle that we have observed the similarity and simultaneity of macroeconomic variable fluctuations in various countries. The cycle seems to fluctuate rhythmically around its established trend. We don't have to dwell too much on the difference between the two quarters of the short cycle in the United States and the short cycle in China, because the cycle cannot be as precise as the quartz alarm clock.
In his groundbreaking work Long Wave of Economy, Kondratyev discussed the difference between short/medium cycle and long cycle. He seems to disagree with some critics that the mid cycle is driven by the capitalist system and is "catalyzed by accidental, non economic circumstances and events, such as: 1) technological progress; 2) war and revolution; 3) the integration of new countries into the world economy and 4) fluctuations in gold production." On the contrary, He believes that these changes that seem to have changed the course of history are actually cyclical.
For example, technological progress may have occurred several years before the turning point of the cycle, but new technologies cannot be put into use immediately under adverse economic conditions; War and revolution may be the result of competing for scarce resources to develop the economy; With the expansion of demand in the old world, the desire to open up new markets has intensified New World And gradually integrate into the old world; The increase in gold production is the result of the increase in money demand brought about by economic expansion.
These conjectures have fully demonstrated reasons and practical observations, and help to clearly understand the experience in recent years. China's release of liquidity for shantytown reconstruction in 2014, China's market bubble in 2015, Trump's victory in the US presidential election in 2016, and the recovery of commodity prices since 2016 due to China's supply side reform, as well as the escalating trade war, may all be endogenous to the capitalist system. Although these historical events have had a profound impact on the market, the different stages of the economic cycle, different supply and demand patterns, and their impact on market prices can help people observe and explain these events. Emotional fluctuations synchronized with market prices may cause us to pay attention to these events.
If so, as the 3.5 year short cycle of the United States peaked before it broke through the 7-year middle cycle, Trump will be more reckless and relentless in the negotiation of trade frictions, which will eventually lead to the decline of the temporarily seemingly powerful and invulnerable American market. At the same time, this inflection point in the short cycle of the United States may surprise the current market consensus that is generally bullish, thus leading to unexpected major adjustments. Finally, the deceleration phase of China's three-year short cycle will bring down the US economy.
Figure 10: Quantitative comparison of the short cycle of the U.S. economy with various macroeconomic variables. The short cycle of the US economy has peaked 。
Figure 11: Quantitative comparison of the short cycle of the U.S. economy with various macroeconomic variables. The short cycle of the US economy has peaked.
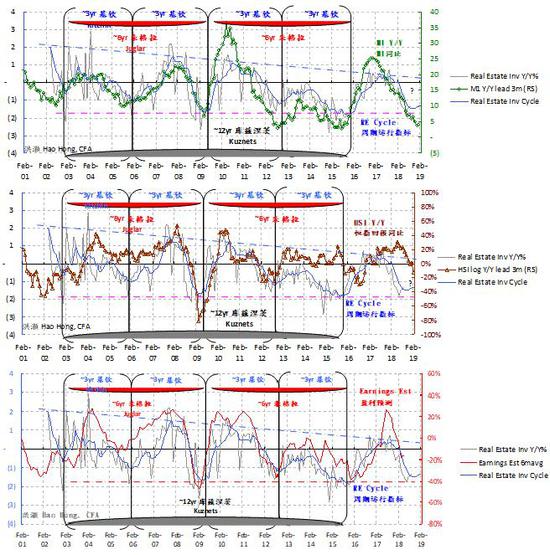
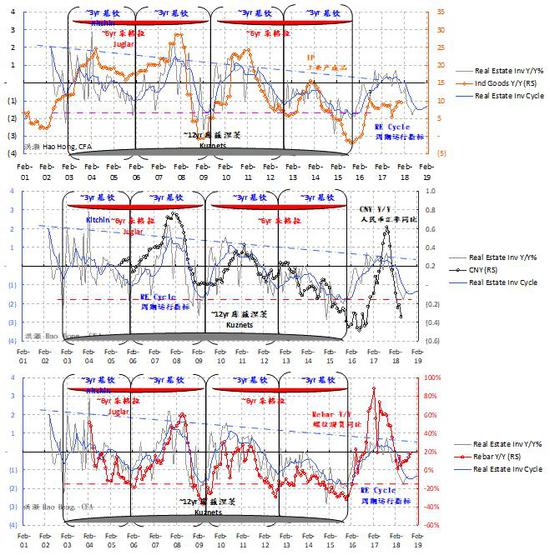
3.4 Short cycle of China's economy
Published in March 2017 entitled《 An authoritative guide to China's business cycle 》For the first time in our report, we described the three-year cycle of China's economy in a quantitative way. By analyzing the deviation between the real estate investment growth data and its long-term trend, we obtained the rule of our three-year cycle. Up to now, China's economic operation has nearly five very clear three-year cycles: 2003-2006, 2006-2009, 2009-2012 and 2012-2015, as well as the upcoming cycles from the fourth quarter of 2015 to the present.
To verify this three-year cycle, we compare it with the volume price data of other macroeconomic variables in China. We have proved that the trend of rebar price, interest rate, industrial output, stock index and profit forecast and other indicators are closely related to the three-year cycle (not all comparisons are shown in this report. For a detailed discussion of China's economic cycle, please refer to our 20170323 report《 An authoritative guide to China's business cycle 》)。 This shows that the three-year cycle can explain the trend of other macroeconomic variables( Figure 12 )。
From all the data available to us in the past 20 years, we can see that the long-term trend of China's economic cycle is downward, and the high and low points of each cycle are constantly falling. This long-term downward trend is not difficult to understand: China's huge investment scale and rapidly increasing leverage constrain the marginal return of new investment and limit the space for further effective investment in economic development.
We believe that the duration of the cycle is related to the construction cycle of real estate. For example, to build a 30 storey residential building, the construction completion time is about 9-12 months, and the water and electricity installation takes about 3 months, plus the time for safety inspection and various approvals. The completion time is about 1.5-2 years. After that, it will take about one year to digest the housing inventory, so that the inventory investment cycle of the real estate is about three years.
We note that the three-year cycle from the end of 2015 to the beginning of 2016 has obviously reached its peak and is gradually bottoming out. In the coming months, the momentum of economic slowdown may intensify and become more obvious, which will increasingly attract the attention of market consensus( Figure 12 )。 Therefore, although the market has reached the bottom range, its recovery will be hindered by fluctuations in overseas markets, the most obvious of which is from the United States.
Figure 12: China's three-year economic cycle is gradually bottoming out.
Figure 13: China's three-year economic cycle is gradually bottoming out.
IV. Market Outlook
In 2019, bond yields will continue to decline; Our stock bond yield model and our long-term quantitative allocation model show that the Shanghai Stock Exchange Index has entered the bottom area( Figure 14 )。 However, it is worth noting that the absolute bottom of the market index is different from the bottom range. The bottom is the lowest point of a market index, and the bottom is a region. The bottom, that is, the absolute lowest point, can only be verified after a long period of time. The bottom area can be reasonably defined. The market in the bottom region is often particularly turbulent, because traders adjust positions, and market expectations will also be reshaped. In short, market bottoming is a process, and market bottoming is a point determined afterwards.
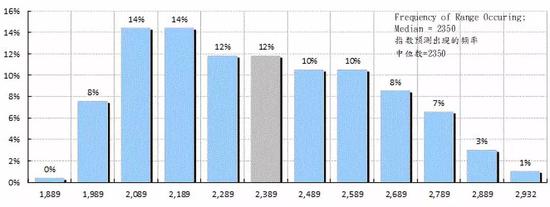
Our stock bond yield comparison model (hereinafter referred to as EYBY model) predicts that within the next 12 months, the Shanghai Stock Exchange Index will trade in a range slightly lower than 2000 to 2900 points, with the center of the trading range being about 2350. That is to say, the Shanghai Stock Exchange Index will run above 2350 at least half the time( Figure 14 )。
Figure 14: Our EYBY model shows that the Shanghai Composite Index is rapidly approaching the bottom range.
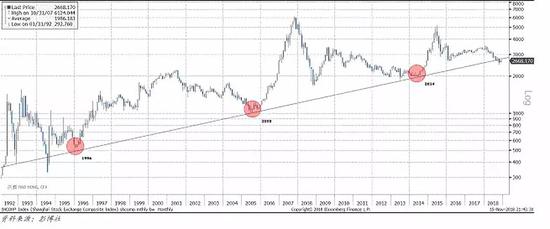
More than two years ago, in our publication entitled《 Market bottoming out: when and where 》In our report (20160604), we believe that the definition of market bottom should be relative to the long-term economic growth. We find that there is a logarithmic linear relationship between the annualized rate of return of the Shanghai Stock Exchange Index and the GDP growth target implied in China's multiple five-year plans since 1986( Figure 15 )。 In this report published two years ago, we wrote that if this logarithmic linear relationship is still valid, theoretically the market bottom should be around 2450 points.
On October 19, 2018, the Shanghai Composite Index plummeted to 2449.197 points before rebounding. In the past two years, we have recorded the phenomenon that a "mysterious force" prevented the Shanghai Stock Exchange Index from running to its theoretical bottom, and showed our conclusions to high-level decision-makers( Figure 15 )。 Recently, public data shows that the "national team" has completed its historical mission and started to adjust its position into ETF index funds. If the trade war will affect the operation of China's economy for a long time, and China continues to carry out structural reform, then the endogenous growth rate of China's economy will decline. The corresponding theoretical base of the market will be lower than the 2450 points we calculated two years ago. The median trading range of 2350 points predicted by our EYBY model is basically consistent with this observation.
Figure 15: EYBY shows that the trading range of Shanghai Stock Exchange will be slightly lower than 2000 points - 2900 points in the next 12 months; The median value is~2350 points.
Our EYBY model helped us confirm the bottom of China's stock market at that time after the middle of 2014, and timely pointed out the peak of China's stock market bubble in June 2015. After the bubble burst, this model also helps us to avoid risks in the complex market environment in the post bubble period and improve investment returns for investors.
Twelve months ago, the EYBY model predicted that the trading range of the Shanghai Stock Exchange Index in the next twelve months would be 2800 – 3800, while the actual trading range would be 2450 – 3600. Although our forecast at that time was very pessimistic compared with the consensus of the bullish market at that time, we were still too optimistic because we did not fully consider the impact of the trade war. In addition, the model predicted that the Shanghai Composite Index would hover below 3200 points for more than six months in the next 12 months. In fact, only 100 of the 260 trading days since the release of the report have kept the index above 3200 points.
In December 2014, when we were looking forward to 2015, the EYBY model predicted the upcoming market bubble in 2015, but still believed that the closing price in 2015 would not significantly exceed 3400 points. On the day after the last trading day in 2015, the first trading day in 2016, the Shanghai Stock Exchange closed at about 3300 points; In December 2015, when we were looking forward to 2016, the EYBY model predicted that the trading range of the Shanghai Composite Index in 2016 was 2500 – 3300, and the actual trading range in 2016 was 2638 – 3301; When looking forward to 2017 in December 2016, the EYBY model predicted that the Shanghai Composite Index would hover below 3300 points for at least eight months in 2017. The SSE did not break 3300 points for the first time until August 25, 2017, which is more than eight months after our prediction in early December 2016.
With the rotation of funds from bonds to stocks, the increase in stock valuation relative to the rate of increase in bond yields will determine the final increase in the stock index. With the release of liquidity, bond yields will continue to decline.
Chart 16: SSE operates near the long-term trend line. The compound annual growth rate is equal to the GDP growth target implied in the five-year plan.
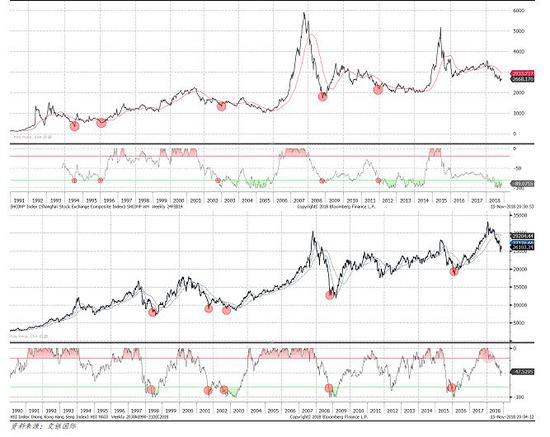
Figure 17: Shangzheng enters the bottom area. However, grinding the bottom is long; The HSI will run Input.
V: Appendix
Appendix 1: Other Cities: Mortgage Expenditure as a Percentage of Household Disposable Income (1/5)
Appendix 1: Other cities: the proportion of mortgage expenditure in household disposable income (2/5)
Appendix 1: Other Cities: Mortgage Expenditure in Household Disposable Income (3/5)
Appendix 1: Other Cities: Mortgage Expenditure in Household Disposable Income (4/5)
Appendix 1: Other Cities: Mortgage Expenditure in Household Disposable Income (5/5)
(The author introduces: Managing Director and Chief Strategist of BOCOM International. CFA, graduated from Beijing University of International Business and Economics and the University of New South Wales in Australia.)