Article/Lu Ping, columnist of Sina Financial Opinion Leader
The scissors difference in this round continued to grow. In October, the PPI hit a new high in the year. In November, the PPI began to turn, and the scissors difference with CPI peaked and fell back. The subsequent probability continued to converge. We think it is more meaningful to learn from the performance of the stock market in the downward phase of PPI-CPI from February 2020/4, 2017. It is suggested to focus on the growth and consumption styles.
Summary:
Since 1999, there have been seven rounds of typical PPI-CPI scissors gap peaked in China, respectively in July 2000, February 2003, November 2004, August 2008, May 2010, March 2017 and October 2021 (the current round of scissors gap). Looking back at the historical data, China's PPI-CPI scissors have basically been in a state of substantial fluctuations. From 1999 to 2011, China's PPI and CPI basically kept synchronized fluctuations, and the transmission of PPI and CPI was closer. Since then, China's GDP and CPI fluctuations have narrowed, and the PPI CPI scissors have fluctuated back and forth due to PPI fluctuations, showing cyclical changes.
Since the outbreak, the global economy has recovered from the downturn. Stimulated by the loose monetary policies of major economies, the demand of developed countries has been repaired faster; However, the supply side continues to be limited under the influence of the epidemic situation, leading to the mismatch between supply and demand. Overseas commodity prices continued to strengthen in the context of supply and demand mismatch and excess liquidity. However, with the implementation of the policy of ensuring supply and stable price in China, the price of domestic priced commodities such as coal has fallen from a high level. PPI fell year on year, CPI rebounded year on year due to consumption recovery, and the scissors gap between PPI and CPI narrowed.
The widening of the scissors gap between PPI and CPI means that the gap between upstream and downstream supply and demand is expanding, while narrowing means that supply and demand are closing The scissors gap in this cycle has narrowed, and the impact of PPI is dominant. PPI represents the price of products at the front of the value chain, which more reflects supply. Looking back at the first six cycles, we divide the downward phase of the historical scissors difference into two categories according to whether it is significantly affected by supply: cycles that are significantly affected by supply factors (July 2000 February 2002, February 2003 November 2003, February 2017 April 2020) and cycles that are less affected by supply factors (November 2004 July 2007, August 2008 August 2009, May 2010 July 2015) Since this round of convergence of the scissors gap is mainly driven by supply factors, we focus on the downward phase of the scissors gap, which is greatly affected by supply. The results show that consumer industries with demand support (such as medicine, household appliances, etc.) and industries with financial support (such as building materials, communications, etc.) have superior revenue performance. At the same time, according to the performance of the first six rounds of scissors difference that peaked and fell back, the pharmaceutical industry has a high income, and this round of scissors difference convergence proposal still focuses on the pharmaceutical industry.
The scissors difference in this round continued to grow. In October, the PPI hit a new high in the year. In November, the PPI began to turn, and the scissors difference with CPI peaked and fell back. The subsequent probability continued to converge. In terms of style index, supply factors led to the downward phase of PPI-CPI in 2000/7-2002/2 and 2003/2-2003/11. Behind its economic development was that China was joining the WTO to integrate into the international market, the domestic real estate market was just starting, and China's economy was entering the stage of heavy chemical industry. These two stages may not be very useful for the current economic transition, We think it is more meaningful to learn from the performance of the stock market in the downward phase of PPI-CPI from February 2020/4, 2017. It is suggested to focus on growth and consumption 。
1、 Macro background of previous scissors difference peak
Since 2020, under the impact of the epidemic, the supply of major commodities in the world has declined, pushing up commodity prices, and the PPI-CPI scissors gap has continued to grow. In the third quarter of this year, the PPI-CPI scissors gap entered a stage of accelerated growth, peaked in October, and began to fall back in November. With the introduction of relevant supply guarantee policies and the gradual recovery of production and consumption, the scissors gap is expected to continue to converge.
Looking at the evolution history of the scissors gap in China in the past 20 years, there are six obvious peaks: July 2000, February 2003, November 2004, August 2008, May 2010 and February 2017.
According to the reasons for the peak of the scissors difference, it can be divided into those with greater supply side impact (July 2000, February 2003, February 2017) and those with less supply side impact (November 2004, August 2008, May 2010).
This report, for the first time, uses the perspective of the causes of the PPI-CPI scissors gap peaking to analyze the asset allocation strategy after the convergence of the scissors gap in the next stage by combing the performance of asset returns in the downward phase of the scissors gap in history.
1. 2000: Supply driven scissors gap peaked against the background of slowing growth
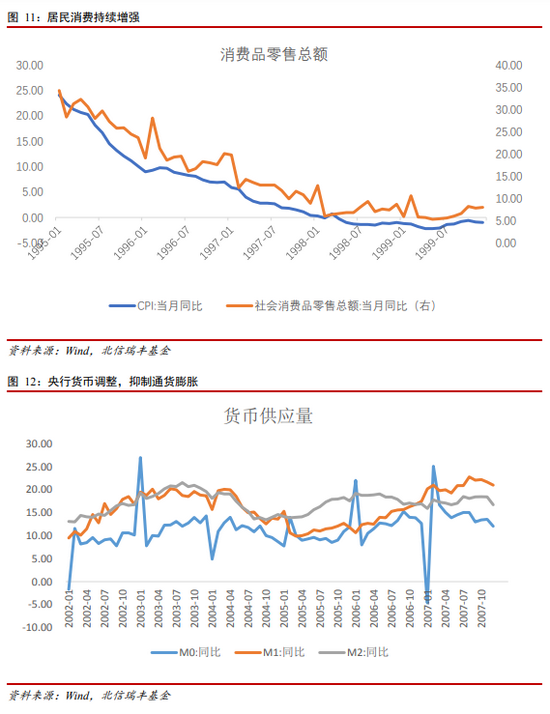
Entering the 21st century, China's economic environment is facing profound historical changes. Economic reform, opening up and economic development have entered a new stage. Since 1992, after six consecutive years of declining economic growth, three consecutive years of active fiscal policies and a series of reform measures, industrial production has increased, economic benefits have improved, social investment has started, and austerity has also eased. Although the economic operation has shown some positive changes, it still faces problems such as insufficient domestic demand, weak economic growth and deflation.
Since October 1997, the retail price index of social goods has shown negative growth for more than 20 months, and the characteristics of deflation have gradually emerged.
On the supply side, production is mostly repeated construction, unable to meet the actual demand. Due to the lack of self-discipline in investment and financing, blind participation in projects, and a large number of redundant construction problems, excessive investment led to serious overcapacity in many industries, which was also one of the important incentives for China's laid-off trend in the 1990s.
On the demand side,. Social reform has had a certain impact on public expectations, and residents' consumption desire is low. Since the mid-1990s, China has carried out in-depth reforms in housing, old-age care, education, medical care and other fields. Residents are pessimistic about future expectations: on the one hand, residents expect that the growth rate of future income will decline; On the other hand, it is expected that future expenditures will rise significantly. This expectation has a huge inhibitory effect on residents' consumption, resulting in insufficient consumption demand and thus inhibiting investment demand.
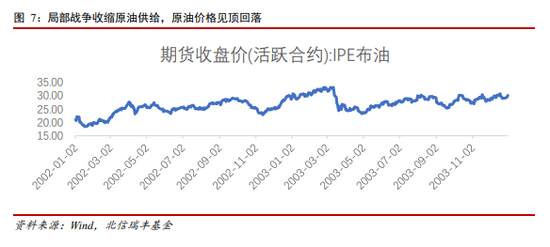
During this period, a rare financial crisis broke out in Asia. In the Asian financial turmoil, China has been under great pressure and insisted on not devaluing the RMB. Since China has adopted a more prudent financial policy and adhered to the prevention of financial risks, it has not been directly impacted by the crisis, and its finance and economy have remained relatively stable. However, the sharp depreciation of peripheral currencies and slowing demand led to a sharp decline in China's exports. On the other hand, during the war, in order to stabilize the oil price, OPEC decided in March 1999 to reduce the daily output of 2.1 million barrels of crude oil on the basis of the two production cuts in the previous year, resulting in a sharp rise in the price of crude oil and a corresponding sharp rise in the price of many chemicals.
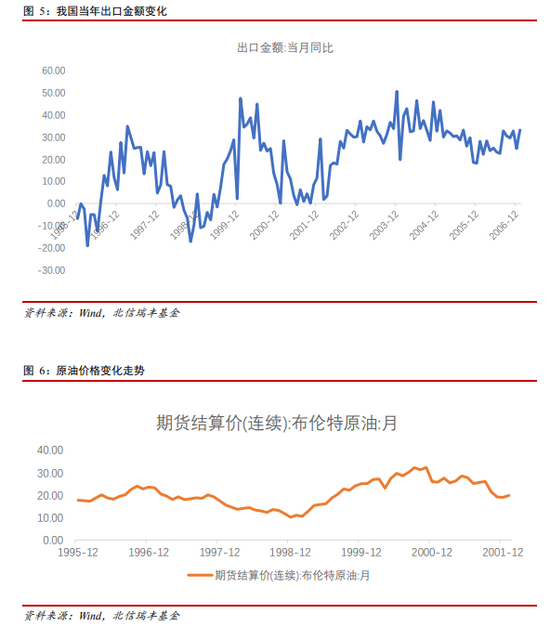
Under external pressure, China has implemented a proactive fiscal policy and a prudent monetary policy. Since the second half of 1998, the state has adopted a macro-control policy to expand domestic demand, and issued an additional 100 billion yuan of construction bonds; In 1999, China continued to take expanding domestic demand as the basic foothold of macroeconomic regulation. In terms of fiscal policy, it maintained a relatively high scale of issuance of national debt and increased investment in infrastructure; Improve the export tax rebate rate and promote the growth of foreign trade exports; It also cut interest rates seven times in a row, stimulated the demand for corporate loans, increased support for economic growth, accelerated the development of personal consumer credit, and guided and encouraged residents to consume.
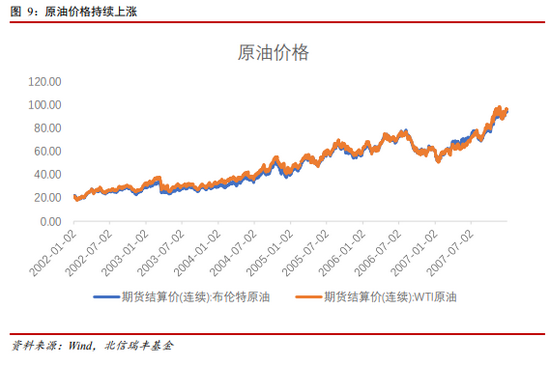
2. 2003: Local war shrinks crude oil supply, and low consumption is also an important incentive
Since March 2002, the PPI-CPI scissors gap has gradually expanded. PPI rose significantly, CPI changed slowly, the scissors gap peaked in February 2003, and the stage of differentiation and expansion ended, and the two gradually converged. From the end of the 20th century to the beginning of the 21st century, conflicts between the United States and Iraq and other Middle East countries continued. The war crisis has a certain impact on oil exploitation. In February 2003, the Iraq War broke out, and the crisis finally became a reality. Against the background of regional conflicts, oil prices rose sharply, industrial costs rose, and PPI rose significantly.
From March 2002 to February 2003, the international crude oil price almost doubled, which had an impact on China's industry. Since 1993, China's dependence on overseas oil has been rising, and the upstream of China's industrial chain is facing supply pressure. However, under the dual strategy of strategic adjustment of economic structure and new industrialization reform, the domestic industrial chain has gradually recovered. In addition, the OPEC meeting increased the crude oil quota, the crude oil supply gradually recovered, and PPI finally peaked and fell back.
At this stage, the domestic consumption level was not optimistic: on the one hand, the aftermath of the Asian financial crisis in 1997 was still in progress, and it was not until 2004 that it completely eased; On the other hand, the SARS outbreak in 2003 had a great impact on the lives of Chinese residents, and consumption was suppressed, so CPI was relatively moderate, and it was not until the end of 2003 that CPI gradually recovered.
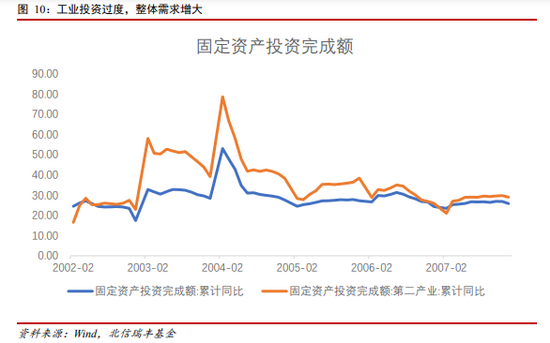
3. 2004: The rise in oil prices raised production costs, and the economy resumed simultaneous growth
The PPI-CPI rose significantly in December 2003, and reached a high point in October 2004. It peaked and fell back. The international oil price continued to rise after a slight fall in February 2003. Although it rose again in October 2004, it still maintained sufficient growth momentum. By analyzing the reasons, on the one hand, the panic effect caused by frequent international terrorist events and local unrest has affected the supply of crude oil; on the other hand, the long-term turbulence has made some businessmen profitable by driving up oil prices. In addition, the price of crude oil is dollar based, and the Bush administration's anti-terrorism, tax cuts and other measures have increased the government's fiscal deficit. In 2004 alone, the US government deficit reached 475 billion US dollars, which forced the US government to print money significantly, leading to the devaluation of the US dollar and the rise of crude oil prices. Until October 2004, the high oil price forced the US government to use 4.2 million barrels of strategic oil reserves. Although the oil price has corrected in the short term, the long-term oil price still keeps rising.
At the same time, domestic industrial demand increased significantly during this period. Long term industrial development has achieved certain results. The rapid development of industry has given some speculators an opportunity to make excessive investment in steel, electrolytic aluminum and other industries. In addition, the SARS epidemic has gradually passed, the impact of the financial crisis has gradually subsided, and the industrial development situation is good. The substantial increase in the demand of the industrial chain in the middle and lower reaches further drives the growth of the price of upstream raw materials. Combined with international oil prices, the PPI finally rose significantly. It was not until October 2004 that the oil price was slightly adjusted, coupled with domestic policies to adjust the industrial structure and prevent excessive investment, that PPI gradually returned to stability.
In addition, due to the impact of economic recovery, consumer demand continues to increase, and retail sales inject momentum. The downstream demand of the industrial chain has been greatly enhanced again, thus promoting the high-speed development of the entire industrial chain. In addition, with the control of the epidemic, export trade resumed high growth, further enhancing economic vitality. The rapid economic development is accompanied by moderate inflation, and the interaction between upstream and downstream of the industrial chain leads to the rapid rise of CPI linked PPI. In order to regulate the economy and prevent excessive inflation, the Central Bank began to reduce the money supply in the middle of 2004. Finally, after a long period of macro-control and cyclical adjustment of the market, the overheated economy gradually recovered and stabilized, PPI and CPI both fell back, and the PPI-CPI scissors also gradually recovered.
4. 2008: The subprime crisis hit exports and pushed commodity prices up
In 2008, the PPI-CPI scissors gap showed an expanding trend. With PPI rising and CPI declining, the scissors gap peaked in August and then entered the convergence range. In March 2007, the risks of American mortgage loans surfaced, and the stock market responded sensitively, which preceded the decline of the economy and house prices, and in August 2007, there was a full collapse. Later, with the large-scale outbreak of the subprime mortgage crisis, the real estate market and the economy were greatly impacted. Under the background of global excess liquidity, a large number of funds withdrew from the stock market and the housing market and poured into the commodity market, thereby driving the prices of commodities such as bulk commodities, oil, iron ore and so on to soar.
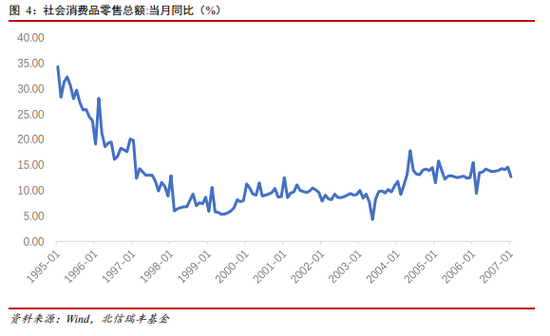
The soaring commodity prices have triggered inflation in major economies around the world, and China's PPI has also been affected by imported inflation. At the same time, in 2008, China was still characterized by an outward oriented economy. The outbreak and diffusion of the subprime mortgage crisis impacted external demand and directly affected China's exports. The sharp decline in exports also had a certain negative impact on China's consumption. However, thanks to the impact of the Olympic Games, China's consumption growth rate rose in 2008 as a whole, and the retail sales of social consumer goods increased by 13.5% in real terms, The growth rate was 0.8% higher than that in 2007.
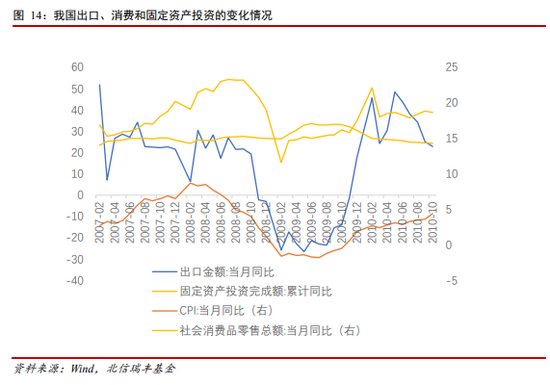
Although on the whole, the subprime crisis has not had a significant impact on China's fixed asset investment, it can be clearly seen from the split of fixed asset investment that the manufacturing industry and real estate development showed a significant downward trend in 2008, while infrastructure investment continued to rise after a significant decline before March 2008, This shows that the fixed asset investment did not fluctuate significantly on the whole, mainly due to the pulling effect of infrastructure investment.
Figure 15: Manufacturing, real estate and infrastructure investment
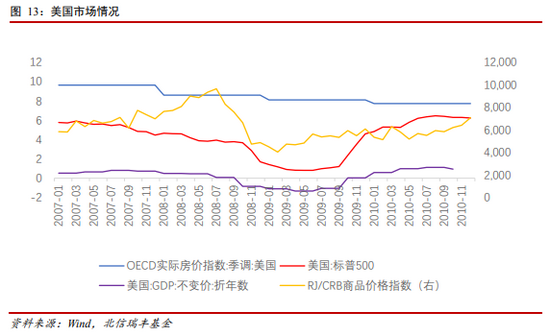
In terms of macro policies, in the first half of 2008, China's overall policy direction was tight, and the central bank raised the deposit reserve ratio for six consecutive times. After the crisis broke out, the Standing Committee of the State Council determined a proactive fiscal policy and moderately loose monetary policy in November, and launched a four trillion yuan economic stimulus plan to further expand domestic demand and promote steady and rapid economic growth.
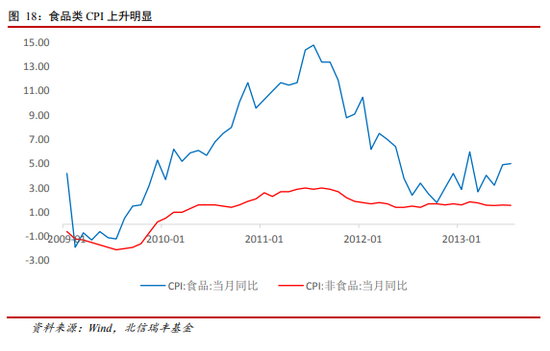
5. 2010: The sustained recovery of the international economy brings inflationary pressure, and the rapid rise of CPI promotes the convergence of the price scissors
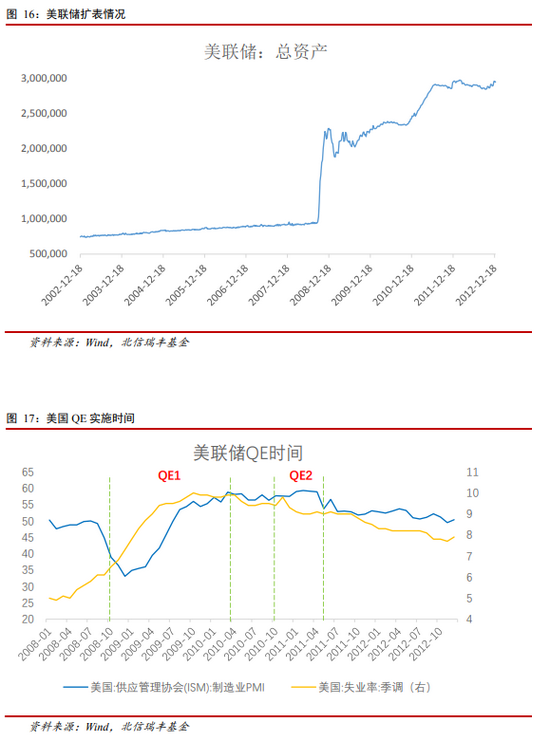
In 2010, PPI rose rapidly and CPI rose slowly. The PPI-CPI scissors spread also showed an expanding trend and peaked in May. After that, affected by food prices, CPI climbed rapidly and entered the convergence zone. In 2010, the United States continued to implement the expansion policy. After the first round of quantitative easing policy ended in March, the unemployment rate was still unsatisfactory and remained above 9.4%, so the United States implemented the second round of quantitative easing policy in November 2010. At the same time, overseas economies showed a sustained recovery trend, which on the one hand supported the price of industrial products, on the other hand, it also brought imported inflation pressure to China. The European debt crisis, which began to ferment in December 2009, also had a certain impact on China's exports.
Domestically, the four trillion yuan economic stimulus plan proposed in 2008 brought about large-scale investment in 2009, making China's potential output of various services and products in 2010 have been greatly improved. In the face of economic growth, the total supply is basically unconstrained. At the same time, the continuous recovery of the global economy has also helped promote the growth of China's exports. In 2010, China's foreign trade increased significantly by 22% year on year, which is conducive to economic growth. The PPI-CPI scissors difference entered the convergence range after peaking in May, which was mainly affected by the rapid rise of CPI, especially food prices agriculture products Price is an important reason for CPI increase. In 2010, the southwest region, one of the main producing areas of agricultural products in China, suffered from a long-term drought and poor output. In addition, the flood disaster caused widespread disaster in the southern grain areas, and the supply of agricultural products was greatly impacted. At the same time, some social hot money also hyped garlic, mung beans and other agricultural products. These factors jointly pushed up the prices of agricultural products, which further led to the rapid rise of CPI in the second half of the year.
In terms of macro policy, the monetary policy in 2010 showed a tightening trend compared with that before, and the operation of raising the reserve ratio and interest rate was carried out for many times in 2010. At the same time, in order to curb the rapid rise of house prices, the central government also issued a series of real estate regulation policies in 2010, using both economic and administrative means to control the real estate market in an all-round way from the aspects of restraining demand, increasing supply, strengthening supervision, etc.
6. 2017: Supply side structural reform, the scissors gap between supply led and demand side weakened at the same time peaked
Before February 2017, China accelerated the supply side structural reform of "three removal, one reduction and one compensation", reducing the supply of major commodities; The reduction of crude oil production in the international market pushed up the cost price of bulk commodities, and PPI continued to rise. At the same time, the tightening of monetary policy has weakened demand, reduced the high PPI, and gradually narrowed the PPI-CPI scissors.
On December 21, 2015, the Central Economic Work Conference proposed the supply side structural reform policy of "capacity reduction, inventory reduction, deleveraging, cost reduction, and weakness remedy". With the continuous promotion of this policy, the supply shortage has pushed up the continuous rise of commodity prices. Among them, coal, steel and other upstream industries have the most prominent influence. The figure below shows the trend of PPI in key industries of capacity reduction. It can be seen that after the end of 2015, PPI has a strong upward cycle. In addition, the asset liability ratio of enterprises has gradually declined with the advance of supply side structural reform.
Figure 19: PPI trend of major industries in capacity reduction
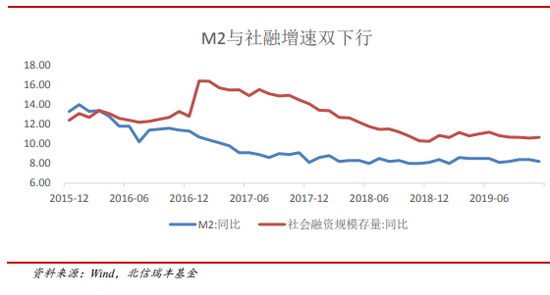
At the same time, the marginal tightening of monetary policy has led to the weakening of demand. M2 and social finance have declined in both directions, which has led to the weakening of the demand side and the transformation of PPI from high to low.
Figure 21: Double downward trend of M2 and social finance growth
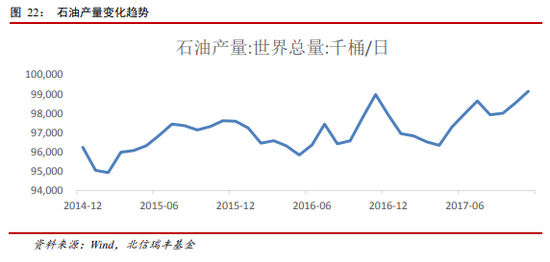
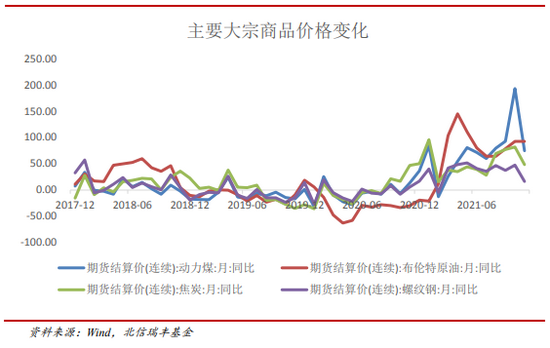
The decline in overseas crude oil production pushed up the prices of major commodities, which was also the main factor influencing the rise of PPI in this round. It can be seen from the figure below that in November 2016, the international crude oil production declined to a certain extent, and the prices of major commodities rose in the same period.
Figure 23: Trends of major commodity prices
7. 2021: The epidemic hit the global supply chain, and the supply decline pushed the PPI to peak
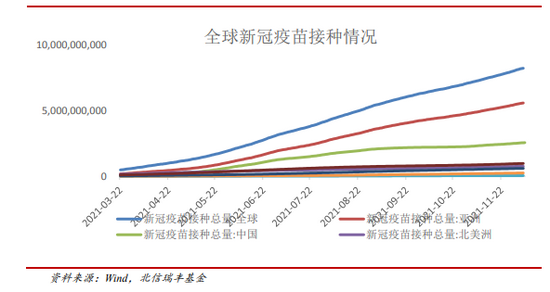
In 2021, the COVID-19 epidemic will spread around the world, the number of newly diagnosed cases in various countries will continue to rise, the output of major commodities in the world will continue to decline, the insufficient supply of products will lead to price increases, and PPI will continue to rise. In contrast, the number of confirmed cases has always been kept at a low level and production has recovered quickly since the epidemic situation in China adhered to the "zero clearing" policy. At the same time, with the gradual increase of vaccination coverage worldwide, the supply and demand will regain balance after the recovery of the industrial chain. As we expected, the scissors gap of PPI-CPI will peak and fall in the near future.
In terms of supply, some resource countries are still affected by the epidemic, and the export of some resource products is still limited. Taking the supply of non-ferrous metals such as copper as an example, South American countries such as Chile and Peru account for nearly 40% of the world's supply. However, due to the poor control of the epidemic, the two countries are unable to match the demand for market growth because of the impact on the export scale of copper mines. In addition, the epidemic situation in resource exporting countries such as Brazil has lasted for a long time, which has affected the supply of global raw materials to some extent.
Figure 26: Global New Crown Vaccination
At home, with the epidemic gradually under control, production recovered quickly, and production quickly recovered to the pre epidemic level after eliminating the impact of the epidemic and other interference factors. In November 2021, the purchasing managers' index (PMI) of China's manufacturing industry rose, higher than 50% of the boom and bust line, and entered the expansion range. However, although the rise of PMI in total volume indicates the economic recovery, the contradiction between supply and demand is still obvious. This is reflected in the sharp increase of PMI on the production side, while the PMI on the demand side only increased slightly (measured by new orders). The contradiction between supply and demand is still one of the short-term uncertainties. However, with the gradual progress of resumption of production, it is expected that the PMI trend will further rise, and the supply and demand gap will narrow.
Figure 27: Purchasing Manager Index of China's Manufacturing Industry
Internationally, in order to stimulate the rapid recovery of the economy from the epidemic, the United States has implemented a large-scale quantitative easing policy. For example, on March 15, 2020, the Federal Reserve announced its interest rate resolution, significantly reduced interest rates to the "zero floor" (0% - 0.25%), and launched a $700 billion quantitative easing program. The large-scale quantitative easing policy has pushed up the global inflation. The inflation rate of all major economies in the world is in an upward cycle, and the prices of all major commodities are rising. Although the period was slightly volatile, major commodities entered a round of rising cycle around 2021.
Figure 28: Changes in US Federal Funds Rate
Figure 30: Price changes of major commodities
At the same time, in terms of domestic policies, the meeting of the Political Bureau and the Central Economic Work Conference in December 2021 clearly proposed that economic work in the next year should be "at the forefront of stability and progress in stability", reducing the market's concern about the possibility of a hard landing of the economy, improving corporate earnings expectations, and significantly benefiting the stock market. At the same time, the statement on energy policy at the meeting tends to ease, and the direction of "first stand before break" is clear, such as "carbon peaking, carbon neutralization", "the gradual withdrawal of traditional energy should be based on the safe and reliable substitution of new energy", "the basic national conditions of coal based", "The new renewable energy and raw material energy use will not be included in the total energy consumption control", and the efforts to ensure the supply and stable price of basic commodities will not be reduced. It is expected that the price of bulk commodities will be generally controllable. Therefore, the market unanimously expects that the PPI-CPI price scissors will gradually peak and fall, and there will be a significant rise in the A-share market.
2、 Allocation strategy of major categories of assets in the downward phase of scissors difference
1. Industry based investment strategy: industries with demand support perform better
In terms of industries, in different periods when the supply side impact is greater or less, the income ranking of each industry in the downward phase of the scissors difference is significantly differentiated. According to whether the supply side impact is prominent, we divide the six downward stages into two categories: the types with greater supply side impact (July 2000 - February 2002, February 2003 - November 2003, February 2017 - April 2020), and the types with less supply side impact (November 2004 - July 2007, August 2008 - August 2009, and May 2010 - July 2015). Each category has three stages. During industry analysis, we defined the industries with at least two of the three stages ranking in the top 10 and the average income of the three stages ranking in the top 10 as relatively high income industries.
Considering that the convergence of this round of scissors difference is mainly driven by the supply side, we focus on the investment strategy when the supply side has a large impact. It can be seen from the following figure that when the supply side impact is large, it is recommended to focus on consumer industries with demand support (such as medicine, household appliances, etc.) and industries with financial support (such as building materials, communications) in the downward phase of the scissors difference. Referring to the supply side background of this round of PPI-CPI scissors gap peaked, it is suggested to increase investment in medicine, building materials, communications and household appliances industries in the next stage. At the same time, considering that the pharmaceutical industry had a high income in the period when the six PPI-CPI scissors difference peaked and fell, the performance of the pharmaceutical industry should be paid special attention in this round.
Figure 31: Revenue ranking of industries with large supply impact
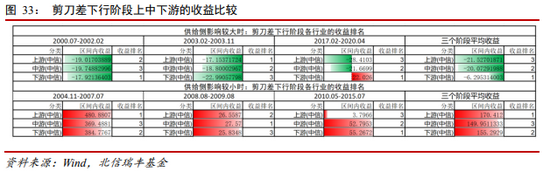
2. Investment strategy based on upstream and downstream industry chain: downstream profit space is wider and income is more stable
In terms of industrial chain, when the PPI-CPI scissors gap is relatively narrow, the downstream industry's profit space is widened and profitability is improved. Therefore, investment strategies that favor downstream industries are expected to obtain more stable returns. The figure below shows the comparison of upstream, midstream and downstream returns in the downward phase of the six price scissors difference. It can be found that when the supply side impact is large, the income of downstream industries is relatively stable. Especially from February 2017 to April 2020, when the influence of the supply side dominated, only the downstream industry maintained a high profit, and the middle and upstream industries all suffered from certain losses. When the supply side effect is small, there is no obvious differentiation rule in the upstream, middle and downstream. Considering that this round of PPI-CPI scissors difference peaked mainly driven by the supply side, we can pay more attention to investment opportunities in downstream industries.
3. Style based investment strategy: supply driven cycle is relatively strong, while demand driven finance is significantly dominant
From the perspective of the past six PPI-CPI downward stages, when the convergence of price scissors was mainly caused by supply factors, the average ranking of excess returns of the cyclical sector ranked first among the five styles, which indicates that the cyclical stocks are relatively strong in this situation and gradually release profit space, while the consumer sector ranked last. In addition, it should be noted that when supply factors lead to convergence of the price scissors, there is little difference in the performance of the financial, consumption and stability sectors. The supply factor has little influence, mainly because the demand factor drives CPI When the price difference converges due to the rise of the price scissors, the difference between the various style sectors is large, and the financial style sector is significantly dominant. The reason is that when the price level rises due to demand factors, the economic form is relatively good at this time, and the long-term yield of government bonds will also rise with more better economic forms. The financial sector, which mainly derives from the interest margin, will perform more strongly. In the past period of convergence of price scissors driven by demand factors, the excess return of the financial sector was significant, with the highest interval excess return reaching 129.02%, far exceeding the return of other style sectors.
The supply factor led to the downward phase of PPI-CPI in 2000/7-2002/2 and 2003/2-2003/11. Behind its economic development was China's accession to the WTO Integrating into the international market, the domestic real estate market started, and China's economy is entering the stage of heavy chemical industry. These two stages may not have much reference value for the current economic transition period. We think it is more meaningful to learn from the performance of the stock market in the downward phase of PPI-CPI, 2017/2-2020/4: focusing on growth and consumption.
4. Investment strategy based on large, medium and small markets: supply shocks tend to be stable in the large market, and bilateral uplink seeks small market returns
In the convergence stage of price scissors caused by supply shocks, large blue chip companies are more capable of maintaining the stability of their own industrial chains and profits; In the context of rising supply and demand, small cap companies rely on their own strong flexibility to seek benefits more easily. In terms of large, medium and small cap stocks, the average relative performance of large cap indexes is better than that of small and medium cap stocks in the period of downward price scissors. Small and medium-sized stocks often have weak resilience to unilateral shocks of supply. The relatively stable downstream industrial chain prices and high upstream raw material prices have added a huge burden to these smaller enterprises. From the data, it can be seen that only large blue chip companies with their own scale and more perfect industrial chain can achieve a certain degree of excess return in the stage of rising convergence of the scissors difference. The income of small and medium-sized enterprises tends to decrease significantly with the size. The industrial stability of large blue chip companies is the key to this situation. With both supply and demand rising, large blue chip companies can only change with their own industries because of the stability of their industrial chains. On the other hand, small cap enterprises, due to their own flexibility, can fully change the industrial chain and firmly grasp the market opportunities. In terms of data, small cap companies in the bilateral upward downward phase can even achieve an average excess return of about 10%, while in some years they can even achieve an average excess return of about 100%. Therefore, the buying strategy for large, medium and small markets is: supply shocks tend to be stable in the overall market, and bilateral upward movements seek small market returns. Considering that the downward phase of this round of scissors difference is mainly affected by the supply side, it is recommended to increase the allocation proportion of large cap stocks.
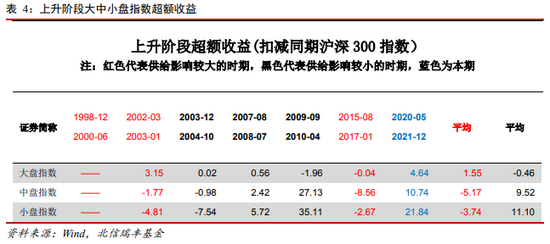
Table 5: Excess returns of large, medium and small cap indexes in the decline phase
Editor's note: partial deletion
(About the author: Chief Economist of Beixin Ruifeng Fund)