Article/Lu Ping, columnist of Sina Financial Opinion Leader
We found that after the previous sharp rise in PPI, the raw material cost index of household appliances will also rise significantly, and the factory price of household appliances will rise subsequently. During the period of PPI decline, the cost index of household appliances raw materials declined rapidly, while the factory price of household appliances was sticky, which promoted the profitability of household appliances enterprises to improve. In the later period of monetary easing, as the marginal role of monetary policy weakens, the possibility of the government's fiscal easing increases, which will promote the credit expansion of banks.
Summary:
PPI rose sharply in the early stage, and it is expected that there will be a significant return in 2022, that is, PPI will face a downward trend. In terms of industry investment options, during the period when PPI rose rapidly, high landscape industries concentrated in mining, nonferrous metals and other industries. In the range of PPI decline, what industry configuration should be selected? Based on the rise and fall of all sectors during the period of PPI decline since 2008, this paper calculates that household appliances and banking sectors are two sectors that have repeatedly outperformed the market when PPI declines. Then, the paper analyzes the logical relationship between the outstanding stock price performance of banks and household appliances and the decline of PPI in detail.
Home appliances: We have constructed three major raw material cost indexes of white appliances, namely, air conditioners, refrigerators and washing machines. We found that after the previous sharp rise in PPI, the raw material cost index of household appliances will also rise significantly, and the factory price of household appliances will rise subsequently. During the period of PPI decline, the cost index of household appliances raw materials declined rapidly, while the factory price of household appliances was sticky, which promoted the profitability of household appliances enterprises to improve.
Bank: The trend of PPI has a strong guiding significance for monetary policy. PPI is linked to industrial profits. During the downward period of PPI, industrial profits declined at the same time, and the economy was under pressure. At this time, the possibility of easing monetary policy is greater. We divide the changes of monetary policy into the early period and the late period of monetary easing. In the early period of broad money, the abundance of narrow inter-bank liquidity reduced the cost of bank funds and liabilities, and the steep interest rate caused by the different elasticity of short-term and long-term interest rates promoted the repair of bank interest rate differentials, which are conducive to the improvement of bank fundamentals. In the later period of monetary easing, as the marginal role of monetary policy weakens, the possibility of the government's fiscal easing increases, which will promote the credit expansion of banks.
1、 Plates that have repeatedly outperformed the market in the period of PPI decline
Since 2005, China's PPI has gone through three complete cycles. Every PPI cycle change has a significant impact on the prosperity of various industries, thus leading to market differentiation. According to the valley valley division method, we can divide the three cycles of PPI into: the first cycle is from November 2007 to May 2009; The second cycle is from May 2009 to November 2015; The third cycle is from November 2015 to May 2019. Each cycle includes two processes: PPI rise and PPI fall.
From the three complete cycles of PPI since 2015, select three periods of continuous decline of PPI, and count the rise and fall of each sector. We found that the only sectors that outperformed the market in the three PPI downturns (based on CSI 300) were banks and household appliances.


At present, PPI is at a historical high, in the middle of the fourth cycle since 2005. In terms of macro logic, PPI is mainly related to the supply and demand relationship of coal, nonferrous metals, steel and chemicals as well as the monetary situation. In terms of monetary situation, by observing the year-on-year growth data of M1 and PPI, we found that the fitting degree between M1 growth rate and PPI was high after eight months. This shows that due to the transmission of monetary policy, M1 can be used as the leading indicator of PPI. The year-on-year growth rate of M1 has peaked and started to fall around January 2021, and the probability of subsequent PPI peak and fall is relatively high. In terms of supply, with the implementation of "correcting 'sports carbon reduction'" and a series of supply guarantee policies, the supply gap of nonferrous metals, coal and other industrial products is expected to narrow. In terms of demand, affected by the decline of export orders and the slow recovery of domestic demand, the expansion speed of China's manufacturing industry has slowed down, and the subsequent demand for upstream raw materials may continue to weaken. In August, the PMI of the purchase price of main raw materials has continued to decline, and the PPI may be nearing the end. We judge that the upward momentum of PPI will weaken in the future, and the inflection point of PPI will come. In the future, the banking and household appliances sectors may benefit from the changes in macroeconomic conditions brought about by the decline in PPI, thus ushering in the layout opportunities of the sector.

2、 Household appliance industry analysis
1. Household appliance raw material cost index
There are many kinds of raw materials used in household appliances, and the price change of a single raw material cannot reflect the overall change of the cost of household appliances' raw materials. In order to analyze the impact of upstream raw material price changes on the profitability of the household appliance industry, we first constructed the cost index of household appliance raw materials to reflect the overall situation of household appliance raw material costs over time.
(1) Construction of raw material cost index for household appliances
Raw material cost index of a home appliance=base point × raw material cost of the home appliance at other time points under investigation/raw material cost of the home appliance at base period
With December 31, 2007 as the base period and 1000 points as the base point, the cost index of raw materials for household appliances is constructed:
Use t_0 to represent the base period December 31, 2007, and use t_1 to represent other time points under investigation;
Use N_i to represent the usage of raw material i of a home appliance, use P_ (t, i) to represent the average price of the raw material at time t, and use C_t to represent the raw material cost of the home appliance at time t;
Then the raw material cost of this kind of household appliances in the base period t_0 can be expressed as:
C_(t_0 )=∑▒〖〖(N〗_i×〗 P_(t_0,i)) (1)
The raw material cost of this kind of home appliance product in time t_1 can be expressed as:
C_(t_1 )=∑▒〖〖(N〗_i×〗 P_(t_1,i)) (2)
Use k_i to represent the average proportion of the cost of raw material i in the cost of raw materials of this kind of household appliances, that is, k_i=(N_i × P_ (t, i))/C_t, take t=t0 and put N_i on the left side of the equal sign. The above formula can be transformed into:
N_i=(k_i 〖×C〗_(t_0 ))/P_(t_0,i) (3)
If formula (3) is brought into formula (2), we can get:
C_(t_1 )=∑▒〖((k_i 〖×C〗_(t_0 ))/P_(t_0,i) ×〗 P_(t_1,i))=C_(t_0 )×∑▒(k_i×P_(t_1,i))/P_(t_0,i)
Divide the left and right sides of the equal sign by C_ (t_0)
C_(t_1 )/C_(t_0 ) =∑▒(k_i×P_(t_1,i))/P_(t_0,i)
Therefore, the raw material cost index of this kind of household appliances=1000 × C_ (t_1)/C_ (t_0)=1000 × ∑ ▒ (k_i × P_ (t_1, i))/P_ (t_0, i).
(2) Calculation of raw material cost index of air conditioner, refrigerator and washing machine
Next, take air conditioners, refrigerators and washing machines as examples, which are representative products of the household appliances industry, to list their raw material cost index expressions and calculate them by substituting them into the data.
According to the data sorted out by the Industrial Information Network, the raw materials of air conditioners, refrigerators and washing machines are mainly steel, copper, plastic, aluminum, galvanized sheet and cold-rolled sheet, and the specific cost of each raw material is as shown in Figures 1, 2 and 3.
According to the composition of raw material cost of air conditioners, refrigerators and washing machines sorted out by the Industrial Information Network, and combined with the expression of raw material cost index of household appliances, the following expression of raw material cost index of air conditioners, refrigerators and washing machines can be listed:
Air conditioning raw material cost index=1000 × (22.2% × P_ (steel, t_0)/P_ (steel, t_1)+40.7% × P_ (copper, t_0)/P_ (copper, t_1)+18.5% × P_ (plastic, t_0)/P_ (plastic, t_1)+7.4% × P_ (aluminum, t_0)/P_ (aluminum, t_1)+7.4% × P_ (galvanized sheet, t_0)/P_ (galvanized sheet, t_1)+3.7% × P_ (cold-rolled sheet, t_0)/P_ (cold-rolled sheet, t_1)
Refrigerator raw material cost index=1000 × (16.7% × P_ (steel, t_0)/P_ (steel, t_1)+22.2% × P_ (copper, t_0)/P_ (copper, t_1)+51.9% × P_ (plastic, t_0)/P_ (plastic, t_1)+1.9% × P_ (galvanized sheet, t_0)/P_ (galvanized sheet, t_1)+7.4% × P_ (cold-rolled sheet, t_0)/P_ (cold-rolled sheet, t_1)
Air conditioning raw material cost index=1000 × (49.2% × P_ (steel, t_0)/P_ (steel, t_1)+10.2% × P_ (copper, t_0)/P_ (copper, t_1)+30.5% × P_ (plastic, t_0)/P_ (plastic, t_1)+1.7% × P_ (galvanized sheet, t_0)/P_ (galvanized sheet, t_1)+8.5% × P_ (cold-rolled sheet, t_0)/P_ (cold-rolled sheet, t_1)
The raw material cost index of air conditioners, refrigerators and washing machines in each period can be calculated by taking the price of each raw material into the above formula.
2. Profitability analysis of household appliances industry
Taking air conditioners, refrigerators and washing machines as the representative products of the household appliances industry, this paper analyzes the profitability of the household appliances industry from the perspective of cost and ex factory price.
(1) Profit analysis of air conditioning
According to the data sorted out by the Industrial Information Network, about 54% of the cost of air conditioning is the cost of raw materials. Therefore, the cost index of air conditioning raw materials × 54% is used to reflect the change of the total cost of air conditioning caused by the price change of raw materials.
As shown in Figure 5, compared with the change of air conditioning cost, the change of air conditioning ex factory price is very small, and the year-on-year change rate has always been between ± 5%. It can be seen that the profitability of air conditioners is mainly affected by cost changes. Moreover, there is a strong positive correlation between the year-on-year change rate of air conditioning cost and the year-on-year change rate of PPI, which basically rise and fall at the same time. Therefore, when PPI increases year on year, the price of upstream raw materials of air conditioners will rise, which will lead to an increase in the cost of air conditioners and squeeze the profit space of air conditioners. When PPI drops year on year, the price of upstream raw materials of air conditioners will fall, which will lead to the cost of air conditioners falling and improve the profitability of air conditioners.
(2) Refrigerator profitability analysis
According to the data sorted out by the Industrial Information Network, about 54% of the refrigerator cost is the cost of raw materials. Therefore, the refrigerator raw material cost index × 54% is used to reflect the change in the total cost of the refrigerator caused by the change in the price of raw materials.
Compared with the change of refrigerator cost, the change of refrigerator factory price is very small. Except for 6.7% in May 2021 and 8.8% in June 2021, the year-on-year change rate has always been between ± 5%. It can be seen that the profitability of refrigerators is mainly affected by cost changes. In addition, there is a strong positive correlation between the year-on-year change rate of refrigerator cost and the year-on-year change rate of PPI, which basically rise and fall at the same time. Therefore, when the PPI increases year on year, the price of the upstream raw materials of the refrigerator will rise, which will lead to the rise of the cost of the refrigerator and squeeze the profit space of the refrigerator. When PPI decreases year on year, the price of upstream raw materials of refrigerators will decrease, which will lead to the cost of refrigerators and improve the profitability of air conditioners.
(3) Profit analysis of washing machine
According to the data sorted out by the Industrial Information Network, about 59% of the cost of washing machines is the cost of raw materials. Therefore, the cost index of raw materials for washing machines × 59% is used to reflect the change in the total cost of washing machines caused by the change in the price of raw materials.
Although compared with air conditioners and refrigerators, the ex factory price of washing machines has a relatively large range of change, but its fluctuation range is only between - 5% and 10%, far less than the fluctuation range of washing machine costs between - 15% and 30%. It can be seen that the profitability of washing machines is still mainly affected by cost changes. In addition, there is a strong positive correlation between the year-on-year change rate of washing machine cost and the year-on-year change rate of PPI, which basically rise and fall at the same time. Therefore, when PPI increases year on year, the price of upstream raw materials of washing machines will rise, which will lead to the rising cost of washing machines and squeeze the profit space of washing machines. When PPI drops year on year, the price of upstream raw materials of washing machines will fall, which will lead to the cost of washing machines falling and improve the profitability of washing machines.

According to the above analysis of the representative products of the household appliances industry, such as air conditioners, refrigerators and washing machines, we can draw the following conclusion: the core factor affecting the profits of the household appliances industry is the cost side. When PPI rose year on year, the cost of the household appliance industry rose, and the profit space was squeezed, which was bad for the household appliance industry; When PPI declined year on year, the cost of the household appliance industry declined, and the profit improved, which was good for the household appliance industry. The year-on-year change rate of PPI in the last four months was at a historical high of 9.0% in May, 8.8% in June, 9.0% in July, and 9.5% in August, respectively. It is expected that the turning point of PPI will soon come, and PPI will enter the fourth downward range since 2008. According to the logic above, the year-on-year decline of PPI will benefit the home appliance industry. Therefore, we are optimistic about the home appliance industry. It is expected that the home appliance industry will perform better than the market in this downward interval, as the previous three rounds of PPI have done.
3、 Banking industry analysis
1. Several logics of bank growth in the downward period of PPI
PPI is linked to industrial profits, which has a strong guiding significance for monetary policy. The trend of PPI is consistent with that of industrial profits, reflecting the supply and demand relationship and profitability of the real economy. When the inflation pressure is relatively low, monetary policy is based on the target anchor of "stable growth", and often makes loose responses such as reducing reserve ratio and interest rate in advance in response to the downward trend of PPI. Historical data shows that M1 and PPI show a significant correlation. M1 is about 8 months ahead of PPI on a year-on-year basis. Since the beginning of this year, M1 has continued to decline from 14.7% in January to 4.9% in July, which to some extent indicates the downward trend of PPI. At present, PPI fluctuates at a high level, but the profits of industrial enterprises continue to decline year-on-year. The demand for downstream real estate and infrastructure is sluggish. The trend of economic pressure in the second half of the year is increasingly clear, and monetary policy is expected to be further relaxed.


1) Early stage of easy money
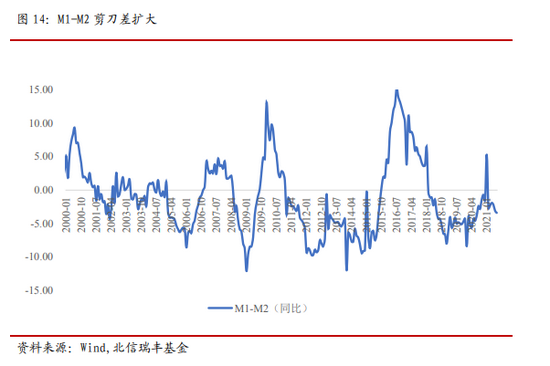
The demand for funds in the real economy is insufficient, and the narrow sense of inter-bank liquidity is abundant. At present, we are in a period of "loose money and tight credit". Due to the pro cyclical characteristics of credit expansion, the growth rate of social finance and credit is slowing down, and the transmission from loose money to loose credit is blocked, which is good for banks from the perspective of capital volume. When PPI fell from a high level, the stock market was in shock, and residents, out of risk aversion, tended to withdraw capital from the stock market and deposit in banks or purchase highly liquid monetary funds, which led to a continuous decline in the M1-M2 growth scissors. The real purchasing power and corporate capital demand were tight, the liquidity distribution was tilted from entities to banks, and the narrow sense liquidity between banks was relatively abundant. Since the RRR cut on July 15, the effect of monetary easing has not been significant, and the capital interest rate has not declined significantly R007 R007 fluctuated. During the R007 period, it once rose to a high of 2.6%. The market's expectation of the second RRR reduction gradually increased. The central bank carried out a medium-term lending facility of 600 billion yuan on August 16, which exceeded the expectation. Further easing of capital will help improve the bank's over reserve ratio and reduce the bank's cost of funds in debt.
Cost reduction and wider interest margin further improved the bank fundamentals. We find that the cost income ratio of banks fits well with PPI. As an important indicator to measure the profitability of banks, the cost income ratio is calculated as (business expenses+administrative expenses+other operating expenses)/(net interest income+net non interest income) × 100%. During the period of year-on-year decline of PPI, the cost income ratio of banks tends to decline year on year, which may be due to the rapid response of short-term interest rates at the beginning of broad currency, while the long-term interest rates are relatively lagging behind, and the steep yield curve has a marginal repair effect on the bank interest margin, thus reducing the sub item "business expenses" of the cost income ratio, increasing the denominator "net interest income", and improving bank profits. Due to the relatively strong expectation of fund easing in the near future, the yield of 10-year treasury bonds has been constantly dropping and gradually approaching the bottom, and the term interest margin has also narrowed. However, as investors' risk appetite begins to rise, the future yield of long-term bonds may change to improve the term interest margin of banks, thereby improving the fundamental aspects of banks.

2) Late period of leniency
With the weakness of the later period of the loose monetary policy, the strengthening of the loose fiscal policy will help the bank's credit growth. With the promotion of more intense monetary policies such as interest rate cuts, liquidity gradually flows into enterprises, and the term interest margin flattens. However, the policy cooperation of financial infrastructure will help stimulate credit expansion and provide new growth points for banks. In the first half of the year, the issuance of government bonds was slow, especially special bonds. At present, the progress of special bonds issuance is still slow. As of the end of August, the progress has not been more than half, and only 48.7% of the financial expenditure continues to slow, which has affected the over reserve ratio. As of the end of August, the progress of special bonds issuance is only 50%, and the market expects that the quota of special bonds can be fully issued within the year, Therefore, the issuance rate of subsequent special bonds will be accelerated.
2. Several rounds of "bank bull" in the period of high and falling PPI
From November 2008 to August 2009: the highest cumulative increase in the banking sector was about 149%, and the cumulative increase in the CSI 300 was 126%, with a relative return of 23%. After the central bank sharply cut interest rates, the yield of national debt has plummeted, but the term interest margin of 10-1 national debt has widened rapidly, ensuring the profitability of banks. At the same time, the "four trillion" fiscal stimulus policy has formed a strong expectation that the economic growth will hit the bottom and pick up, promoting the linear recovery of credit growth.

From September 2014 to June 2015: the highest cumulative increase in the banking sector was about 98%, and the cumulative increase in the CSI 300 was 131%, underperforming the market, with a relative return of - 33%. The relatively poor growth of the banking sector was mainly due to the poor performance of banks in terms of fundamentals. The promotion of interest rate marketization reform led to the accelerated narrowing of the net interest margin. In the third quarter of 2015, the ROE of banks fell by 11% year on year. Although the fundamental performance is relatively weak, as the economy continues to decline, the PPI turns negative in depth. The Central Bank began to cut interest rates in November 2014, and then cut interest rates and reserve requirements for many times. In June and August 2015, the liquidity was significantly relaxed, and the valuation of the banking sector was at an historically low level. Therefore, driven by the sentiment of inflation, the P/E ratio soared, outperforming the market.


2017.5-2018.2: the highest cumulative increase in the banking sector was about 36%, the cumulative increase in the CSI 300 was 30%, and the relative income was 6%. Although the increase was not large under the effect of high base, it occurred against the background of economic downturn and monetary tightening, mainly due to the improvement of bank fundamentals. After the supply side reform, the economic systemic risk declined, the growth rate of non-performing loan balance of commercial banks declined rapidly, the quality of bank assets improved, the performance began to recover, and the net interest margin began to stop falling and recover. Under the condition of tight currency, the oversupply rate still rose significantly.
(About the author: Chief Economist of Beixin Ruifeng Fund)