Opinion leaders | Jiang Fei, Qin Yongyu
►►► Core viewpoints
As CPI, PPI and GDP deflators fall below zero one after another by the end of 2023, market investors have some concerns about the downturn in China's price level. This paper mainly analyzes the future price trend of China, hoping to judge the long-term price situation in this way.
For the future price trend of China, we first confirm that there is a cointegration relationship of money demand, and then estimate the dynamics of price fluctuations according to the VAR model. The model calculation results show that the central level of the price index will continue to decline after 2024. This indicates that other conditions remain unchanged. The model predicts that the growth rate of China's price level will remain positive until 2030 only under the interaction of output level, money supply, interest rate and price. This research conclusion does not support China's entry into long-term deflation.
Price risk to be vigilant: here we want to learn from the history of Japanese prices. We also set up a VAR model to predict relevant economic indicators in Japan, and found that the explanation of the model is not necessarily accurate. Miyao Longzang also pointed out in the relevant literature that when ECM (error correction model) and VAR model just entered the stage of long-term deflation, the results were opposite; Only after Japan has fully entered the stage of long-term deflation will they predict the same. The velocity of money circulation has changed the original error correction model, resulting in a miscarriage of justice. Therefore, changes in the velocity of money circulation will also affect the prediction of VAR. China's M1 currency circulation rate from 2008 to 2023 is roughly similar to that of Japan from 1978 to 1993. According to our predicted economic growth and interest rate trend, we can infer that the M1 currency circulation rate will decline faster than that predicted by the VAR model in the future. If we follow the trend of potential economic growth and natural interest rate predicted in "Reconsidering China's Potential Economic Growth" and "China's Natural Interest Rate and Taylor's Formula", we can deduce that the future M1 monetary circulation speed will decline faster than the level predicted by the VAR model, and the calculation results are lower than the VAR model results.
Some people think that China's savings rate is high, and relying on continuous investment can maintain a stable GDP growth rate and avoid liquidity traps like Japan. Thanks to the adverse expansion of the public sector, investment can still drive economic growth, which is different from Japan. However, if such investment is inefficient - it may not be able to prevent the rise of macro leverage, and M2's monetary velocity will continue to decline, which may lead to a rapid decline in interest rates and trigger zero interest rates, thus causing M1's monetary velocity to decline rapidly, and the economy will enter a liquidity trap This has happened in Japan before.
To sum up, we believe that the top priority is to stabilize residents' willingness to save, increase the proportion of direct financing, and improve the speed of money circulation 。 Stopping the rapid rise of macro leverage ratio may, to some extent, prevent China from entering long-term low inflation. In order to ensure that the deposit interest rate does not fall to zero and prevent the emergence of liquidity traps, we believe that we should continue to actively stimulate finance or deepen institutional reform.
along with two thousand and twenty-three end of the year CPI 、 PPI and gross domestic product The deflator has successively dropped below zero, and market investors have some concerns about the downturn in China's price level. This paper mainly analyzes the future price trend of China, hoping to judge the long-term price situation in this way.
one
Price situation in China
since two thousand and twenty After the outbreak of the epidemic in, some changes have taken place in the world economy. From China and the United States CPI The trend differentiation can be seen that the core of the United States in the past decade CPI Ring comparison center from two thousand and twenty-one Since the second quarter of 0.16% Lift to 0.4% Above, the core of China CPI Ring comparison center from two thousand and twenty From the original 0.14% Descend to 0.06% On.
China and Japan have been close neighbors for generations, and their economic development both belong to the catch-up model, and both have experienced the population cycle, the real estate cycle and the debt cycle. one thousand nine hundred and ninety-one After the bursting of Japan's land bubble in, there appeared the "lost twenty years", and prices entered long-term deflation. China's real estate is facing adjustment. Will prices be similar to Japan's history? chart two Displayed in two thousand and ten Year as the base period, Japan 1970-1992 House price and rent index in and China 2001-2023 The comparison chart of annual house price and rent index trends shows that there are some similarities between the two trends. China's rent index 60% Shrinkage ratio of For example, this is to compare the change trend [1] 。
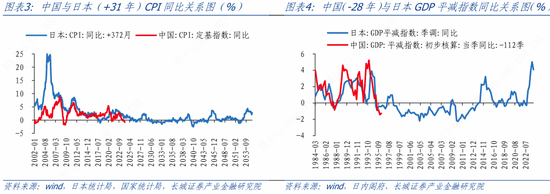
Through comparison, we find that in addition to housing price and rent, China's CPI Index and Japan thirty Years ago CPI There are some similarities in the trend of the index, gross domestic product The deflator is about the same as that of Japan twenty-eight Years ago gross domestic product The trend of deflators is partly similar. On the whole, China's price trend is about the same as that of Japan 28-32 There are some similarities in annual trends.
It is worth noting that China's economic indicators will not necessarily continue the trend of Japan's historical economic indicators in the future, considering the gap between the economies of China and Japan. The trend of Japan's economic indicators is only for reference.
two
China's Price Forecasting Model
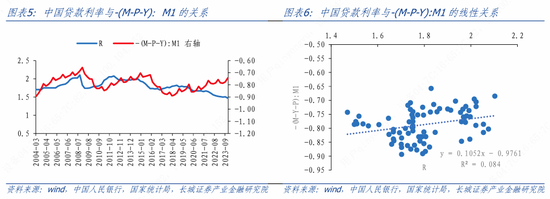
For the future price trend in China, our research model mainly uses the indicators of output, price, currency and interest rate, of which the output level is the actual level after the quarterly adjustment gross domestic product The price level is gross domestic product Deflator, currency and interest rate M1 And two-stage interest rate [1] 。 The data time span is 2004Q1-2023Q4 , in which, to eliminate the fact that gross domestic product Data jump caused by base adjustment two thousand and five Annual actual gross domestic product Is the base period according to gross domestic product Actual calculated quarterly on a year-on-year basis gross domestic product Seasonal adjustment and leveling shall be carried out. Take the logarithm of each variable and express it as Y 、 P 、 M 、 R 。 From Figure five and six As can be seen, 2004-2023 Year M-P-Y There is an obvious negative correlation with interest rate, and there may be some long-term relationship.
We use the time series analysis tool VAR Model. First, verify whether the cointegration relationship of money demand is established, and verify the following two models.

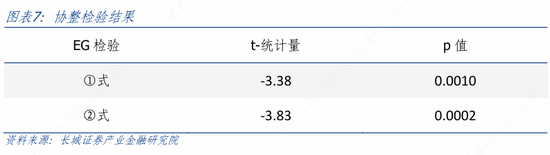
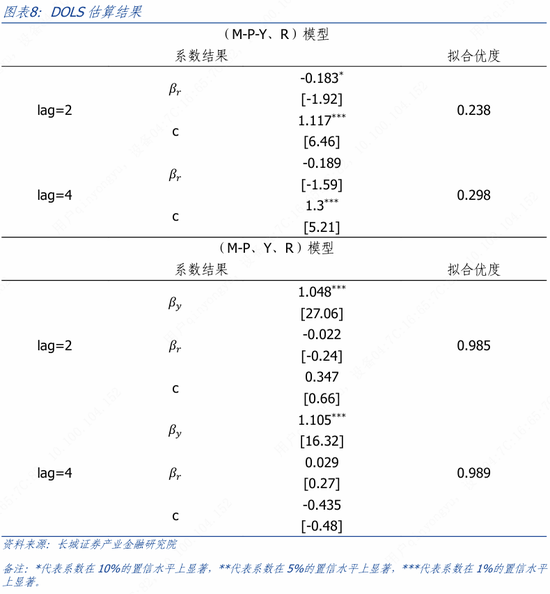
Among them, 𝛽𝑟 and 𝛽𝑦 are interest rate elasticity and income elasticity, and e is the residual of money demand. We preliminarily conduct ADF unit root test for each variable included in the model. For horizontal variables, M-P and R cannot reject the original hypothesis at the 5% confidence level, and M-P-Y passes the test at the 1% confidence level. After one difference, each variable can reject the original hypothesis at the 10% confidence level. The result shows that each variable is a single integer with one unit root. After confirming single integration at the same level, we passed the Engle Granger test ① and ② cointegration test. Chart 7 reports the results of the cointegration test. The EG test results support the cointegration relationship between the two systems (M-P-Y, R) and (M-P, Y, R) at the significance level of 1%, indicating that there is a long-term stable relationship between variables, and also indicating that the cointegration relationship of money demand is supported. After the cointegration relationship is established, the cointegration vector is estimated, that is, the β coefficient in formulas ① and ② is estimated. The estimation method used is the Dynamic OLS (DOLS) method. The estimation results are shown in Figure 8. From the perspective of goodness of fit, the (M-P, Y, R) model is better than the (M-P-Y, R) model, while from the perspective of coefficient sign, the (M-P, Y, R) lag two period model is more robust and more consistent with the actual situation. Considering comprehensively, we believe that M, P, Y and R have the following relationships :

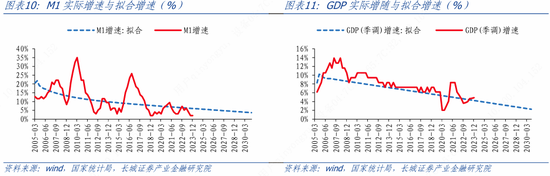
After confirming the existence of cointegration relationship of money demand, we VAR The model estimates the dynamics of price fluctuations. The figures in brackets in the following formula represent the number of periods that the variable lags behind. VAR The model can capture the dynamic relationship in the time series data and predict the short-term changes of each variable in the future.

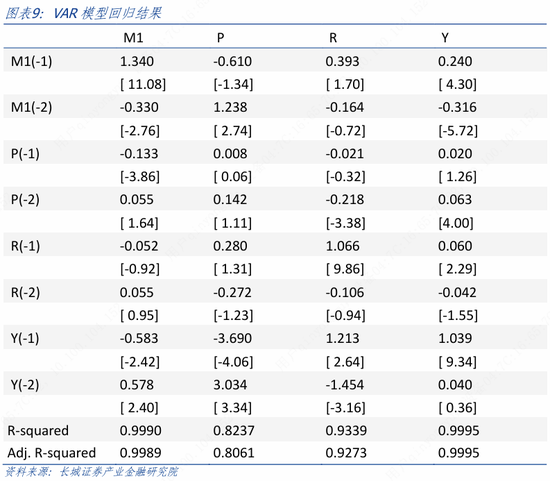
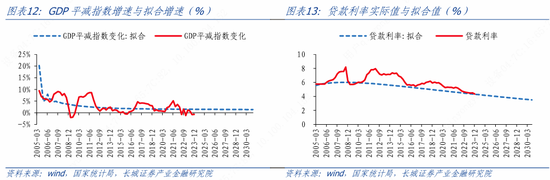
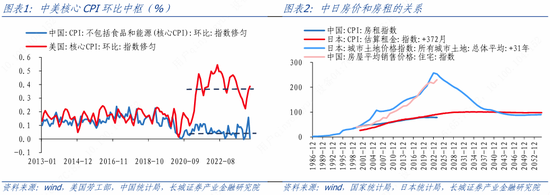
according to VAR Model from two thousand and seven Year backward fitting and prediction, 2007-2023 The actual value of monetary volume, interest rate, price and output level in the year is basically consistent with the trend of the predicted value, and the representative model can roughly indicate the long-term trend of the four variables. In terms of price index, 2007-2023 The annual price index is close to the central level of the actual price index in the same period, and two thousand and twenty-four There was a downward trend after. This shows that other conditions remain unchanged. The model predicts that only under the interaction of output level, money supply, interest rate and price two thousand and thirty The growth rate of China's price level was still positive years ago. This research conclusion does not support that China's inflation will enter long-term deflation.
It is worth noting that the above analysis is used VAR The model can predict the future trend of each variable, but the prediction results of the model are affected by the sample time period, and the model relies on many assumptions, which cannot include all economic phenomena that may have a significant impact on the prediction indicators. Therefore, we need to treat the prediction results objectively. If the relevant economic data in the sample period is in a downward phase as a whole, it may lead to a downward trend in the predicted future economic indicators. However, this trend is not absolute. It may be affected by emergencies, economic indicators outside the model, and the correlation between variables may change over time.
three
The Reference Significance of the Historical Trend of Japanese Price
Price risk to be vigilant : Here we want to learn from the historical trend of Japanese prices. because two thousand and twenty-three The price situation in China in was similar to one thousand nine hundred and ninety-three In Japan, we used one thousand nine hundred and eighty Year to one thousand nine hundred and ninety-eight The same economic indicators of Japan in VAR Model. Among the money supply indicators, China's M1 Slightly different from Japan, China M1 The year-on-year indicators are mainly enterprise demand deposits, while Japan M1 The indicator is the demand deposits of the private sector, which includes not only the demand deposits of enterprises but also the demand deposits of residents. Since the growth rate of resident demand deposits in China is similar to that of enterprise demand deposits M1 Year on year comparison with Japan M1 The same period can be compared.
Foam / The paper "Price Trends and the Role of Money in the Deflation Period" in Japan's Economy and Economic Policy in the Deflation Period [3] Also used M1 Cointegration analysis with other economic indicators. We use Japan M1 Both ① and ② can pass EG The cointegration test shows that there is a robust cointegration relationship between prices and variables. Based on the cointegration relationship, we establish VAR Model and predict the future. To verify VAR The accuracy of the model prediction, in the one thousand nine hundred and ninety-three Select two more time points after the year: one thousand nine hundred and ninety-six Year and one thousand nine hundred and ninety-eight year [4] , for the original VAR The forecast results of the model are compared with the actual results to analyze the fundamental reasons for the price trend in Japan.
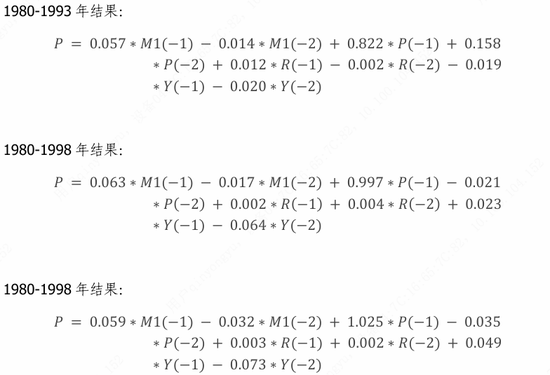
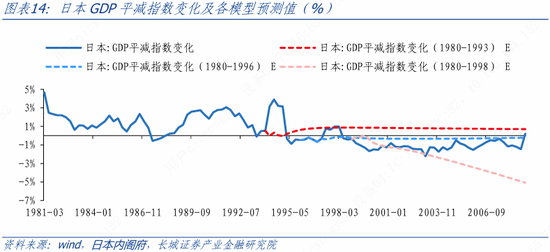
The model results show that according to 1980-1993 Annual data construction VAR The model also predicts that Japanese prices will gradually rise and eventually stabilize at 0.1% Up, actually gross domestic product The growth rate is also higher than the actual value on average. There is a big gap between this result and the actual situation, and then observe the second one( 1980-1996 )And the third( 1980-1998 )As a result, we can find that Japan gross domestic product The deflator index will move in the direction of deflation and become closer to the actual situation.
Why is this? It is found in the article "Price Trends and the Role of Money in Deflation Period" ECM (Error correction model) and VAR When the model just enters the stage of long-term deflation, the results are opposite; Only after Japan has fully entered the stage of long-term deflation will they predict the same. The author Gong Wei Longzang believes that the velocity of money circulation has changed the original error correction model, resulting in a miscarriage of justice. We find that the change in the velocity of money circulation will also affect VAR Forecast of.
Monetary quantity formula MV=PY The basic condition for its establishment is that the velocity of money circulation remains unchanged. In this case, the model is relatively stable and the prediction is relatively accurate. However, after the change of money circulation speed, the entire money demand function has also changed, which is equivalent to the formula( two )In and They are all changing. As shown in the figure fifteen , Japan M1 The flow speed of one thousand nine hundred and ninety-five It began to decline after, VAR The model is no longer able to cope with changes in long-term relationships. This is similar to what we do in two thousand and twenty-three year twelve According to the discussion in the "Transformation of China's Monetary Control Mechanism" published in August, changes in capital structure and macro leverage ratio have changed the interest rate sensitivity coefficient.
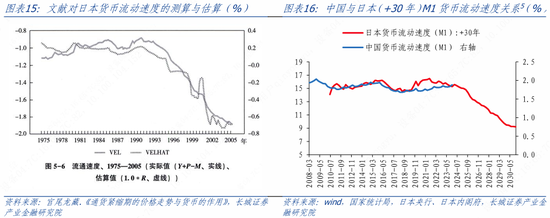
Japan M1 The sharp decline in the velocity of money circulation is due to one thousand nine hundred and ninety-five year gross domestic product After the deflator entered deflation, the policy interest rate fell to 0.5% , deposit interest rate also dropped 0.5% Nearby, the deflation expectations of residents and enterprises rose, interest rate sensitivity dropped significantly, the demand for money expanded indefinitely, and liquidity traps emerged.
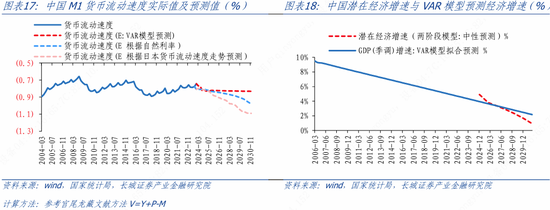
China 2008-2023 Of M1 Velocity of money circulation [5] Probably 1978-1993 Japan during M1 There are some similarities in the trend of money flow speed, VAR The future predicted by the model gross domestic product The growth rate is similar to the trend of the potential economic growth rate as estimated in the previous period; The loan interest rate is also slightly higher than the trend of the natural interest rate we calculated earlier. However, if we follow the guidelines in "Reconsidering China's Potential Economic Growth" and "China's Natural Interest Rate and Taylor Formula" [6] The potential economic growth and natural interest rate trend predicted in, Can infer the future M1 The velocity of money circulation will decrease faster than VAR The predicted level of the model and the calculated results are relatively high VAR The model results are low.
However, we need to note that potential economic growth and natural interest rate are equilibrium values, and the calculation process also relies on many model assumptions. According to the past data, there are certain deviations between potential economic growth and actual economic growth, and between natural interest rate and actual interest rate. In addition, the short-term data is downward, leading to a downward trend in the values obtained by the model. The model does not take into account the objective factors such as the upgrading of the industrial structure and the fluctuation of the economic cycle of China's economy in the future. Therefore, the money flow rate calculated according to the potential economic growth rate and natural interest rate is only of certain reference significance.
four
Comparison of money circulation speed between M2 and M1
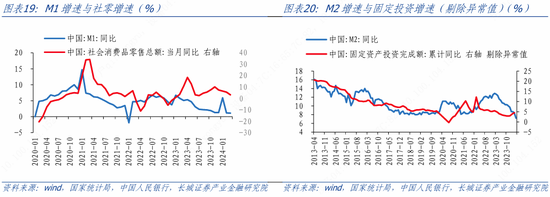
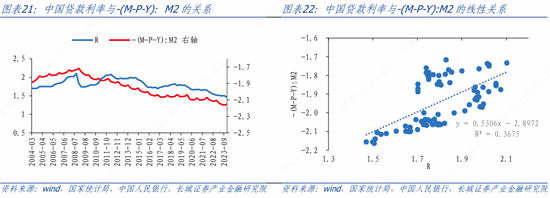
Some people think that China's savings rate is high and can be maintained by continuous investment gross domestic product The growth rate is stable to avoid liquidity traps like Japan. The following focuses on the differences between the two, M1 and M2 The main differences in the velocity of money circulation are M1 Closer relationship with consumption (chart nineteen ), and M2 Closer relationship with fixed investment (chart twenty )。 Relatively speaking, China M2 The fitting effect of co integration model is better. This is due to the adverse expansion of the public sector. Investment can still drive economic growth, which is different from Japan.
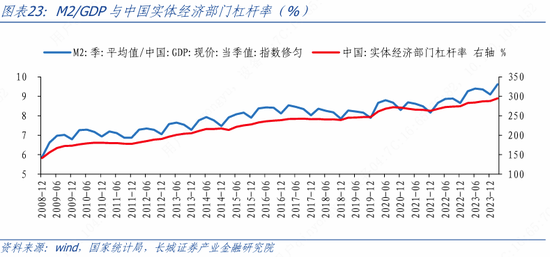
However, if such investment is inefficient - it may not be able to prevent the rise of the macro leverage ratio, and M2's monetary velocity will continue to decline, which may lead to a rapid decline in interest rates and trigger zero interest rates, thus causing M1's monetary velocity to decline rapidly and the economy to enter a liquidity trap, as Japan has seen before. In the first quarter of 2024, the leverage ratio of the real economy continued to rise 6.8 percentage points to 294.8%. This is consistent with the M2/nominal GDP trend, reflecting that the current M2 money supply growth is still faster than the nominal GDP growth, and the macro leverage ratio is still rising.
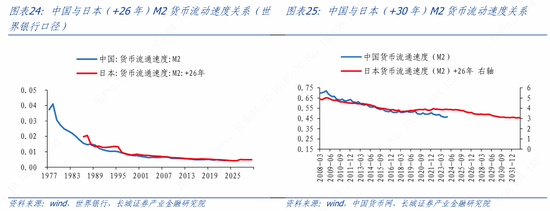
We are two thousand and twenty-three year two Published in《 M2/GDP New situation of : Or will continue to rise 》Compared with M2 Velocity of money circulation (nominal GDP/M2 ), and twenty-six Japan years ago can be compared in part. But here in Japan M2 With China M2 The indicators cannot be directly compared. The World Bank's Japanese indicators are( M2+CD Etc.). Given the limited availability of data, we found that Japan M2 The year-on-year growth rate of money supply is more consistent with that of broad caliber money supply, so it is believed that Japan M2 Growth rate and China M2 The growth rate can also be compared (as shown in the chart twenty-four )。
because M2 The velocity of money circulation and macro leverage ratio( M2/ name gross domestic product )The two indicators can be regarded as two sides of a coin. This can be summarized as "the velocity of money circulation - Macro leverage - The "natural interest rate" has the same logical connotation, and it can also be understood that it is the decline in the velocity of money circulation (the rise in the macro leverage ratio) that causes the potential economic growth to deviate from the original track.
《 M2/GDP New situation of : Maybe it will continue to rise, M2 The speed of money circulation is affected by many factors, such as the savings rate and financing structure. The rise of the national savings rate and the proportion of bank credit may bring about a decline in the speed of money circulation. At present, China's investment and financing system is still dominated by indirect financing. Increasing the proportion of fixed asset investment may increase the proportion of bank credit, which may increase the macro leverage ratio and reduce the speed of currency circulation. M2 The decline of circulation speed may lead to the decline of interest rate, and when the deposit interest rate drops to a certain level, it will trigger the liquidity trap, causing M1 The rapid decline of circulation speed may cause low inflation.
To sum up, for the current economy, it is not conducive to short-term investment gross domestic product Stability of; However, if the "flood" of investment, the velocity of money circulation may decline faster, which may lead to a gradual increase in the risk of low inflation in the future. Therefore, we believe that the top priority is to stabilize residents' willingness to save, increase the proportion of direct financing, and improve the speed of money circulation. stop The rapid rise of macro leverage may, to some extent, prevent China from entering long-term low inflation. In order to ensure that the deposit interest rate does not fall to zero and prevent the emergence of liquidity traps, we believe that we should continue to actively stimulate finance or deepen institutional reform.
[1] In 2023, China's housing prices have continued to decline, but the sales data of commercial housing published by the Bureau of Statistics has changed in caliber, and the housing prices obtained from sales volume/sales area are rising instead.
[2] In the two-stage interest rate, the 1-3 year medium and long-term loan interest rate is used before the second quarter of 2008, and the weighted average interest rate of general loans is used after the second quarter of 2008.
[3] Japan's Economy and Economic Policy in the Bubble/Deflation Period was published in 2023, and Price Trends and the Role of Money in the Deflation Period was included in this book.
[4] In the sample period, inflation was close to zero twice in 1996 and 1998, and Japanese residents had different expectations for future inflation. In 1996, Japanese residents' expectations of deflation were stronger than in 1993, but after 1998, Japanese residents' expectations of future deflation were strengthened again.
[5] The velocity of China's currency circulation in this paper has been smoothed
[6] Reconsidering China's Potential Economic Growth was released in October 2023, and China's Natural Interest Rate and Taylor Formula was released in April 2024.
(About the author of this article: Macroeconomist of Great Wall Securities)