Article/Tang Jianwei, columnist of Sina Financial Opinion Leader (WeChat official account kopleader)
Although the US economy is still stable at present, and the short-term economic growth may slow down, there is no major factor that will prompt the US economy to fall into recession again soon. However, this does not mean that the US economy can rest easy. There are still two aspects of risk points worthy of attention in the long-term economic operation of the US.

Since Trump took office in 2017, his large-scale tax reduction policy has not only continued the momentum of economic recovery in the United States, but also made the economic data of the United States more eye-catching in recent quarters. As of the third quarter of this year, the U.S. economy has maintained a sustained growth of 111 months. The duration of this round of economic expansion has become the second highest since records began, and is likely to break the historical record of 120 month economic expansion cycle created by the Clinton era. In addition to the excellent performance of macro data attracting global attention, such a rare long-term economic expansion will naturally start to trigger market speculation. Because this economic cycle depends more on government policy stimulus. As the saying goes, prosperity is bound to decline. With the passage of time, whether this round of economic expansion is about to usher in a turning point has attracted market attention. Moreover, every time the long-term economic expansion of the United States ends in history, it will lead to a global economic or financial crisis, big or small. Will this be an exception?
1、 The US economy is performing well at this stage, and the recovery will continue
Since 2018, under the stimulus of Trump's tax reduction policy, the U.S. economy has performed strongly, with its economic growth hitting a new high in recent years. At the same time, the unemployment rate has repeatedly hit new lows, and the core inflation rate has also reached the target range. The real estate market and residents' debt levels are also very healthy, and some leading economic indicators also show that the expansion cycle of the U.S. economy will continue for some time.
First, the economic growth data performed well. In the second quarter of this year, the real GDP of the United States grew at an annualized rate of 4.2% month on month. Although the third quarter saw a slight decline, the growth rate also reached 3.5%. From the driving force, the contributions of personal consumption, private investment and government spending to GDP were all rising, and only net exports contributed negatively to growth.
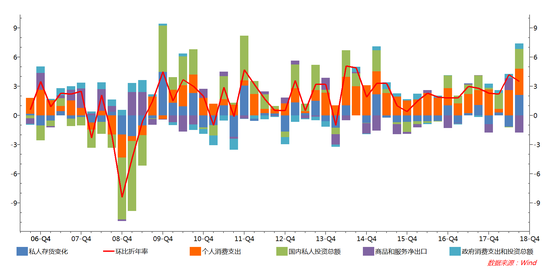 Figure 1: Real GDP Annualized Rate and Pull Rate of the United States (%)
 Second, the unemployment rate was at a historical low while the number of new jobs remained high. From the perspective of unemployment rate, the unemployment rate of the United States in October has dropped to 3.7%, lower than the natural unemployment rate of 4%. The current unemployment rate is also near the lowest level after the war. However, the number of Americans applying for unemployment benefits for the first time has continued to decline, which is close to the historical low level. At the same time, the number of new non-agricultural employment has remained at a high level, which indicates that the U.S. labor market is still strong.
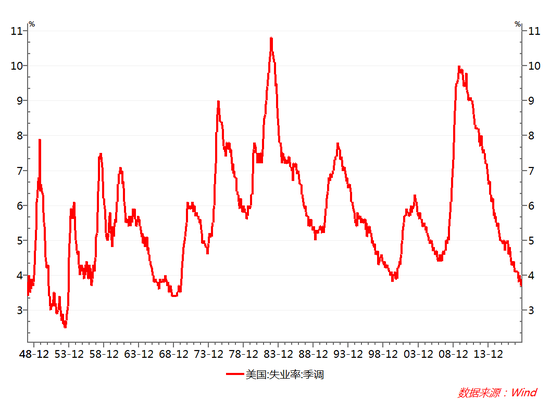 Figure 2: US Unemployment Rate (%)
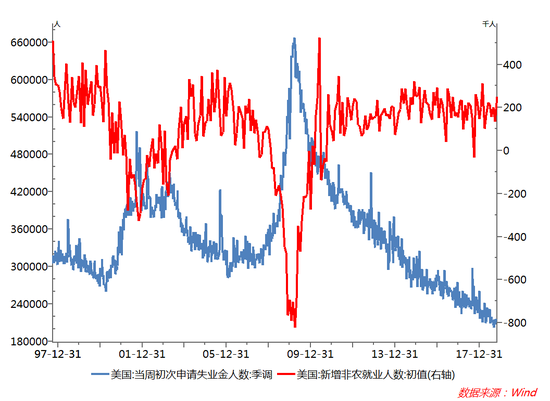 Figure 3: Comparison between the number of unemployed and the number of new jobs in the United States
 Third, the overall inflation level was stable. From the perspective of inflation level, the US CPI fell to 2.3% year-on-year in September, and the core CPI also fell to 2.2%. PPI fell to 4.3% year-on-year from a high of more than 5% in the first half of the year. In addition, the core PCE (personal consumption expenditure deflator) of the United States was 1.97% in September, lower than the Federal Reserve's target of 2% for two consecutive months. It shows that the current inflation pressure in the United States is not obvious.
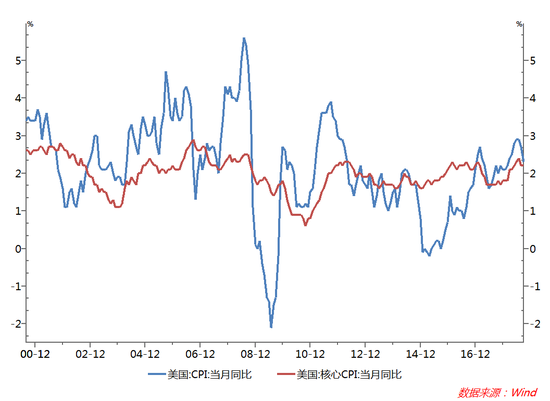 Figure 4: US CPI and core CPI year-on-year (%)
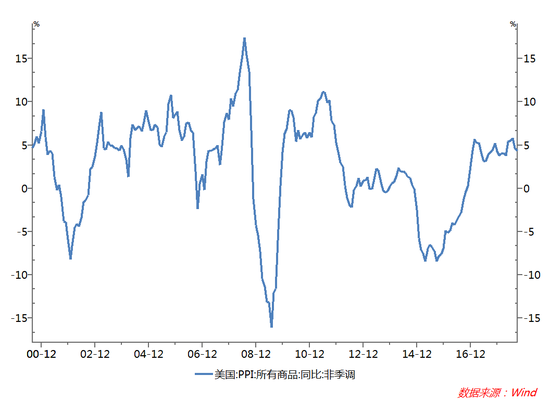 Figure 5: US PPI year-on-year (%)
 Fourth, the high operation of the confidence index shows that the market confidence is still sufficient. From the perspective of confidence index, the ISM manufacturing and non manufacturing PMI indexes of the United States in October were 57.3 and 60.7, respectively. Although they fell slightly compared with the previous month, they were both significantly higher than the 50 rise or decline line and close to the high of 60, indicating that the U.S. economy is still in the expansion range. From the perspective of consumer confidence index, the consumer confidence index of the University of Michigan in October was 98.6, which was lower than 100.1 last month, but still at a high level.
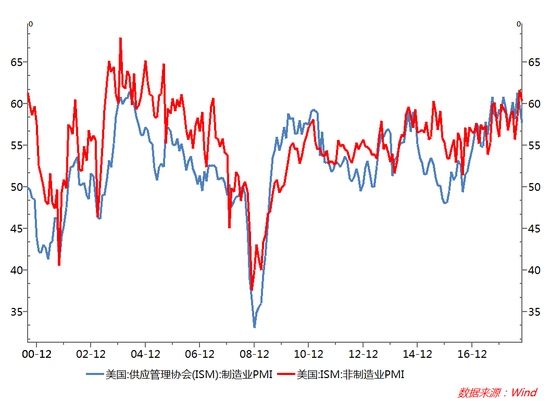 Figure 6: US ISM manufacturing and non manufacturing PMI
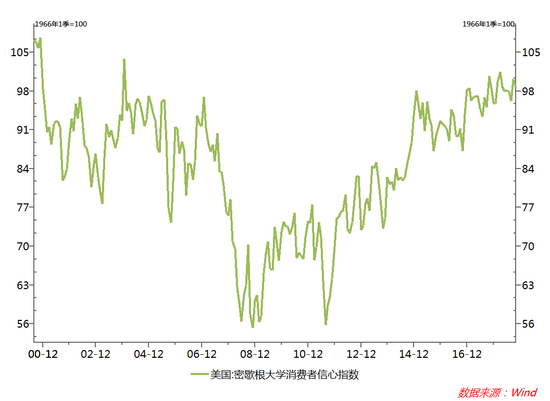 Figure 7: University of Michigan Consumer Confidence Index
 2、 What factors may promote the inflection point of the recovery of the US economy
Reviewing the reasons for the formation of several important economic inflection points in the United States in the last century may help us to judge which factors will trigger the inflection point of the U.S. economy again in the future.
 Table 1: Reasons for the formation of several important economic inflection points in the United States
 It can be seen from Table 1 that since the last century, the United States has experienced four important economic inflection points, which were caused by the bursting of the stock market bubble, the rise of oil prices twice, and the bursting of the real estate bubble. That is to say, the three factors of stock market, property market and oil price may be the important reasons for triggering the turning point of economic recovery. Therefore, we will analyze whether these three markets will become the cause of triggering a new round of recovery inflection point of the US economy under the current environment.
First, we will analyze the real estate market. At this stage, the real estate market in the United States is relatively healthy, not a bubble. From the perspective of residents' leverage ratio, after the subprime crisis, the residents' leverage ratio continued to decline, which was significantly lower than the peak of the subprime crisis. At the same time, the non-performing rate of real estate loans in the United States is also declining, indicating the overall health of the real estate loan market.
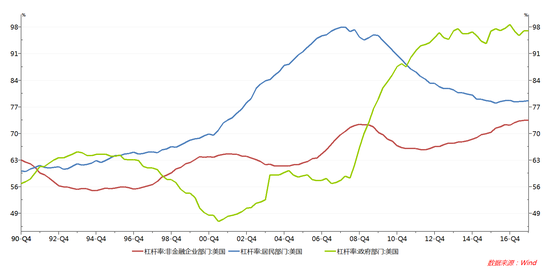 Figure 8: Low leverage ratio of US residents (%)
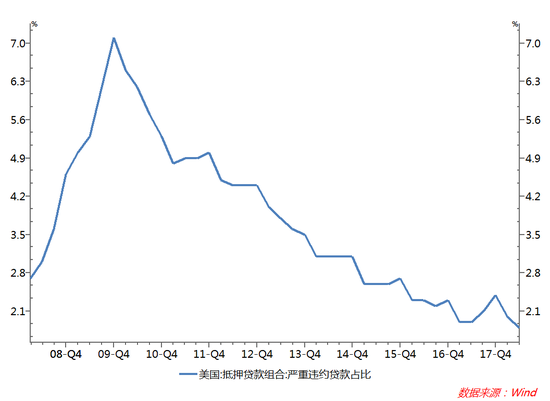 Figure 9: The non-performing rate of real estate loans in the United States declined (%)
 The inventory of existing homes in the United States has basically been in a downward range since the high point in 2007. The current inventory level of 1.88 million units is below the 1/4 quantile. Although it has rebounded from the low point this year, it is still at a low level. Therefore, the inventory level of existing houses provides space for residential investment expansion. According to historical data, there is an obvious negative correlation between construction expenditure and housing vacancy rate. Since the financial crisis, the housing vacancy rate has entered a continuous downward period, falling from the historical peak of 2.9% to 1.5%. However, under the current low inventory level, the vacancy rate is highly likely to remain low or continue to decline, so the construction expenditure is expected to accelerate.
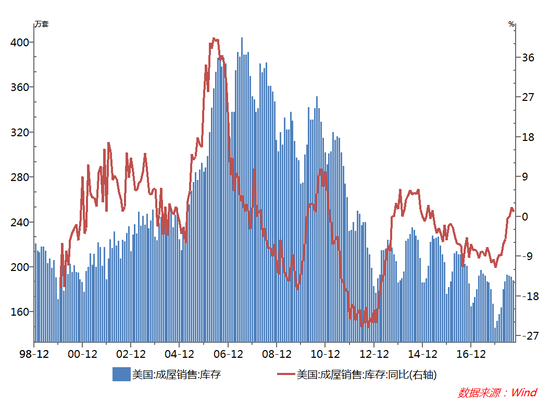 Figure 10: Low inventory of existing houses in the United States
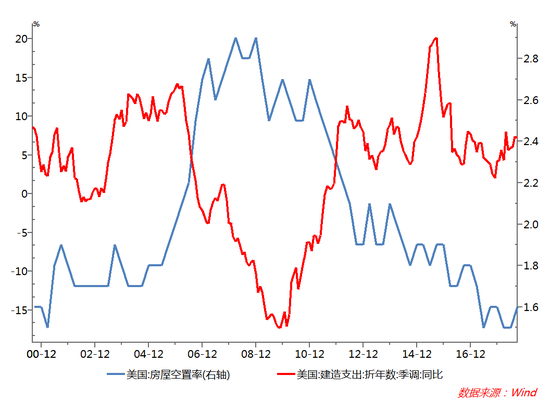 Figure 11: The housing vacancy rate in the United States is negatively correlated with construction expenditure
 On the whole, the U.S. real estate industry is in a state of low inventory and low investment, while the leverage ratio of residents and the "bad debt" of housing loans are at a low level, and the overall pressure of housing loans on the residential sector is small; On the other hand, housing inventory and vacancy ratio are both at a historical low level, and the overall production and sales of housing are in a bottom-up trend, which can be judged that the degree of the U.S. real estate bubble is limited.
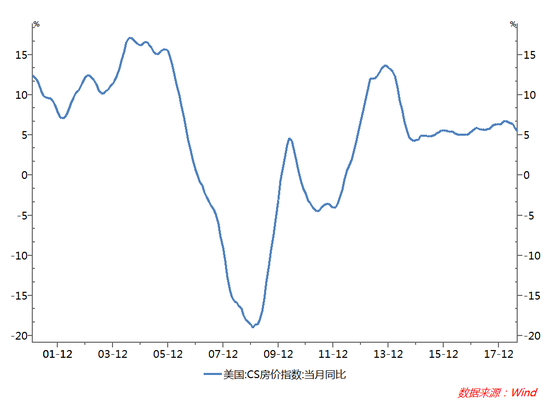 Figure 12: The overall performance of US housing prices is stable
 Next, we will analyze the stock market. From the analysis of the current financial environment, the adjustment probability of the US stock market is high. The US stock market has been bullish for nearly ten years. Since this year, as the Federal Reserve continues to raise interest rates and the yield of US bonds continues to rise, the valuation of US stocks has been under obvious pressure. The dynamic P/E of the S&P 500 index shrank by 17% from the end of January to the end of October, resulting in a 7.5% drop in the index over the same period. Since the fourth quarter, the trend of adjustment of US stocks has been relatively obvious.
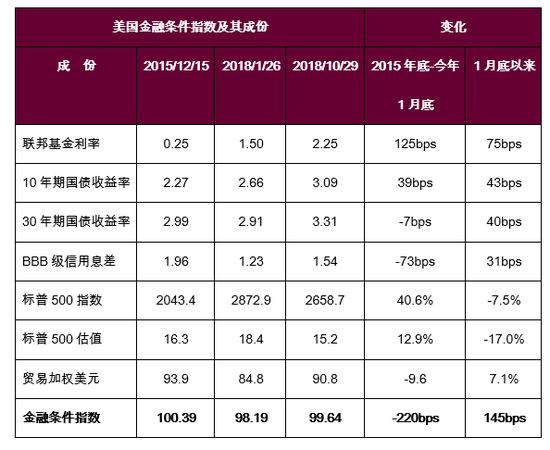 Table 2: American Financial Condition Index and Its Component Changes Source: Bloomberg, CICC Securities
 However, this round of US stock market adjustment may not be enough to impact the real economy. After the financial crisis, the reason why the U.S. stock market has been able to walk out of the long-term bull market for nearly 10 years is that, in addition to the factors of the U.S. economic recovery, the most important thing is that the continuous improvement of the profitability of U.S. technology enterprises has improved the valuation of the U.S. stock market, laying the foundation for the U.S. stock market bull market. It is also in this long bull market that Apple and Amazon became the first technology companies with a market value of more than $1 trillion, and became milestone companies in the history of American stocks. This round of rise in technology stocks is different from the bursting of the Internet stock bubble at the beginning of this century. The last round of network has just started. The speculation concept is serious. The corporate profits are not enough to support the shares. It is inevitable that the bubble will burst. This round of Internet technology companies' stock boom is all about concept, technological strength, and profit return. The advantages of American technology companies in chip, operating system and other software and hardware technologies, cloud computing, artificial intelligence, big data, mobile Internet and other emerging information technology development and application are still unmatched by any other country, and the technological leadership has also brought these enterprises a real profit and competitive advantage, Make its stock price gain the support of profit and keep climbing.
Therefore, even if the US stock market is adjusted, its amplitude will not be too large, and the impact on the real economy will not be greater than that of the last time when the dotcom bubble burst. It is likely to be similar to the stock market crash in 1987, because the short duration may not have a substantial impact on economic growth.
Finally, the oil price is analyzed. The energy revolution after the subprime mortgage crisis turned the United States from a net energy importer to a net exporter, so the impact of rising crude oil prices on the United States is limited. According to the US Energy Information Administration (EIA) data, the US was the world's largest oil producer in 2017. The US Department of Energy believes that the hydraulic fracturing technology revolution (a shale oil extraction technology) that the US started 10 years ago has opened the door to its own shale oil exploitation, enabling "the US to have more options and less concerns when using crude oil resources". The Associated Press reported earlier that the Trump administration said in an important new policy statement in August that the United States had no need to save oil at the economic level.
In 2011, the United States became a net exporter of petroleum products. At present, the United States has become a net exporter of coal, coke, petroleum products, natural gas and biomass energy. In 2017, the U.S. energy dependence was only 7.61%. In 2005, the total net energy imports of the United States were the highest, with 30.14% dependence on foreign energy. In 2007, the energy consumption of the United States reached the highest value, 101.015 trillion British thermal units, which has not exceeded this figure until 2017. At the same time, the domestic energy output is growing, from 71.398 trillion British thermal units in 2007 to 87.536 trillion British thermal units in 2017. Thus, in 2017, the net energy imports of the United States dropped to the lowest level since 1982.
The energy revolution has not only freed the United States from its dependence on imported crude oil, reduced the impact of international crude oil price fluctuations on its domestic economy and prices, but also had a profound impact on global geopolitics. The United States can appropriately shrink its military and financial investment in order to master energy and resources, which will also have a corresponding boost effect on its domestic economy.
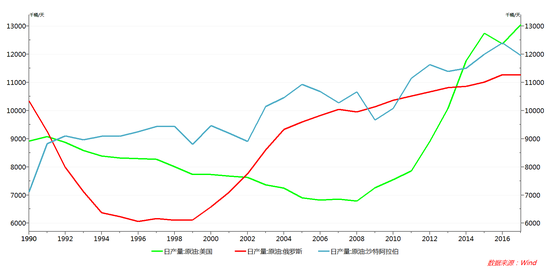 Figure 13: The United States has become the world's largest oil producer
 3、 The peak of American economic prosperity has passed, but it will not fall into a deep recession immediately
The above analysis shows that the US economy is running well at present, and because its real estate market is still healthy, there is no bubble. The energy revolution led to the fluctuation of oil prices, which had little impact on the American economy. Although there are adjustment risks in the stock market, they are not enough to impact its real economy, so the U.S. economy will continue to recover in the short term, but the following factors may lead to a corresponding slowdown in the growth of the U.S. economy next year.
1. After the interest rate rises due to the increase of interest rate and the contraction of interest rate, the investment of enterprises and the consumption of residents will be suppressed.
The restraining effect of tightening financial conditions on the real economy is gradually showing, and the momentum of the US economy will inevitably slow down. At the residents' level, the data on real estate demand and durable goods consumption, which are highly sensitive to interest rates, are weakening. With the rise of mortgage interest rate, the sales of existing houses have peaked at the beginning of the year; At the corporate level, since the beginning of the year (by the end of September), corporate bond issuance has declined by 15% year on year, and high-yield bond issuance has declined by 28% year on year. Accordingly, the growth of equipment investment and durable goods orders of American enterprises are slowing down. In addition, the increase in interest rates also causes enterprises to face higher financing costs, which puts pressure on profits. The decrease in corporate profits further urges them to reduce investment, so the growth rate of private fixed asset investment will also fall.
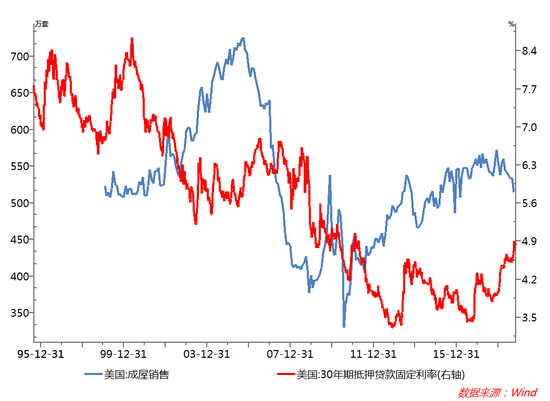 Figure 14: The rise in the interest rate of US housing loans has led to the decline of housing sales
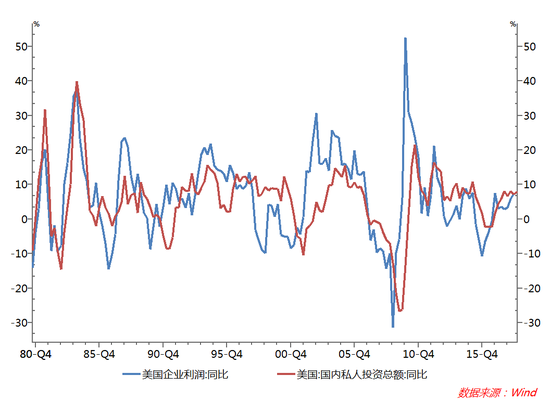 Figure 15: US corporate profits and investment growth
 2. The stimulating effect of tax cuts on the economy is diminishing marginally.
According to the estimation of the U.S. Tax Policy Center (TPC), this round of tax cuts will increase the nominal size of the U.S. GDP by 0.8, 0.7, and 0.5 percentage points in 2018-2020, respectively. Since this year's tax cut stimulus will increase the base for next year, it is possible to significantly increase the growth rate of this year and lower the growth rate of next year, as reflected in the predicted growth rate. Moreover, because this round of tax cuts took place against the background of accelerated economic recovery in the United States, corporate profits and residents' income are already in the process of recovery, the incentive effect of tax cuts will be faster and more reflected this year, and the marginal effect will be diminishing in the next two years.
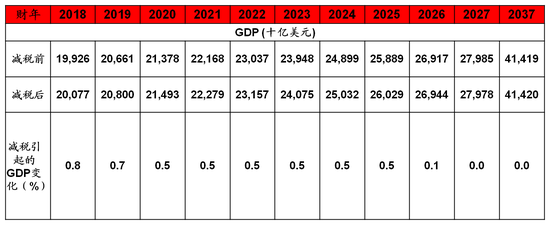 Table 2: The dynamic impact of tax cuts calculated by the US TPC on US GDP
 3. The Sino US trade conflict may have a certain drag on the US economy.
The trade war will affect the U.S. economy in two ways: First, in the short term, in order to reduce the pressure of rising costs after tariff increases, American enterprises tend to grab the advanced exports to replenish inventory, making the contribution of private inventory investment in the U.S. GDP to economic growth significantly increase, jumping from -0.91 percentage points in the fourth quarter of 2017 to 2.07 percentage points in the third quarter of this year, which is the most improved item. However, once the trade war escalates in the future, the expansion of the scope of tariff levy and the rise of the tax rate will lead to a significant reduction in the willingness of enterprises to actively replenish inventory brought about by expanding imports. Then, after the overdraft in the third quarter of this year, the inventory investment, combined with the inhibition of demand due to interest rate hikes, is likely to show a significant decline, which will drag down economic growth; Second, the trade war may also increase the cost of American enterprises and residents. At present, among the goods imported by the United States, China accounts for more than a relatively high proportion (more than 40%). In addition to some labor-intensive necessities of life, it also includes capital intensive products such as telecommunications and recording equipment, automatic data processing equipment, and so on. The United States cannot quickly find substitutes for these products after levying customs duties, This means that the United States must accept better product prices, which will inevitably lead to an increase in the production costs of American enterprises and consumer costs. The rise in inflation may speed up the pace of interest rate hikes in the United States, which is also not conducive to economic growth in the United States.
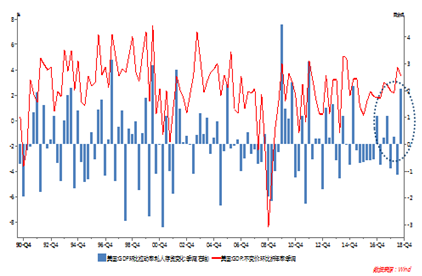 Figure 16: The contribution of private inventories to GDP in the United States increased significantly due to the rush for imports
 4. The stock market adjustment will also affect the US real economy to some extent.
Different from the range from 2016 to the end of 2017, since this year, as the Federal Reserve continues to raise interest rates and the yield of US bonds continues to rise, the valuation of US stocks has been under obvious pressure. Since the end of January, the dynamic P/E of the S&P 500 index has shrunk by 17%, resulting in a 7.5% decline in the index over the same period. When US stocks rise, they will stimulate enterprise investment and residents' consumption through Tobin Q effect and wealth effect, thus supporting economic growth. On the contrary, once the stock market drops significantly, the reverse effect may drag down investment and consumption, thus having a downward effect on economic growth.
5. This round of American economic expansion cycle is expected to become the longest in history.
According to the statistical research results of NBER, the National Bureau of Economic Research, there were only two economic expansion cycles of more than 100 months in the history of the United States, namely, the 1960s and 1990s. Among them, the 120 month economic expansion cycle created when Clinton was in power is the longest at present. The current round of economic expansion cycle of the United States has lasted 112 months until October this year. If it can last until the end of next year, it will surpass the Clinton era and become the longest economic expansion cycle in American history.
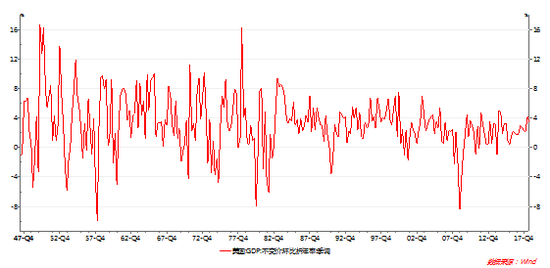 Figure 17: Three rounds of long-term economic expansion experienced by the United States
 4、 The long-term risk points of the US economy
Although the US economy is still stable at present, and the short-term economic growth may slow down, there is no major factor that will prompt the US economy to fall into recession again soon. However, this does not mean that the US economy can rest easy. In the long-term economic operation of the US, there are still the following two risk points worthy of attention:
First, there is the risk that the fiscal deficit rate will rise too quickly. As we all know, the current US government is "heavily indebted". According to the latest statistics, the total US national debt has reached 21.5 trillion US dollars. At present, the debt of the United States has not slowed down, but has been giving the accelerator. On October 29, the US Department of Finance said that due to the impact of rising deficits caused by increased government spending and stagnant tax revenue, it is expected that the total amount of US debt issuance will exceed $1 trillion in 18 years. In the next fourth quarter, it is estimated that the net issuance of bonds will be $425 billion, bringing the total issuance of bonds in 2018 to $1.338 trillion, which will be the highest annual issuance since 2010. In terms of fiscal deficit, a report released by the US Budget Office (CBO) on October 15 showed that the US government's fiscal deficit in the 2018 fiscal year ended on September 30 this year was 17% larger than the same period last year, reaching 779 billion US dollars, a new high in six years. This is the first full fiscal year since Trump took office. CBO also predicts that this number will continue to grow in 2019. It is expected to reach US $973 billion in 19 years and more than US $1 trillion in 2020. The International Monetary Fund even warned that if the United States does not take measures to solve its fiscal deficit, the ratio of its fiscal deficit to GDP will exceed that of Italy, the European deficit country, by 2023. Since the current debt ratio of the US central government to GDP is close to 100%, the interest rate of 10-year US treasury bonds has exceeded 3% after the US dollar continued to raise interest rates, which means that its annual interest expenditure accounts for more than 3% of GDP. If interest rates continue to rise, it will significantly increase the interest burden of the government. After the mid-term elections in the United States, the Democratic Party once again won the majority of seats in the House of Representatives, which may hamper Trump's tax cuts and fiscal spending plans on the future government debt issue. At the same time, it is likely that the government will not agree to increase the federal debt when it reaches the statutory limit, which may lead to the risk of government shutdown in 2011 and 2013 again.
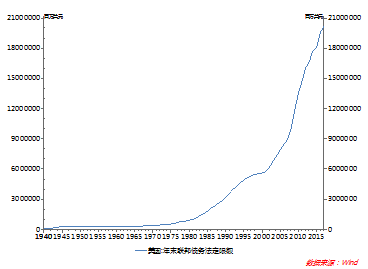 Figure 18: Statutory limits of US federal government debt
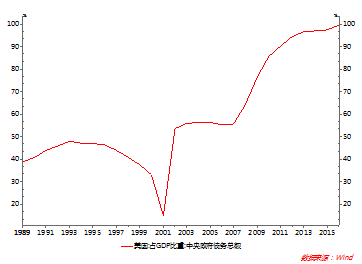 Figure 19: The proportion of US central government debt in GDP is close to 100%
 The second is the risk of social division caused by the accelerated polarization between the rich and the poor. After the subprime crisis, although the overall balance sheet of American residents was relatively healthy, and the net wealth of residents continued to rise, the distribution of wealth continued to deteriorate. The proportion of top 1% of households in the wealth of the United States rose rapidly, approaching 40% by 2016; Among the top 10%, the remaining 9% of households maintained a stable proportion of wealth, while the remaining 90% of households showed a significant decline in their proportion of wealth. The income situation also shows a deterioration. From 1970 to 2017, the number of middle-income households in the United States decreased from 58% to 47% of the total number of American households, a decrease of 11 percentage points. The proportion of households with the highest income of 5% in the total income has also increased from 15% in the 1970s to 21% at present, while the proportion of households with the lowest income of 20% has decreased from 5.5% to 3.1%. At the same time, the Gini coefficient of the United States is also rising, from about 0.4 in the 1970s to 0.48 now. Therefore, the income distribution in the United States is polarized, and the wealth is mainly concentrated in the hands of a small number of people. However, Trump did not propose clear and targeted policies and measures to address this issue.
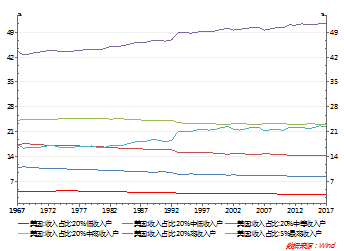 Figure 20: Polarization of income distribution of American residents
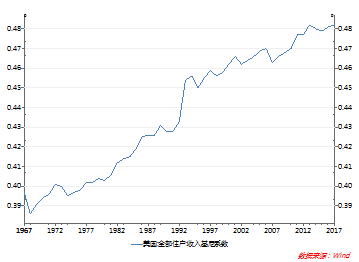 Figure 21: Gini coefficient of American residents continues to rise
 (About the author of this article: economist)