On the periphery, the pattern of high yield of US beans has been set, and the year-end inventory is greatly affected by Sino US trade. The seasonal production cycle of horse palm is weak in export, and the sharp drop in crude oil has hindered the speculation of raw firewood. Domestic, institutional expectations soybean The import volume in November was significantly lower than that in previous years, but the current port inventory was on the high side, and the China Feed Industry Association adjusted the proportion of protein blending to alleviate the anxiety of tight soybean supply; The soybean oil inventory was at a record high, the vegetable oil increased, and the brown oil slightly decreased. After the Spring Festival stock was opened in late November, the inventory suppression or slightly improved.
main points:
The pattern of high yield of American beans has been determined, and domestic supply may be tightened locally in the later period
Soybean oil inventory is at a record high, and may be improved when stocking up on New Year's Day and Spring Festival
Seasonal production increase cycle of horse palm, and there is no speculation about raw firewood
Oil meal ratio is low, and oil price difference is at the upper edge of the range
Viewpoint and operation strategy: in the absence of major influencing factors, the short-term probability of the main oil force will maintain bottom oscillation, and the y1901 pressure will be 5950, supporting 5580; P1901 pressure 4900, support 4500. Sino US trade friction, horse palm oil export, exchange rate, crude oil price, tariff and other factors may cause disturbance. Pay attention to whether the grease can recover under the condition of negative containment and weakening after the stock is opened.
1、 Market review
In October, after a short rebound, the grease index began to fluctuate and decline. Recently, it has broken through the lower edge of the box, with a tendency to probe the front bottom. In the first ten days of the year, the US agriculture supply and demand report was unexpectedly neutral, and Sino US trade frictions intensified. The low demand for superimposed oil was good, and oil rebounded; In the second half of the year, the sharp drop in international crude oil blocked the speculation of raw firewood, weakened the export of horse palm, hit a record high in soybean oil stocks, and the oil shock declined.
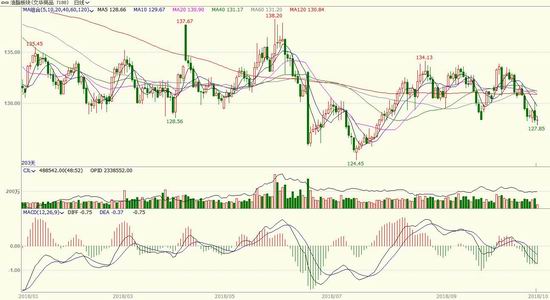
Figure 1: Trend of oil index
(Data source: Wenhua Finance)
2、 Grease fundamentals
(1) Soybean oil
In terms of US soybeans, according to the October supply and demand report of the United States Department of Agriculture (USDA), US soybeans have newly sown 89.1 million acres (8960 last month, 9010 last year), yield 53.1 bushels per acre (53.3 expected, 52.8 last month, 49.3 last year), output 4.69 billion bushels (47.33 expected, 46.93 last month, 44.11 last year), export 2.06 billion bushels (20.60 last month, 21.29 last year), Squeeze 2.07 billion bushels (20.70 last month, 20.55 last year), and 885 million bushels at the end of the period (expected 8.98, 8.45 last month, 4.83 last year). The output and inventory of US soybeans were slightly higher than the predicted value last month, but slightly lower than the market expectation. This report slightly overestimates the soybean market. However, the pattern of high yield of US soybeans has been determined, and the US soybeans sales have been blocked due to the Sino US trade war. The upward space of US soybeans has been restrained. At present, Meidou has entered the harvest season, and the harvest speed is lower than the average in previous years due to the weather. According to USDA's weekly crop report on October 29, as of October 28, the harvest rate of American beans was 72%, compared with 81% in the same period last year, and the five-year average was 81%.
Table 1: Supply and demand balance of soybean series in October of USDA
(Data source: USDA)
US soybeans have been harvested and listed in succession, but their export has been weakened due to the continuous trade friction between China and the United States; Brazil, another major importer of China, had less than 19 million tons of soybeans at the beginning of the month, and less than 10 million tons of soybeans could be exported to China. If the import volume is assumed to remain unchanged, China's soybean supply will face a local tight situation. On October 26, China Feed Industry Association approved the release of two group standards, namely, Formula Feed for Piglets, Growing and Finishing Pigs and Formula Feed for Protein and Broilers Soybean meal The annual consumption is expected to decrease by about 11 million tons, driving the reduction of soybean demand by about 14 million tons. However, because the standard is not mandatory, and the use of soybean meal is more adjusted by reference to the market price, the Sino US trade war is still an important market disturbance factor. At present, the Sino US trade friction continues, the marginal effect on the panel is diminishing, the global soybean trade pattern is changing, and the logic of the soybean system being affected by politics remains unchanged. Later, we will focus on the actual gap and the resumption of Sino US trade at the end of November.
According to the latest survey of Cofeed, 102 ships of soybeans imported from domestic ports are expected to arrive at the port in October 2018, which is 6.399 million tons, 6.1 million tons in November, 6 million tons in December, and 5 million tons in January. As a comparison, the arrivals from October last year to January next year were 6.789 million tons, 8.6842 million tons, 9.55 million tons and 8.48 million tons respectively. That is to say, 23.399 million tons of soybeans arrived in Hong Kong from October to January, a decrease of 10.09 million tons compared with the same period of previous years.
Figure 2: China's monthly import volume (10000 tons)
(Data source: China Customs)
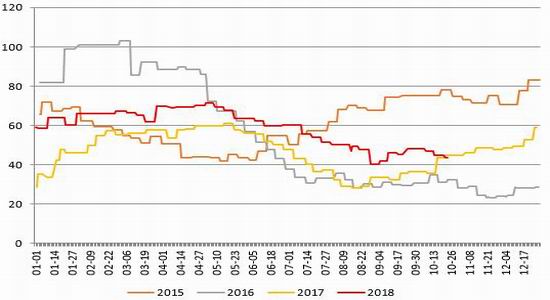
As of October 29, China's soybean port inventory was 6.9806 million tons, an increase of 79600 tons over the same period of last month and 189900 tons over the same period of last year, which was at the upper edge of the historical inventory range of nearly five years. In November, the change direction of soybean port inventory depends on the change direction of arrival volume and soybean meal demand. It is expected that the high level state will be difficult to change significantly.
Figure 3: Port stock of imported soybeans (10000 tons)
(Data source: wind)
In October, due to the National Day holiday, the soybean crushing volume of the oil factory dropped by 2.2444 million tons to 5.7325 million tons compared with September, but increased by 423800 tons compared with 5.3087 million tons in the same period last year.
Figure 4: Weekly trend chart of national soybean crushing volume in recent years
(Data: Tianxia Granary)
In terms of soybean oil inventory, due to the high carry over inventory of the previous year, the commercial inventory of soybean oil in this year is at an extreme value compared with the same period of previous years. By October 26, the total domestic commercial stock of soybean oil had reached 1868900 tons, 204200 tons more than 1664700 tons in the same period last month, and 16.68% more than 1601700 tons in the same period last year. In the short term, due to the recent decline in the price of oil and fat, traders are not active in receiving goods, and the market turnover is light, so it may be difficult to stop the rise of commercial soybean oil inventory. However, the inflection point of the inventory caused by the high demand again is expected to occur on the New Year's Day and the Spring Festival when the stock is opened.
Figure 5: Commercial stock of soybean oil (10000 tons)
(Data source: wind)
(II) Palm oil
According to the September supply and demand report of Malaysia Palm Oil Bureau (MPOB), Malaysia's palm oil production increased by 14.38% to 1.85 million tons compared with the previous month, exports increased by 47.18% to 1.62 million tons month on month, and inventories increased by 1.45% to 2.54 million tons month on month. As a comparison, the market predicted that the output in September would reach 1.8615 million tons, the export would reach 1.6495 million tons, and the inventory at the end of the month would be 2.471 million tons. The output and export were slightly lower than expected, the inventory growth was higher than expected, the report data was neutral and empty, and the short-term impact on the internal and external market was obvious.
Figure 6: MPOB Monthly Data in September
(Data source: MPOB)
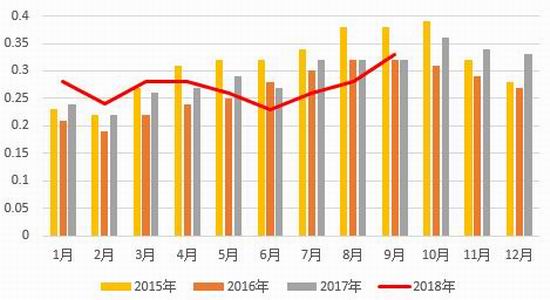
In terms of palm oil production, 2018 was originally the year of international palm oil production increase. From January to April, Malaysia's palm oil production recovered well, with an average monthly yield of 0.27 tons/ha, higher than last year's 0.25 tons/ha. The recovery of output was also obvious, which was the peak of the same period in the past four years. After May, the yield per unit area of horse palm declined. Since July, although the yield per unit area has stopped falling and turned up, it is still lower than the average of the same period in previous years. According to the seasonal law, October is still probably a production increase cycle, and the unit yield will generally decline rapidly after November. Pay attention to the difference between the output growth data in this month's MPOB monthly report and the market expectation.
Figure 7: Malaysian palm oil production (10000 tons)
(Data source: wind)
Figure 8: Per unit yield of palm oil in Malaysia (t/ha)
(Data source: wind)
In terms of the export of horse palm oil, although the export tariff is still low to zero, the export volume in October fell slightly compared with that in September. According to AmSpec Agri Malaysia, an export inspection company, on October 25, Malaysia's palm oil export volume from October 1 to 25 was 1.097 million tons, down 17.4% from 1.3267 million tons in the same period in September. According to the data released by the shipping survey agency ITS on October 25, Malaysia's palm oil export volume from October 1 to 25 was 1068700 tons, 22.1% less than the 1370900 tons exported from September 1 to 25.
Figure 9: Malaysia's palm oil export volume (10000 tons)
(Data source: wind)
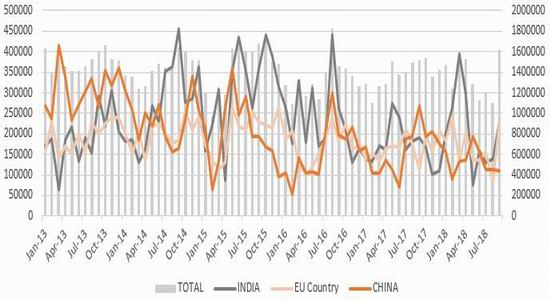
Figure 10: Malaysian Palm Oil Exports by Country (ton)
(Data source: MPOB)
In terms of inventory, Malaysia's palm oil inventory in 2018 was basically at a high level in the same period of history. In October, because the export of horse palm fell more than that of last month, the inventory will still probably rise. According to the historical law, after November, the stock growth of horse palm may slow down due to the decline of unit yield.
Figure 11: Malaysia's palm oil inventory (10000 tons)
(Data source: MPOB)
According to Cofeed data, the domestic import volume in October is expected to be 450000 to 480000 tons, that in November is expected to be 470000 to 490000 tons, and that in December is expected to be 540000 tons. With the improvement of import profit in the later period, the import may still be adjusted in the later period.
Figure 12: Quantity of palm oil imported to port (ton)
(Data source: Ministry of Commerce)
As of October 26, the total inventory of domestic palm oil ports had reached 435000 tons, 45000 tons less than that of the same period last month, and 3.3% less than that of the same period last year. In the late September, the weather turned cold, and palm oil entered the seasonal consumption off-season. In addition, the shipping date of some palm oil was postponed. It is expected that the palm oil storage will increase in the later period.
Figure 13: Domestic palm oil port inventory (10000 tons)
(Data source: wind)
3、 Price comparison analysis
In recent years, the fluctuating range of the continuous plate oil meal ratio has moved downward and the spacing has narrowed. In previous years, the operating range was generally [2.4, 3.2]. After 2013, because the residents' demand for protein exceeded the energy demand, the oil plant's 18:79.5 ratio squeezing mode led to the differentiation of oil meal supply and demand, and the price ratio was probably [1.9, 2.3]. However, in the context of Sino US trade frictions this year, the pricing strategy of oil plants is more inclined to support the meal, and the price of oil meal has moved down again. On October 30, the continuous oil meal was as low as 1.71, close to the lower edge of the range.
Figure 16: Oil meal ratio of continuous tray
(Data source: wind)
On October 30, the price difference of soybean oil was 1014 yuan/ton, which was at the upper edge of the price difference range. Brown oil occupied the soybean oil market; The price difference of kidney bean is 902 yuan/ton, which is high in the range. The bean oil has crowding out effect on the kidney bean oil market. The high price difference between soybean oil and palm oil is caused by the high cost of soybean oil driven by trade friction factors and the weakening of the stock accumulation in the origin of horse palm export; The high price difference of rapeseed oil is mainly caused by the difference in stocks of beans and rapeseed oil.
Figure 17: Price difference of grease
(Data source: wind)
4、 Conclusion
On the periphery, the pattern of high yield of US beans has been set, and the year-end inventory is greatly affected by Sino US trade. The seasonal production cycle of horse palm is weak in export, and the sharp drop in crude oil has hindered the speculation of raw firewood. At home, the agency expects that the import volume of soybeans in November will be significantly reduced compared with previous years, but the current port inventory is on the high side, and the China Feed Industry Association will adjust the proportion of protein blending to alleviate the anxiety of soybean supply tightening; The soybean oil inventory was at a record high, the vegetable oil increased, and the brown oil slightly decreased. After the Spring Festival stock was opened in late November, the inventory was suppressed or slightly improved; The oil meal ratio is under pressure, and the oil price difference is at a high level in the range, with obvious price containment. Focus on the resumption of Sino US trade negotiations at the end of November and the monthly supply and demand reports of USDA and MPOB.
In the absence of major influencing factors, the short-term probability of the main oil force will maintain the bottom oscillation, and the y1901 pressure will be 5950, supporting 5200; P1901 pressure 4900, support 4300. Sino US trade friction, horse palm oil export, exchange rate, crude oil price, tariff and other factors may cause disturbance. Pay attention to whether the grease can recover under the condition of negative containment and weakening after the stock is opened.
5、 Policy
Based on the above analysis and research:
The soybean oil 1901 is short near 5700. The target is the bottom area 5200-5300 in recent years. If it falls to the bottom area, it can be more supported.
Palm oil 1901 is short near 4700. The target is 4200-4300 at the bottom of the tank in 2015. If it falls to this area, it can be more supported.
6、 Risk control
Risk factors:
Sino US trade friction, horse palm oil export, exchange rate, crude oil price, tariff and other factors may all have a phased impact on the recent trend.
Risk control measures:
1. Band trading, entering the stop loss range and gradually stopping loss.
For the 1901 soybean oil contract, after entering the market, the relative average position price lost 100 points and began to consider stop loss operation, and the loss was 200 points;
For the 1901 palm oil contract, after entering the market, the relative average position price loss was 80 points and the stop loss operation was considered, and the loss was 150 points.
2. For short-term transactions, stop loss of more than 5% each time.
Beite Futures Team 2
Sina statement: The purpose of posting this article on Sina.com is to convey more information, which does not mean to agree with its views or confirm its description. The content of this article is for reference only and does not constitute investment advice. Investors operate accordingly at their own risk.
Editor in charge: Song Peng