World iron ore production and consumption
1. World iron ore production
(1) The world's iron ore output is on the rise as a whole
After 2000, the rapid development of steel industry in the world, especially in Asia, has led to a substantial increase in the world's iron ore consumption, which in turn has promoted the global production of iron ore. During the ten years from 2002 to 2011, the overall output showed an upward trend, increasing by 1.05 billion tons, with an average annual growth of about 105 million tons, with an average annual growth rate of 8.49%. Especially from 2003 to 2007, the average annual growth rate exceeded 10%. In 2011, the global iron ore output was 2.04 billion tons.
(2) The world's iron ore production is relatively concentrated
South America, Asia and Oceania are the main sources of global iron ore production in recent years. The main iron ore producers in these regions are Brazil, China, India, Australia, etc. From 2002 to 2011, the annual growth of iron ore in Australia and China (raw ore production) exceeded 20 million tons, while that in Brazil and India exceeded 10 million tons. The total annual growth of the four countries exceeded 90% of the world. It can be seen that global iron ore production is relatively concentrated.
Table 1 Production of Top 10 Iron Ore Production Countries in the World Except China from 2002 to 2011
(Unit: 10000 tons)
| |
two thousand and two |
two thousand and three |
two thousand and four |
two thousand and five |
two thousand and six |
two thousand and seven |
two thousand and eight |
two thousand and nine |
two thousand and ten |
two thousand and eleven |
| Brazil |
twenty-two thousand five hundred and ten |
twenty-four thousand five hundred and sixty |
twenty-seven thousand and fifty-two |
twenty-nine thousand two hundred and forty |
thirty-one thousand eight hundred and sixty-three |
thirty-three thousand six hundred and fifty-three |
thirty-four thousand and six hundred |
thirty thousand and five hundred |
thirty-seven thousand and two hundred |
thirty-nine thousand and one hundred |
| Australia |
eighteen thousand seven hundred and twenty-two |
twenty-one thousand and two hundred |
twenty-three thousand four hundred and seventy |
twenty-five thousand seven hundred and fifty-three |
twenty-seven thousand five hundred and nine |
twenty-nine thousand nine hundred and six |
thirty-four thousand nine hundred and eighty |
thirty-nine thousand three hundred and ninety |
forty-three thousand two hundred and eighty |
forty-eight thousand seven hundred and ninety |
| India |
eight thousand six hundred and forty |
nine thousand nine hundred and ten |
twelve thousand and sixty |
fourteen thousand two hundred and seventy-one |
eighteen thousand and ninety-two |
twenty thousand six hundred and ninety-four |
twenty-two thousand and three hundred |
twenty-one thousand eight hundred and sixty |
twenty-one thousand and two hundred |
nineteen thousand and six hundred |
| Russia |
eight thousand four hundred and thirty-five |
nine thousand one hundred and thirty-seven |
nine thousand six hundred and ninety-eight |
nine thousand six hundred and seventy-six |
ten thousand three hundred and ninety |
ten thousand four hundred and ninety-five |
nine thousand nine hundred and twenty-seven |
nine thousand two hundred and five |
nine thousand nine hundred and six |
ten thousand three hundred and eighty |
| Ukraine |
five thousand eight hundred and ninety |
six thousand two hundred and fifty |
six thousand five hundred and fifty-four |
six thousand eight hundred and fifty-seven |
seven thousand three hundred and ten |
seven thousand seven hundred and forty-three |
seven thousand one hundred and eighty-one |
six thousand five hundred and eighty-three |
seven thousand nine hundred and seventeen |
eight thousand one hundred and nineteen |
| U.S.A |
five thousand one hundred and fifty |
four thousand eight hundred and forty-eight |
five thousand four hundred and seventy |
five thousand four hundred and thirty |
five thousand two hundred and ninety |
five thousand two hundred and forty |
five thousand three hundred and sixty |
two thousand six hundred and fifty |
four thousand nine hundred and fifty |
five thousand three hundred and sixty |
| South Africa |
three thousand six hundred and forty-eight |
three thousand eight hundred and nine |
three thousand nine hundred and twenty-seven |
three thousand nine hundred and fifty-four |
four thousand one hundred and thirty-three |
four thousand one hundred and fifty-six |
four thousand and nine hundred |
five thousand five hundred and forty |
five thousand six hundred and ninety |
five thousand two hundred and ninety |
| Canada |
three thousand and ninety |
three thousand three hundred and thirty-two |
two thousand eight hundred and twenty-six |
three thousand and thirteen |
three thousand four hundred and ninety-seven |
three thousand four hundred and ten |
three thousand two hundred and ten |
three thousand and three hundred |
three thousand seven hundred and fifty |
three thousand seven hundred and ten |
| Sweden |
two thousand and twenty-eight |
two thousand one hundred and fifty |
two thousand two hundred and twenty-seven |
two thousand three hundred and twenty-six |
two thousand three hundred and thirty |
two thousand four hundred and seventy-one |
two thousand three hundred and eighty |
one thousand seven hundred and seventy |
two thousand five hundred and thirty |
two thousand six hundred and ten |
| Venezuela |
two thousand and eighty-nine |
one thousand nine hundred and twenty |
two thousand and two |
two thousand one hundred and eighteen |
two thousand two hundred and ten |
two thousand and sixty-five |
two thousand one hundred and fifty |
one thousand four hundred and ninety |
one thousand and four hundred |
one thousand and six hundred |
| total |
eighty thousand two hundred and two |
eighty-seven thousand one hundred and sixteen |
ninety-five thousand two hundred and eighty-six |
one hundred and two thousand six hundred and thirty-eight |
one hundred and twelve thousand six hundred and twenty-four |
one hundred and nineteen thousand eight hundred and thirty-three |
one hundred and twenty-six thousand nine hundred and eighty-eight |
one hundred and twenty-six thousand one hundred and sixty-eight |
one hundred and thirty-seven thousand eight hundred and twenty-three |
one hundred and forty-four thousand five hundred and fifty-nine |
| Global |
ninety-eight thousand six hundred and fourteen |
one hundred and fifteen thousand nine hundred and twenty-three |
one hundred and twenty-five thousand two hundred and five |
one hundred and forty thousand and sixty-four |
one hundred and fifty-seven thousand six hundred and seventy-four |
one hundred and sixty-nine thousand nine hundred and fourteen |
one hundred and sixty-nine thousand two hundred and sixty-seven |
one hundred and fifty-nine thousand four hundred and eighty-six |
one hundred and eighty-six thousand eight hundred and ninety |
two hundred and four thousand two hundred and fifteen |
| Proportion of ten countries |
eighty-one point three three |
seventy-five point one five |
seventy-six point one zero |
seventy-three point two eight |
seventy-one point four three |
seventy point five three |
seventy-five point zero two |
seventy-nine point one one |
seventy-three point seven four |
seventy point seven nine |
(Source: IISI, World Steel Yearbook)
(3) The supply advantages of the three major mines are obvious
The world's three largest iron ore producers are Rio Tinto of Australia, BHP Billiton and Vale of Brazil. In 2012, the three largest iron ore producers produced 680 million tons of iron ore, an increase of 2.4% year on year. Of which, the value was 320 million tons, down 0.84% year on year; BHP Billiton's 161 million tons, up 7.7% year on year; Rio Tinto was 199 million tons, up 2.4% year on year.
Table 2 Iron ore output of three major manufacturers from 2004 to 2009 (unit: 10000 tons)
| country |
two thousand and four |
two thousand and five |
two thousand and six |
two thousand and seven |
two thousand and eight |
two thousand and nine |
two thousand and ten |
two thousand and eleven |
two thousand and twelve |
| VALE |
twenty-one thousand one hundred and twenty-seven |
twenty-three thousand three hundred and eighty-five |
twenty-six thousand four hundred and fifteen |
twenty-nine thousand five hundred and ninety-three |
twenty-nine thousand three hundred and thirty-seven |
twenty-two thousand nine hundred and thirty-four |
thirty thousand nine hundred and forty-six |
thirty-two thousand two hundred and sixty |
thirty-one thousand nine hundred and ninety |
| BHP |
eight thousand four hundred and twenty-two |
nine thousand six hundred and seventy-five |
nine thousand seven hundred and seven |
nine thousand nine hundred and forty-two |
eleven thousand two hundred and twenty-six |
twelve thousand five hundred and eleven |
twelve thousand eight hundred and six |
fourteen thousand nine hundred and forty |
sixteen thousand and eighty |
| RIO |
ten thousand seven hundred and eighty |
twelve thousand four hundred and fifty |
thirteen thousand two hundred and eighty |
fourteen thousand four hundred and seventy |
fifteen thousand three hundred and forty |
seventeen thousand one hundred and fifty |
eighteen thousand four hundred and sixty-three |
nineteen thousand one hundred and seventy-seven |
nineteen thousand and nine hundred |
| total |
forty thousand three hundred and thirty-two |
forty-five thousand five hundred and sixteen |
forty-nine thousand four hundred and seven |
fifty-four thousand and two |
fifty-five thousand nine hundred and six |
fifty-two thousand five hundred and ninety-five |
sixty-two thousand two hundred and fifteen |
sixty-six thousand three hundred and seventy-seven |
sixty-seven thousand nine hundred and seventy |
| Proportion in global output (%) |
34% |
35% |
29% |
31% |
31% |
33% |
33% |
32.5% |
36% |
(Data source: the annual reports published by each company)
2. World iron ore consumption
(1) World iron ore consumption is increasing year by year
During 2001-2012, global iron ore consumption increased by 88.0%, with an average annual growth rate of 5.9%, of which China's iron ore consumption increased by about 4.2 times, with an average annual growth rate of 13.8%; India's iron ore consumption growth was also very rapid before 2008, with an average growth rate of nearly 8%, but its consumption growth almost stagnated after 2009. From 2001 to 2012, iron ore consumption in nine countries except China grew slowly, with an average annual growth rate of only 0.96% in the past five years; The average annual growth rate of iron ore consumption in countries other than China is 0.5%.
(2) Chinese demand is the main driving force
From 2000 to 2011, the changes in the proportion of apparent iron ore consumption in the world of the top ten countries in terms of pig iron production are shown in the figure below. It can be seen that China jumped 35.3 percentage points to 53.6% in 2010; Japan, the United States and Russia declined by 6.3%, 5.5% and 4.1% respectively,; Germany dropped from 5.0% to 2.4%, down 2.6%, Ukraine dropped 1.8%, South Korea dropped slightly, about 1 percentage point, while India's consumption in total consumption rose slightly, up 2.2%.
(3) The sources of imports vary from country to country
The source of iron ore varies from country to country. More than 99% of Japanese iron ore depends on imports. 61% of the iron ore imported by Japan comes from Australia, 21% from Brazil, 8% from India, and 4% from South Africa. South Korea, Germany and Italy also rely almost 100% on imports of iron ore, and these four countries mainly obtain iron ore from Brazil and Australia; About 50% of iron ore in the United States depends on imports, mainly from Australia, Brazil, India, South Africa, Venezuela and other countries; Russia, Ukraine, India and Brazil are mainly from their own countries.
In 2012, 37.3% of the iron ore consumed in China was supplied by China, and 62.7% was imported. Of the iron ores imported by China in that year, 47.2% came from Australia, 22.1% from Brazil, 4.4% from India, and 5.4% from South Africa.
Iron ore production and consumption in China
1. Iron ore production in China
(1) Iron ore production is increasing
In recent years, with the rapid development of China's steel industry, the demand for iron ore has increased significantly, driving the continuous growth of China's iron ore output.
In 2001, China's raw ore output was 218 million tons, a decrease of 2.5% over 2000, and then increased year by year. By 2005, China's raw iron ore output reached 420 million tons, a year-on-year increase of 35.6%, almost double the output of 2001. During the "Eleventh Five Year Plan" period, the annual average growth rate of iron ore production exceeded 20%, and in 2012, the original mineral quantity of iron ore reached 1.31 billion tons.
China's raw iron ore output from 2000 to 2012
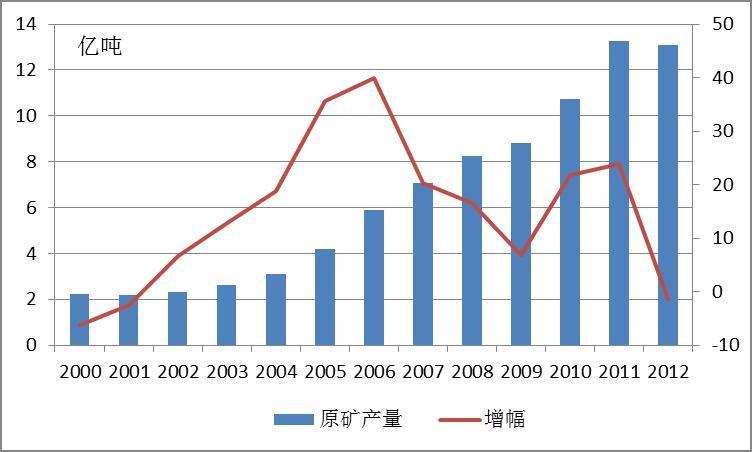
(Source: China Metallurgical Mining Enterprises Association)
(2) The Bohai Rim region has the largest output
In terms of regions, the Bohai Rim region has the largest output of raw iron ore, 720 million tons, which is close to 55% of the total output of the country. If Shanxi and Inner Mongolia, which are close to the Bohai Rim region, are considered, the output of this region in the country will exceed 60%. The proportion of output in the southwest and other regions in North China is also high, both exceeding 10%, while the output in the Yangtze River Delta and coastal areas in South China is low, less than 50 million tons, accounting for less than 3.5% of the total output of the country.
Table 3 Details of China's regional iron ore raw ore output in 2012
| region |
Output (100 million tons) |
Proportion in the whole country (%) |
| Bohai Rim |
seven point two zero |
fifty-four point nine six |
| Yangtze River Delta |
zero point four six |
three point four nine |
| South China coastal area |
zero point four four |
three point three eight |
| Other regions in North China |
one point seven four |
fourteen point zero six |
| Other regions in south central China |
zero point six seven |
five point one two |
| Southwest China |
one point nine zero |
fourteen point five one |
| Northwest China |
zero point five eight |
four point four zero |
(Data source: China Iron and Steel Industry Association)
(3) Iron ore production area is relatively concentrated
In terms of provinces, except Tianjin, Shanghai, Ningxia and Tibet, which are restricted by resources and have no iron ore mining, other regions have production. Among them, Hebei and Sichuan have a large output of 520 million tons and 160 million tons respectively. In addition, the output of Liaoning, Shanxi and Inner Mongolia is also large, with 150 million tons, 81.3 million tons and 80.49 million tons respectively. The output of iron ore in Hebei, Liaoning, Sichuan, Inner Mongolia and Shanxi accounts for about 77% of China's total output. As shown in the figure, Hebei Province has the largest proportion of output, reaching 40%; The second is Sichuan, 12.4%; Liaoning, Shanxi and Inner Mongolia accounted for 11.8%, 6.2% and 6.1% respectively.
From the proportion over the years, Hebei and Liaoning have a high output, accounting for more than 50% of the total output. The output of iron ore in Sichuan has increased rapidly in the past five years. The proportion of other provinces and cities has not changed much. China's iron ore production regions are relatively concentrated.
(4) Low concentration of iron ore production in China
Most iron ore producers in China are small mining enterprises, and the concentration of iron ore production is low. According to the statistics of China Metallurgical and Mining Enterprises Association, as of December 2011, there were 1596 mining enterprises under unified management in China. The total output of the top ten iron ore producers is less than 18% of the total output. All the ten iron ore producers are state-owned enterprises.
Table 4 Top 10 Iron Ore Producers in China in 2010 (Unit: million tons)
| |
province |
Raw ore output |
Concentrate production |
| Anshan Iron&Steel |
Liaoning |
forty-five point six |
fifteen point six |
| Hebei Iron&Steel |
Hebei |
twenty-six point four |
five point seven |
| Baotou Steel |
Inner Mongolia |
twenty-four point five |
eight point five |
| Pangang Group |
Sichuan |
twenty point nine |
seven point nine |
| Taiyuan Iron&Steel |
Shanxi |
nineteen point two |
five point nine |
| Benxi Steel |
Liaoning |
seventeen point seven |
six point five |
| Shougang Corporation |
Hebei |
thirteen |
four point six |
| Masteel Group |
Anhui |
nine point five |
two point four |
| Sichuan Chuanwei Steel |
Sichuan |
eight point five |
two |
| Baosteel Group |
Shanghai |
seven point five |
four |
| total |
|
one hundred and ninety-two point eight |
sixty-three point one |
| Proportion in the national total (%) |
|
18.3% |
17.1% |
(Data source: CISA)
2. Iron ore consumption in China
(1) The demand for iron ore in China is increasing year by year
Iron and steel enterprises are the final consumers of iron ore, and the distribution of iron and steel production capacity determines the pattern of iron ore consumption. According to the situation over the years, the demand for iron ore in China has gradually increased. In 2008, China's pig iron output was 469 million tons, and the demand for iron ore was about 750 million tons. By 2009, the output of pig iron had risen to 544 million tons, and the demand for iron ore was about 870 million tons, up 15.9% year on year. China's iron ore production has also been rising with the increase in consumption. However, after entering 2010, the growth rate of iron ore consumption in China has slowed down significantly. On the one hand, the limited steel production capacity has compressed the demand for iron ore; On the other hand, the rising price of iron ore has also led to increased risk of stockpiling and speculation of iron ore, which has curbed speculative demand.
Trend of China's iron ore demand from 2001 to 2012
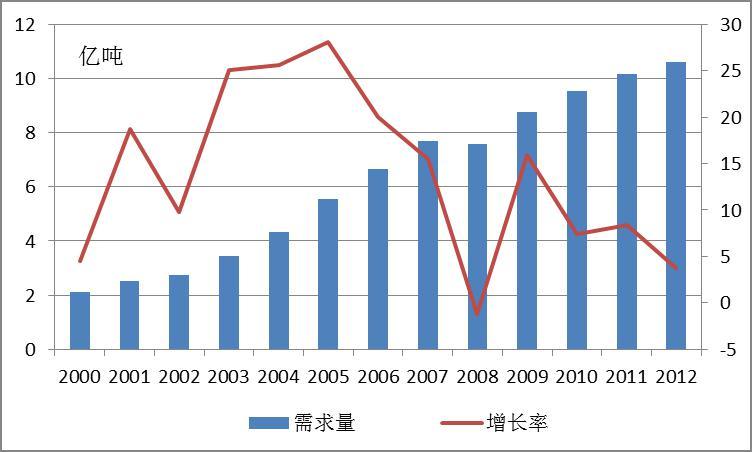
(Source: China Metallurgical Mining Enterprises Association)
(2) China's iron ore demand is relatively concentrated
In terms of pig iron output, Hebei Province has a large pig iron output. In 2012, the iron and steel output of Hebei Province exceeded 100 million tons, and the pig iron output of Shandong, Liaoning and Jiangsu Province exceeded 50 million tons in the past two years. These provinces are the main demand provinces for iron ore.
In terms of the proportion of provinces and cities, the proportion of pig iron output in Hebei, Shandong, Liaoning, Jiangsu, Shanxi, Hubei, and Henan has been basically stable in the past five years, with little change in the proportion. The total proportion of other provinces and cities has decreased by 1%. From the overall proportion, the top seven provinces and cities in pig iron production accounted for about 64% of the total, indicating that China's iron ore demand is also relatively concentrated.
(3) Iron ore demand is concentrated in the Bohai Rim region
From the regional perspective, the output of pig iron in the Bohai Rim region is 296 million tons, accounting for 45.1% of the total national output; The output of pig iron in the Yangtze River Delta region is close to 100 million tons, accounting for 16.1% of the total output, ranking second, but only about 1/3 of that in the Bohai Rim region; Other regions in North China and Central South China also account for more than 10% of the total. In the northwest, coastal areas in South China and southwest regions, the pig iron output is low, less than 10%. In terms of demand regions, the demand for iron ore is also concentrated in the Bohai Rim region.
Table 5 Pig Iron Output in Different Regions of China in 2012
| region |
Output (100 million tons) |
Proportion in the whole country (%) |
| Bohai Rim |
two point nine six |
forty-five point zero seven |
| Yangtze River Delta |
one point zero six |
16.12 |
| South China coastal area |
zero point two nine |
4.36 |
| Other regions in North China |
zero point seven zero |
ten point six four |
| Other regions in south central China |
zero point eight three |
twelve point five five |
| Southwest China |
zero point four three |
six point five seven |
| Northwest China |
zero point three one |
four point seven zero |
(Data source: Steel House)
(4) Significant increase in output of key steel plants
As can be seen from the figure below, during the "Eleventh Five Year Plan" period, the output of the top ten steel enterprises in China has significantly increased in the proportion of total output, from less than 35% in 2006 to 48.26% in 2010, an increase of more than 13 percentage points. The concentration of China's steel industry has increased, indicating that the government's policies to regulate the steel industry have been effective.
