-
nuscenes_tutorial.ipynb -
nuscenes_lidarseg_panoptic_tutorial.ipynb -
nuimages_tutorial.ipynb -
can_bus_tutorial.ipynb -
map_expansion_tutorial.ipynb -
prediction_tutorial.ipynb
background
preparation
# ! mkdir -p /data/sets/nuscenes # Make the directory to store the nuScenes dataset in. # ! wget https://www.nuscenes.org/data/v1.0-mini.tgz # Download the nuScenes mini split. # ! wget https://www.nuscenes.org/data/nuScenes-lidarseg-mini-v1.0.tar.bz2 # Download the nuScenes-lidarseg mini split. # ! tar -xf v1.0-mini.tgz -C /data/sets/nuscenes # Uncompress the nuScenes mini split. # ! tar -xf nuScenes-lidarseg-mini-v1.0.tar.bz2 -C /data/sets/nuscenes # Uncompress the nuScenes-lidarseg mini split. # ! pip install nuscenes-devkit &> /dev/null # Install nuScenes.
# ! wget https://www.nuscenes.org/data/v1.0-mini.tgz # Download the nuScenes mini split. # ! wget https://www.nuscenes.org/data/nuScenes-panoptic-v1.0-mini.tar.gz # Download the Panoptic nuScenes mini split. # ! tar -xf v1.0-mini.tgz -C /data/sets/nuscenes # Uncompress the nuScenes mini split. # ! tar -xf nuScenes-panoptic-v1.0-mini.tar.gz -C /data/sets/nuscenes # Uncompress the Panoptic nuScenes mini split.
-
In lidarseg and panoptic packages v1.0-mini The content of should also be placed in the previous Full dataset mini package v1.0-mini 。 -
In lidarseg and panoptic packages category.json It's the same, category.json The contents in the full dataset mini package include category.json , can be directional overlay.
ls -1 ./ lidarseg maps panoptic samples sweeps v1.0-mini cd v1.0-mini && ls -1 ./ attribute.json calibrated_sensor.json category.json ego_pose.json instance.json lidarseg.json log.json map.json panoptic.json sample.json sample_annotation.json sample_data.json scene.json sensor.json visibility.json Reading Datasets
get ready
pip install nuscenes-devkit %matplotlib inline from nuscenes import NuScenes nusc = NuScenes(version='v1.0-mini', dataroot='/Users/lau/data_sets/v1.0-mini', verbose=True) #Output results ====== Loading NuScenes tables for version v1.0-mini... Loading nuScenes-lidarseg... Loading nuScenes-panoptic... 32 category, 8 attribute, 4 visibility, 911 instance, 12 sensor, 120 calibrated_sensor, 31206 ego_pose, 8 log, 10 scene, 404 sample, 31206 sample_data, 18538 sample_annotation, 4 map, 404 lidarseg, 404 panoptic, Done loading in 0.905 seconds. ====== Reverse indexing ... Done reverse indexing in 0.1 seconds. ======
Point statistics
# nuscenes-lidarseg nusc.list_lidarseg_categories(sort_by='count') #Output results Calculating semantic point stats for nuScenes-lidarseg... one animal nbr_points= 0 seven human.pedestrian.stroller nbr_points= 0 eight human.pedestrian.wheelchair nbr_points= 0 nineteen vehicle.emergency.ambulance nbr_points= 0 twenty vehicle.emergency.police nbr_points= 0 ten movable_object.debris nbr_points= 48 six human.pedestrian.police_officer nbr_points= 64 three human.pedestrian.child nbr_points= 230 four human.pedestrian.construction_worker nbr_points= 1,412 fourteen vehicle.bicycle nbr_points= 1,463 eleven movable_object.pushable_pullable nbr_points= 2,293 five human.pedestrian.personal_mobility nbr_points= 4,096 thirteen static_object.bicycle_rack nbr_points= 4,476 twelve movable_object.trafficcone nbr_points= 6,206 twenty-one vehicle.motorcycle nbr_points= 6,713 zero noise nbr_points= 12,561 twenty-two vehicle.trailer nbr_points= 12,787 twenty-nine static.other nbr_points= 16,710 sixteen vehicle.bus.rigid nbr_points= 29,694 eighteen vehicle.construction nbr_points= 39,300 fifteen vehicle.bus.bendy nbr_points= 40,536 two human.pedestrian.adult nbr_points= 43,812 nine movable_object.barrier nbr_points= 55,298 twenty-five flat.other nbr_points= 150,153 twenty-three vehicle.truck nbr_points= 304,234 seventeen vehicle.car nbr_points= 521,237 twenty-seven flat.terrain nbr_points= 696,526 twenty-six flat.sidewalk nbr_points= 746,905 thirty static.vegetation nbr_points= 1,565,272 twenty-eight static.manmade nbr_points= 2,067,585 thirty-one vehicle.ego nbr_points= 3,626,718 twenty-four flat.driveable_surface nbr_points= 4,069,879 Calculated stats for 404 point clouds in 0.6 seconds, total 14026208 points. =====
nusc.lidarseg_idx2name_mapping #Output results {0: 'noise', 1: 'animal', 2: 'human.pedestrian.adult', 3: 'human.pedestrian.child', 4: 'human.pedestrian.construction_worker', 5: 'human.pedestrian.personal_mobility', 6: 'human.pedestrian.police_officer', 7: 'human.pedestrian.stroller', 8: 'human.pedestrian.wheelchair', 9: 'movable_object.barrier', 10: 'movable_object.debris', 11: 'movable_object.pushable_pullable', 12: 'movable_object.trafficcone', 13: 'static_object.bicycle_rack', 14: 'vehicle.bicycle', 15: 'vehicle.bus.bendy', 16: 'vehicle.bus.rigid', 17: 'vehicle.car', 18: 'vehicle.construction', 19: 'vehicle.emergency.ambulance', 20: 'vehicle.emergency.police', 21: 'vehicle.motorcycle', 22: 'vehicle.trailer', 23: 'vehicle.truck', 24: 'flat.driveable_surface', 25: 'flat.other', 26: 'flat.sidewalk', 27: 'flat.terrain', 28: 'static.manmade', 29: 'static.other', 30: 'static.vegetation', 31: 'vehicle.ego'}
nusc.lidarseg_name2idx_mapping #Output results {'noise': 0, 'animal': 1, 'human.pedestrian.adult': 2, 'human.pedestrian.child': 3, 'human.pedestrian.construction_worker': 4, 'human.pedestrian.personal_mobility': 5, 'human.pedestrian.police_officer': 6, 'human.pedestrian.stroller': 7, 'human.pedestrian.wheelchair': 8, 'movable_object.barrier': 9, 'movable_object.debris': 10, 'movable_object.pushable_pullable': 11, 'movable_object.trafficcone': 12, 'static_object.bicycle_rack': 13, 'vehicle.bicycle': 14, 'vehicle.bus.bendy': 15, 'vehicle.bus.rigid': 16, 'vehicle.car': 17, 'vehicle.construction': 18, 'vehicle.emergency.ambulance': 19, 'vehicle.emergency.police': 20, 'vehicle.motorcycle': 21, 'vehicle.trailer': 22, 'vehicle.truck': 23, 'flat.driveable_surface': 24, 'flat.other': 25, 'flat.sidewalk': 26, 'flat.terrain': 27, 'static.manmade': 28, 'static.other': 29, 'static.vegetation': 30, 'vehicle.ego': 31}
# Panoptic nuScenes nusc.list_lidarseg_categories(sort_by='count', gt_from='panoptic') #Output results Calculating semantic point stats for nuScenes-panoptic... one animal nbr_points= 0 seven human.pedestrian.stroller nbr_points= 0 eight human.pedestrian.wheelchair nbr_points= 0 nineteen vehicle.emergency.ambulance nbr_points= 0 twenty vehicle.emergency.police nbr_points= 0 ten movable_object.debris nbr_points= 47 six human.pedestrian.police_officer nbr_points= 56 three human.pedestrian.child nbr_points= 213 eleven movable_object.pushable_pullable nbr_points= 756 fourteen vehicle.bicycle nbr_points= 1,355 four human.pedestrian.construction_worker nbr_points= 1,365 thirteen static_object.bicycle_rack nbr_points= 3,160 five human.pedestrian.personal_mobility nbr_points= 3,424 twelve movable_object.trafficcone nbr_points= 5,433 twenty-one vehicle.motorcycle nbr_points= 6,479 twenty-two vehicle.trailer nbr_points= 12,621 twenty-nine static.other nbr_points= 16,710 sixteen vehicle.bus.rigid nbr_points= 29,102 eighteen vehicle.construction nbr_points= 30,174 fifteen vehicle.bus.bendy nbr_points= 39,080 two human.pedestrian.adult nbr_points= 41,629 nine movable_object.barrier nbr_points= 51,012 zero noise nbr_points= 59,608 twenty-five flat.other nbr_points= 150,153 twenty-three vehicle.truck nbr_points= 299,530 seventeen vehicle.car nbr_points= 501,416 twenty-seven flat.terrain nbr_points= 696,526 twenty-six flat.sidewalk nbr_points= 746,905 thirty static.vegetation nbr_points= 1,565,272 twenty-eight static.manmade nbr_points= 2,067,585 thirty-one vehicle.ego nbr_points= 3,626,718 twenty-four flat.driveable_surface nbr_points= 4,069,879 Calculated stats for 404 point clouds in 0.8 seconds, total 14026208 points. =====
Statistics of panoptic instances
nusc.list_panoptic_instances(sort_by='count') #Output results Calculating instance stats for nuScenes-panoptic ... Per-frame number of instances: 35±23 Per-category instance stats: vehicle.car: 372 instances, each instance spans to 15±10 frames, with 92±288 points human.pedestrian.adult: 212 instances, each instance spans to 19±10 frames, with 10±19 points movable_object.trafficcone: 102 instances, each instance spans to 8±7 frames, with 7±18 points movable_object.barrier: 89 instances, each instance spans to 20±12 frames, with 29±72 points vehicle.truck: 25 instances, each instance spans to 21±13 frames, with 564±1770 points vehicle.motorcycle: 17 instances, each instance spans to 20±9 frames, with 19±38 points vehicle.bicycle: 15 instances, each instance spans to 13±8 frames, with 7±13 points vehicle.bus.rigid: 13 instances, each instance spans to 24±11 frames, with 94±167 points human.pedestrian.construction_worker: 8 instances, each instance spans to 19±9 frames, with 9±15 points vehicle.construction: 6 instances, each instance spans to 27±11 frames, with 185±306 points human.pedestrian.child: 4 instances, each instance spans to 11±9 frames, with 5±4 points movable_object.pushable_pullable: 3 instances, each instance spans to 23±11 frames, with 11±16 points static_object.bicycle_rack: 2 instances, each instance spans to 20±6 frames, with 81±136 points vehicle.bus.bendy: 2 instances, each instance spans to 28±9 frames, with 698±1582 points vehicle.trailer: 2 instances, each instance spans to 29±12 frames, with 218±124 points human.pedestrian.personal_mobility: 1 instances, each instance spans to 25±0 frames, with 137±149 points human.pedestrian.police_officer: 1 instances, each instance spans to 10±0 frames, with 6±4 points movable_object.debris: 1 instances, each instance spans to 13±0 frames, with 4±2 points animal: 0 instances, each instance spans to 0±0 frames, with 0±0 points human.pedestrian.stroller: 0 instances, each instance spans to 0±0 frames, with 0±0 points human.pedestrian.wheelchair: 0 instances, each instance spans to 0±0 frames, with 0±0 points vehicle.emergency.ambulance: 0 instances, each instance spans to 0±0 frames, with 0±0 points vehicle.emergency.police: 0 instances, each instance spans to 0±0 frames, with 0±0 points Calculated stats for 404 point clouds in 1.5 seconds, total 875 instances, 14072 sample annotations. ===== Statistic lidarseg/panoptic
my_sample = nusc.sample[87] my_sample #Output results {'token': '6dabc0fb1df045558f802246dd186b3f', 'timestamp': 1535489300046941, 'prev': 'b7f64f73e8a548488e6d85d9b0e13242', 'next': '82597244941b4e79aa3e1e9cc6386f8b', 'scene_token': '6f83169d067343658251f72e1dd17dbc', 'data': {'RADAR_FRONT': '020ecc01ab674ebabd3efbeb651800a8', 'RADAR_FRONT_LEFT': '8608ece15310417183a4ce928acc9d92', 'RADAR_FRONT_RIGHT': '7900c7855d7f41e99c047b08fac73f07', 'RADAR_BACK_LEFT': 'e7fa0148f1554603b19ce1c2f98dd629', 'RADAR_BACK_RIGHT': '7c1c8f579be9458fa5ac2f48d001ecf3', 'LIDAR_TOP': 'd219ffa9b4ce492c8b8059db9d8b3166', 'CAM_FRONT': '435543e1321b411ea5c930633e0883d9', 'CAM_FRONT_RIGHT': '12ed78f3bf934630a952f3259861877a', 'CAM_BACK_RIGHT': '3486d5847c244722a8ed7d943d8b9200', 'CAM_BACK': '365e64003ab743b3ae9ffc7ddb68872f', 'CAM_BACK_LEFT': '20a0bc8f862d456b8bf27be30dbbb8dc', 'CAM_FRONT_LEFT': '31ff0404d9d941d7870f9942180f67c7'}, 'anns': ['cc2956dbf55b4e8cb65e61189266f14f', '4843546cff85496894aa43d04362c435', ... '0629ad31311f4a5ab1338c8ac929d109']}
# nuscenes-lidarseg nusc.get_sample_lidarseg_stats(my_sample['token'], sort_by='count') #Output results ===== Statistics for 6dabc0fb1df045558f802246dd186b3f ===== fourteen vehicle.bicycle n= 9 eleven movable_object.pushable_pullable n= 11 zero noise n= 62 two human.pedestrian.adult n= 71 sixteen vehicle.bus.rigid n= 105 nine movable_object.barrier n= 280 twenty-two vehicle.trailer n= 302 thirty static.vegetation n= 330 twenty-three vehicle.truck n= 1,229 twenty-six flat.sidewalk n= 1,310 twenty-five flat.other n= 1,495 seventeen vehicle.car n= 3,291 twenty-eight static.manmade n= 4,650 twenty-four flat.driveable_surface n= 9,884 thirty-one vehicle.ego n= 11,723 ===========================================================
# Panoptic nuScenes nusc.get_sample_lidarseg_stats(my_sample['token'], sort_by='count', gt_from='panoptic') #Output results ===== Statistics for 6dabc0fb1df045558f802246dd186b3f ===== eleven movable_object.pushable_pullable n= 9 fourteen vehicle.bicycle n= 9 two human.pedestrian.adult n= 62 sixteen vehicle.bus.rigid n= 103 zero noise n= 234 nine movable_object.barrier n= 255 twenty-two vehicle.trailer n= 298 thirty static.vegetation n= 330 twenty-three vehicle.truck n= 1,149 twenty-six flat.sidewalk n= 1,310 twenty-five flat.other n= 1,495 seventeen vehicle.car n= 3,241 twenty-eight static.manmade n= 4,650 twenty-four flat.driveable_surface n= 9,884 thirty-one vehicle.ego n= 11,723 =========================================================== Render with lidarseg
sample_data_token = my_sample['data']['LIDAR_TOP'] nusc.render_sample_data(sample_data_token, with_anns=False, show_lidarseg=True) 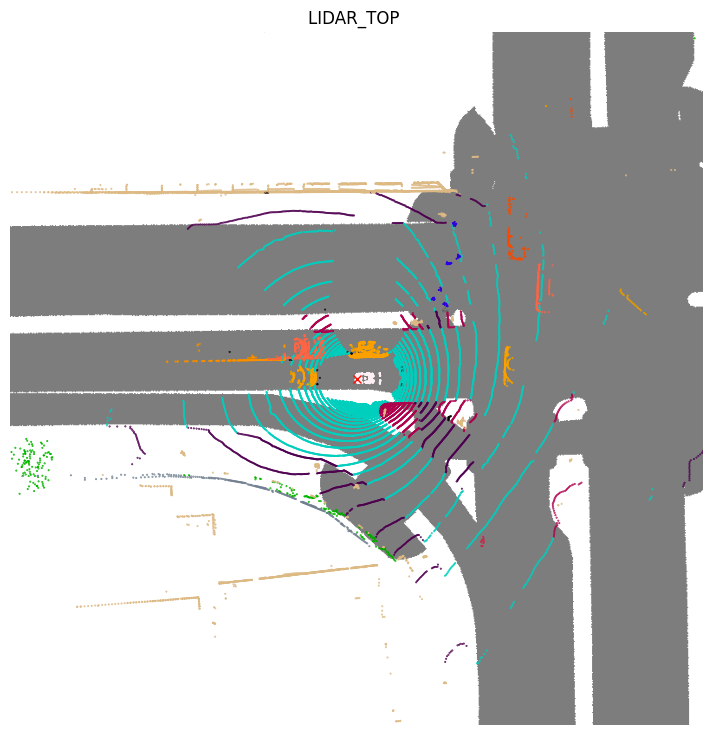
sample_data_token = my_sample['data']['LIDAR_TOP'] nusc.render_sample_data(sample_data_token, with_anns=True, show_lidarseg=True) 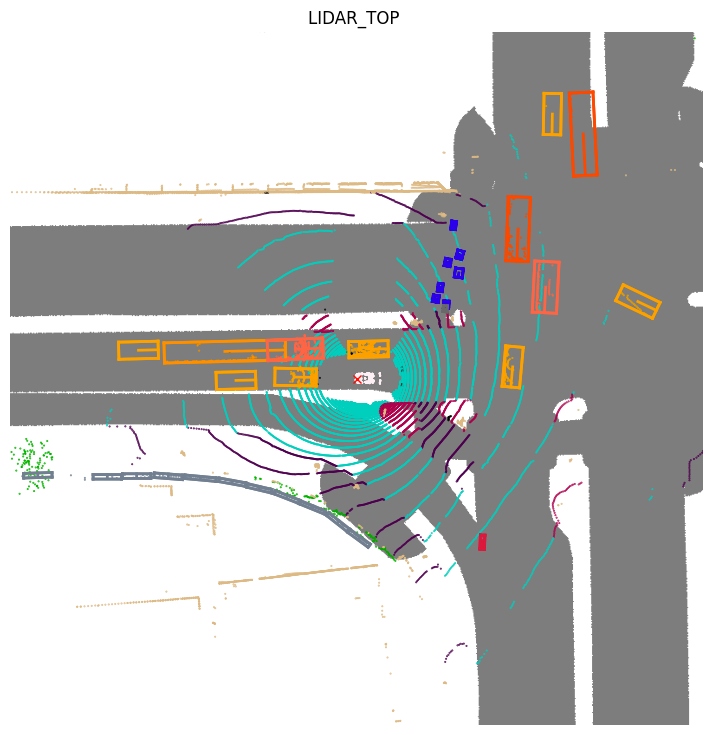
nusc.render_sample_data(sample_data_token, with_anns=False, show_lidarseg=True, filter_lidarseg_labels=[22, 23]) 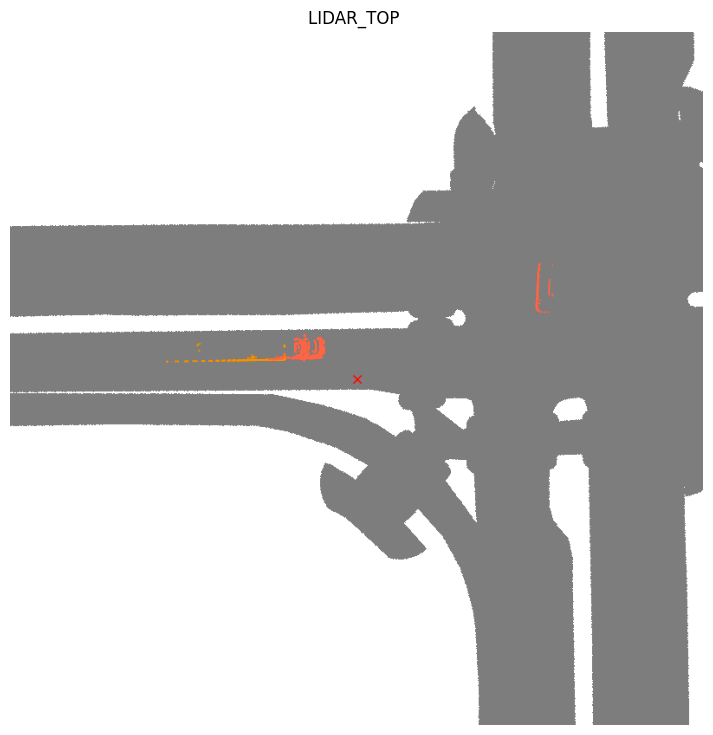
nusc.render_sample_data(sample_data_token, with_anns=False, show_lidarseg=True, show_lidarseg_legend=True) 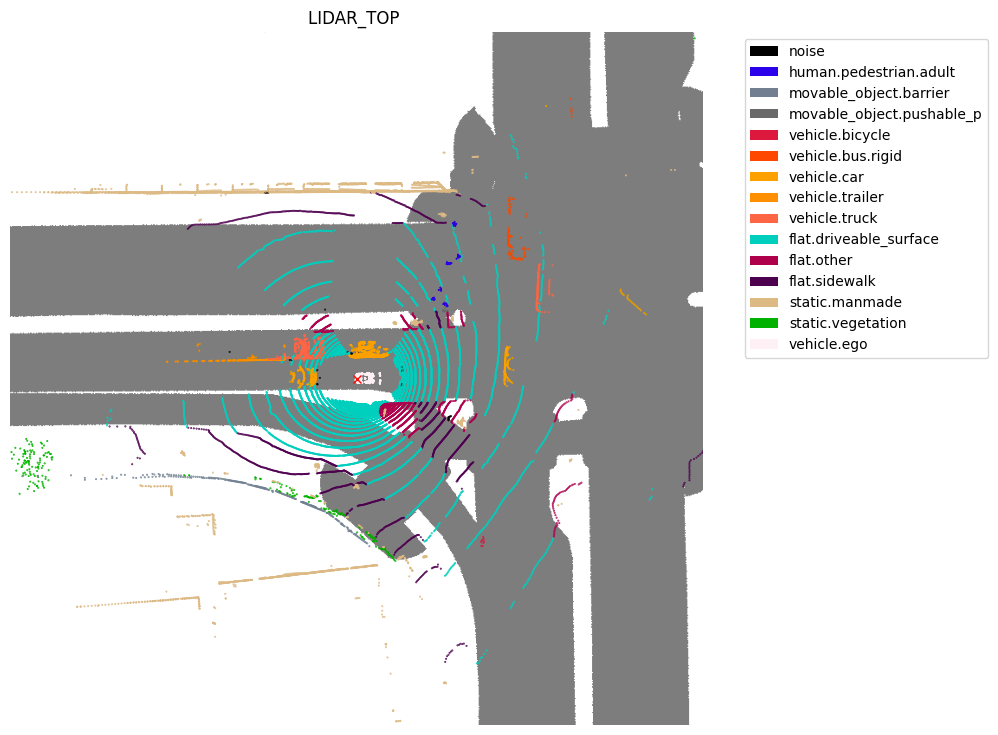
Rendering with panoptic
sample_data_token = my_sample['data']['LIDAR_TOP'] nusc.render_sample_data(sample_data_token, with_anns=False, show_lidarseg=False, show_panoptic=True) 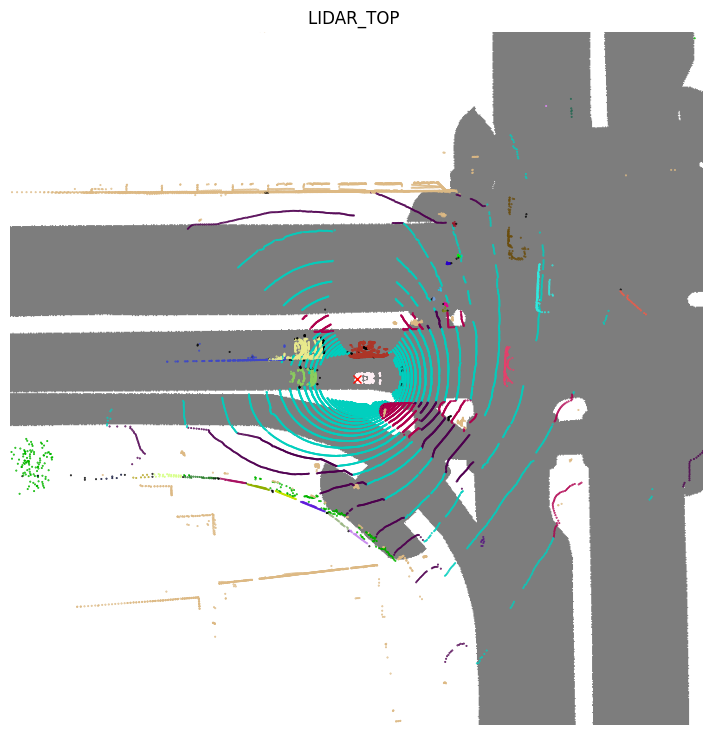
# show trucks, trailers and drivable_surface nusc.render_sample_data(sample_data_token, with_anns=False, show_panoptic=True, filter_lidarseg_labels=[22, 23, 24]) 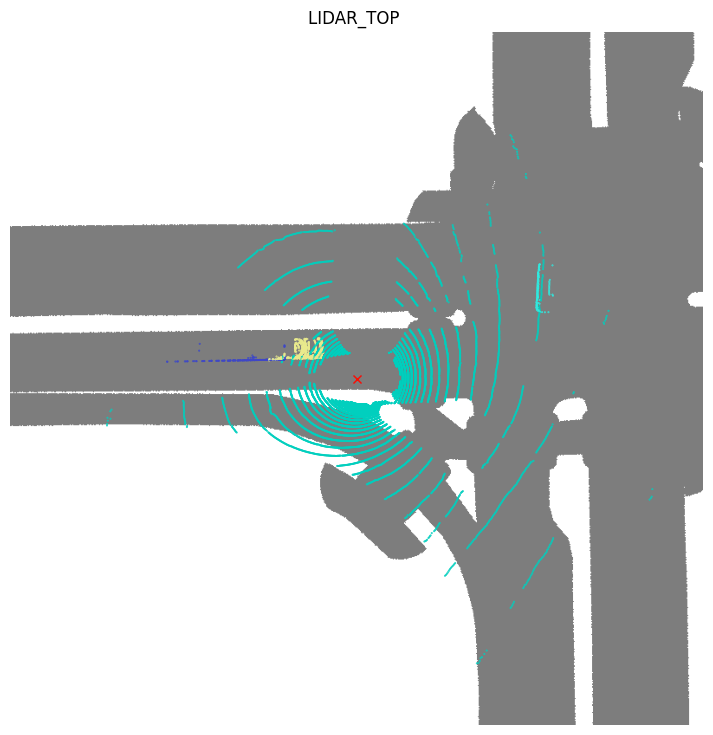
# show stuff category legends nusc.render_sample_data(sample_data_token, with_anns=False, show_lidarseg=False, show_lidarseg_legend=True, show_panoptic=True) 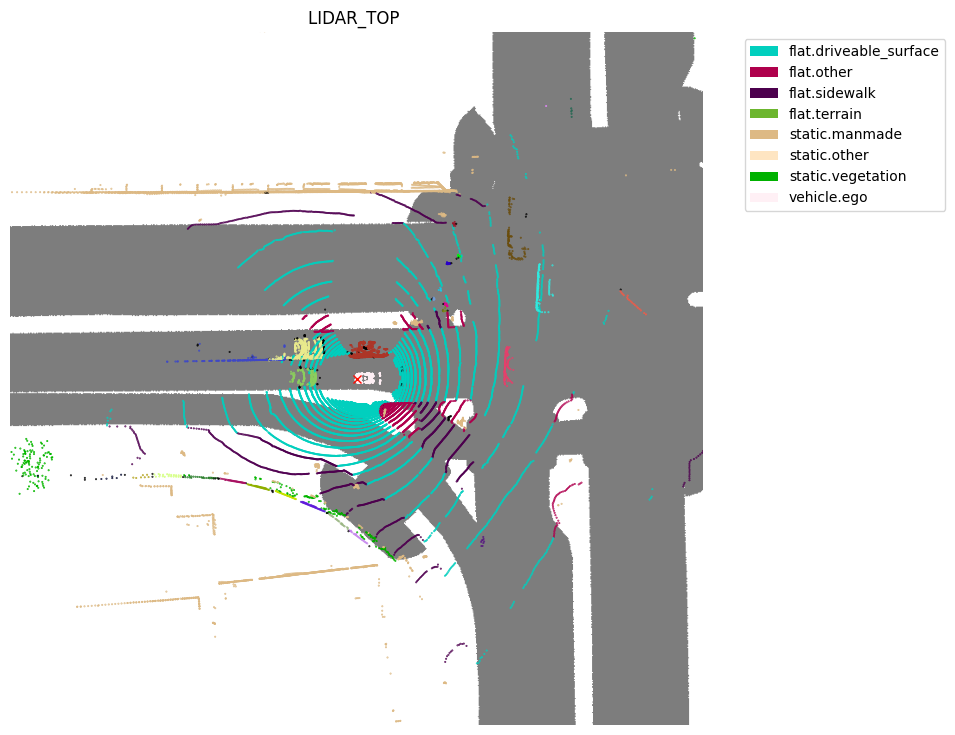
Advanced
Render Image
# nuscenes-lidarseg nusc.render_pointcloud_in_image(my_sample['token'], pointsensor_channel='LIDAR_TOP', camera_channel='CAM_BACK', render_intensity=False, show_lidarseg=True, filter_lidarseg_labels=[22, 23, 24], show_lidarseg_legend=True) 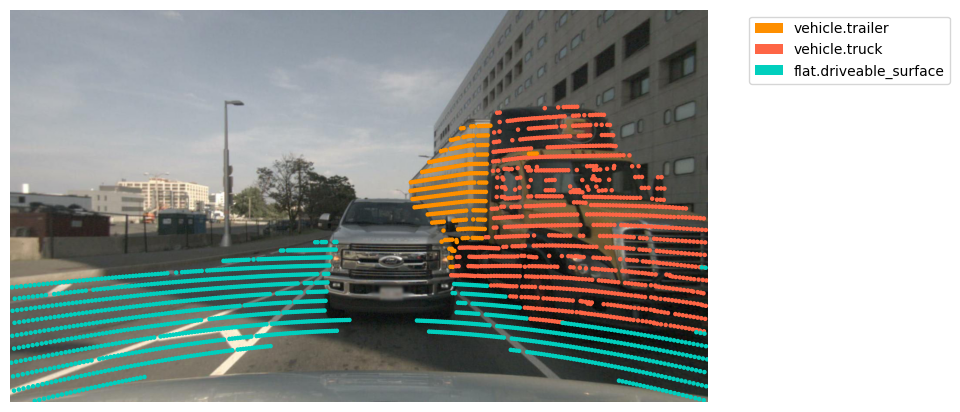
# Panoptic nuScenes nusc.render_pointcloud_in_image(my_sample['token'], pointsensor_channel='LIDAR_TOP', camera_channel='CAM_BACK', render_intensity=False, show_lidarseg=False, filter_lidarseg_labels=[17,22, 23, 24], show_lidarseg_legend=True, show_panoptic=True) 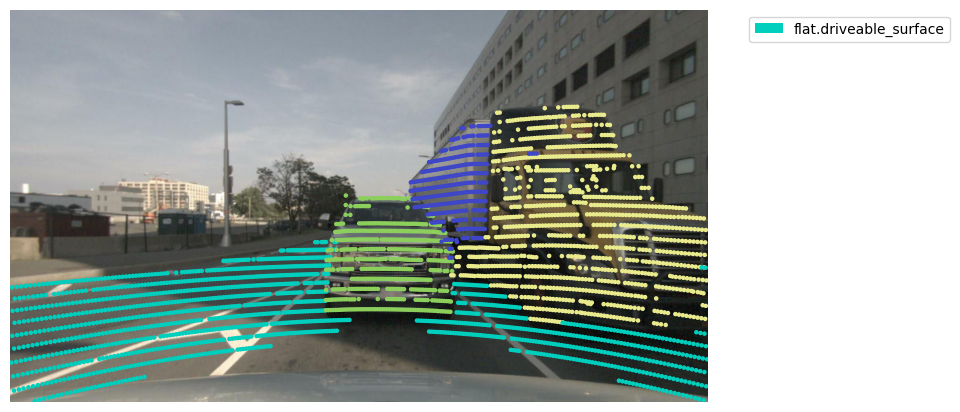
Render sample
# nuscenes-lidarseg nusc.render_sample(my_sample['token'], show_lidarseg=True, filter_lidarseg_labels=[22, 23]) 
# Panoptic nuScenes nusc.render_sample(my_sample['token'], show_lidarseg=False, filter_lidarseg_labels=[17, 23, 24], show_panoptic=True) 
Render a sensor
my_scene = nusc.scene[0] my_scene #Output results {'token': 'cc8c0bf57f984915a77078b10eb33198', 'log_token': '7e25a2c8ea1f41c5b0da1e69ecfa71a2', 'nbr_samples': 39, 'first_sample_token': 'ca9a282c9e77460f8360f564131a8af5', 'last_sample_token': 'ed5fc18c31904f96a8f0dbb99ff069c0', 'name': 'scene-0061', 'description': 'Parked truck, construction, intersection, turn left, following a van'}
# nuscenes-lidarseg import os nusc.render_scene_channel_lidarseg(my_scene['token'], 'CAM_FRONT', filter_lidarseg_labels=[18, 28], verbose=True, dpi=100, imsize=(1280, 720))
# nuscenes-panoptic import os nusc.render_scene_channel_lidarseg(my_scene['token'], 'CAM_BACK', filter_lidarseg_labels=[18, 24, 28], verbose=True, dpi=100, imsize=(1280, 720), show_panoptic=True)
# nuscenes-lidarseg nusc.render_scene_channel_lidarseg(my_scene['token'], 'CAM_BACK', filter_lidarseg_labels=[18, 28], verbose=True, dpi=100, imsize=(1280, 720), render_mode='video', out_folder=os.path.expanduser('video_image')) Render all sensors
# nuscenes-lidarseg nusc.render_scene_lidarseg(my_scene['token'], filter_lidarseg_labels=[17, 24], verbose=True, dpi=100) 
# Panoptic nuScenes nusc.render_scene_lidarseg(my_scene['token'], filter_lidarseg_labels=[17, 24], verbose=True, dpi=100, show_panoptic=True) 
Render LiDAR segmentation prediction
import os my_sample = nusc.sample[87] sample_data_token = my_sample['data']['LIDAR_TOP'] my_predictions_bin_file = os.path.join('/Users/lau/data_sets/v1.0-mini/lidarseg/v1.0-mini', sample_data_token + '_lidarseg.bin') nusc.render_pointcloud_in_image(my_sample['token'], pointsensor_channel='LIDAR_TOP', camera_channel='CAM_BACK', render_intensity=False, show_lidarseg=True, filter_lidarseg_labels=[22, 23], show_lidarseg_legend=True, lidarseg_preds_bin_path=my_predictions_bin_file) 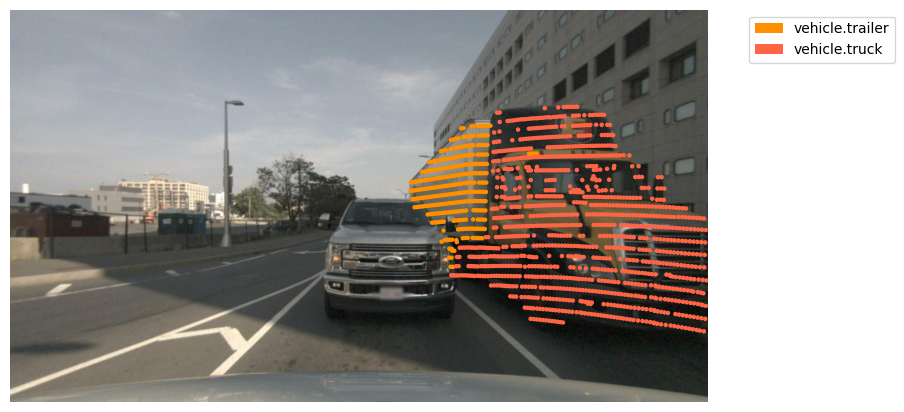
render_scene_channel_lidarseg render_scene_lidarseg
my_scene = nusc.scene[0] my_folder_of_predictions = '/Users/lau/data_sets/v1.0-mini/lidarseg/v1.0-mini' nusc.render_scene_channel_lidarseg(my_scene['token'], 'CAM_BACK', filter_lidarseg_labels=[17, 24], verbose=True, imsize=(1280, 720), lidarseg_preds_folder=my_folder_of_predictions) Render LiDAR panoramic prediction
import os my_sample = nusc.sample[87] sample_data_token = my_sample['data']['LIDAR_TOP'] my_predictions_bin_file = os.path.join('/Users/lau/data_sets/v1.0-mini/panoptic/v1.0-mini', sample_data_token + '_panoptic.npz') nusc.render_pointcloud_in_image(my_sample['token'], pointsensor_channel='LIDAR_TOP', camera_channel='CAM_BACK', render_intensity=False, show_lidarseg=False, filter_lidarseg_labels=[17,22, 23, 24], show_lidarseg_legend=True, lidarseg_preds_bin_path=my_predictions_bin_file, show_panoptic=True) 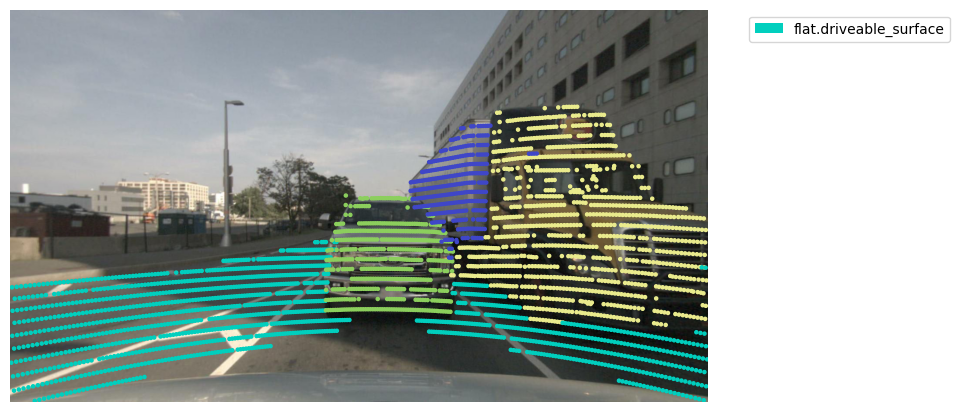
render_scene_channel_lidarseg render_scene_lidarseg
my_scene = nusc.scene[0] my_folder_of_predictions = '/Users/lau/data_sets/v1.0-mini/panoptic/v1.0-mini' nusc.render_scene_channel_lidarseg(my_scene['token'], 'CAM_BACK', filter_lidarseg_labels=[9, 18, 24, 28], verbose=True, imsize=(1280, 720), lidarseg_preds_folder=my_folder_of_predictions, show_panoptic=True) reference resources
-
https://colab.research.google.com/github/nutonomy/nuscenes-devkit/blob/master/python-sdk/tutorials/nuscenes_lidarseg_panoptic_tutorial.ipynb -
https://github.com/nutonomy/nuscenes-devkit/blob/master/docs/instructions_lidarseg.md -
https://zhuanlan.zhihu.com/p/550677537
