There are three current limiting modules in ngnix:

  • Limit_conn limits the number of TCP connections for an IP or the total number of connections for a server (website)
  • Limit_rate The current data size of each request
  • Limit_req limits the number of requests for an IP

The third one has the most obvious effect limit_req , but in the pagoda panel Flow limit Only the previous two configurations are available, so traffic restriction is useless.

The difference between the number of tcp connections and the number of requests

TCP connection establishment requires three handshakes, which is time-consuming. Just like making a phone call, the two parties can communicate (request resources) only after making a phone call. Naturally, the fewer TCP links, the better.

How many TCP connections will be made when visiting a website?

If your site is http1.1, the number of connections=the number of requests/<the number of concurrent allowed by the browser>
If your site is http2.0, the number of connections=1

Http 1.1 enables the keep alive feature by default and supports tcp persistent connections. However, because the browser limits the number of concurrent connections, there are too many connections, and a second tcp connection will still be made. one Please refer to the "Number of Concurrencies Allowed by the Browser" What is the meaning of the number of concurrent requests allowed by the browser- Answer from Wang Nano

Http2 introduces multiplexing and binary frame layering features, allowing all requests to come from the same tcp. You can write the advantages of http2 in detail when you have time later.

It should be noted that http2.0 is only applicable to https sites, two And needs to be configured on the server side three
Http sites still use the http 1.1 protocol.

The following is an example of configuring http2 in the nginx configuration configuration file:

 server { listen 80; listen 443 ssl http2; }
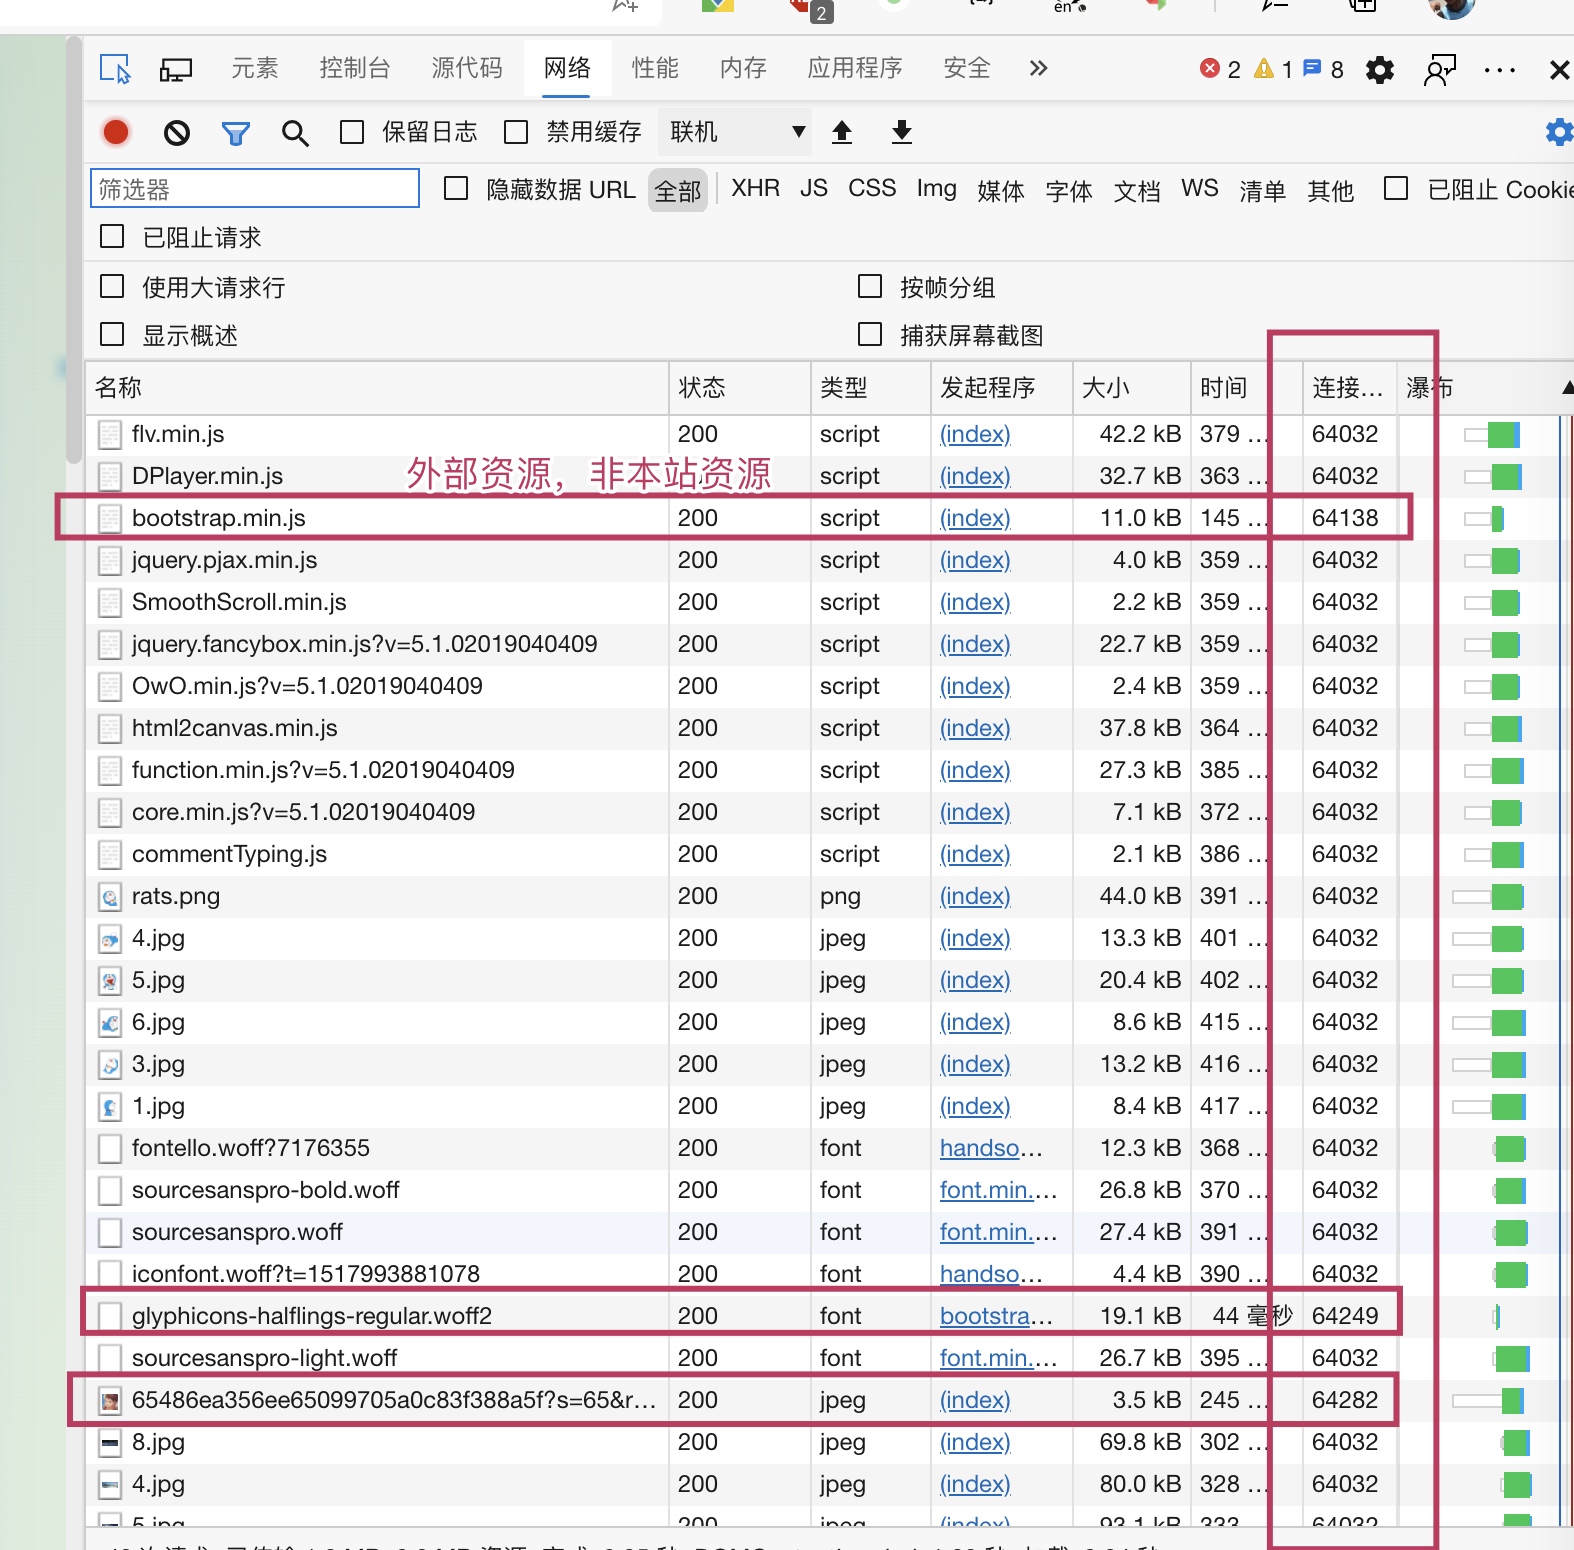
In the chrome control panel, you can see the ID of the TCP connection established by the current website. After using http2, in addition to external resources, only one TCP link is established for the request of local resources.

 15986699997354.jpg

On your own server, you can also use the following command to view the TCP connection:

 netstat -anlp|grep tcp|awk '{print $5}'|awk -F: '{print $1}'|sort|uniq -c|sort -nr|head -n20 ;

netstat -anlp It is a command for Linux to view the network situation. The filter only displays the TCP related ones, but the TCP connection of the entire server is displayed here, not just a website.


The number of requests is the request number you see in the chrome panel. Of course, if it is not your own site, the number of requests for resources will not occupy the bandwidth resources of your server.


Conclusion: If you are an https site and configured with http2, that tcp connection is about equal to a real person
A real person will generate many requests.

Limit_req module

The limit_req module is used to limit the number of requests for an IP.

Configure in the http field of nginx:

 limit_req_zone $binary_remote_addr zone=www_sym:10m rate=20r/s;

Configure in the server field of a website, or in the location field below:

 limit_req zone=www_sym burst=20 nodelay;

There are several variables that need to be explained:

  • zone : Behind www_sym It is the name of the domain, and you can choose any one. The following correspondence is OK. The 10m after the colon indicates the size of the domain, that is, the module needs to open a memory space to cache the request record of nginx $binary_remote_addr To match whether the request rate exceeds the specified rate
  • rate : This is the number of requests allowed in 1 second, This place is easily misunderstood and leads to configuration errors. For example, the rate is set to 20r/s That is, only one request is allowed in the range of 0-50ms, because nginx is a millisecond rate control, and the rate here is actually a millisecond constant rate control But in fact, our site's requests are all burst traffic, that is, many requests are concurrent in a short time. So we need to use burst To receive burst traffic.
  • burst : It can be understood as a buffer queue. Assume that the value is 20. Assume that there are 21 requests in 0~50ms, then 20 of them will enter the queue.
  • nodelay This parameter is also easily misunderstood No delay means no delay. Taking the above example as an example, after 20 requests enter the cache queue, they will be immediately forwarded to nginx to request data and returned after obtaining the data. Note that the position (slot) is not released immediately after a request is out of the queue. It is also released at an interval of 50ms (rate is set to 20r/s) That is to say, if 21 requests are sent during 51~100ms, only 2 requests can be returned successfully (because only one slot is released), and the remaining 19 requests will immediately return 503 error codes.

That is, if the above configuration is followed (rate+burst+nodelay is configured at the same time), 21 burst concurrent requests can be processed normally at any time between 0 and 1000ms. If the number of requests is greater than 21, a 503 error code will be directly returned, telling the client that nginx cannot process the request currently.

It is strongly recommended to set the nodelay parameter, or not set it, so that 20 requests will not be forwarded immediately after entering the buffer queue, but will be requested and responded to at an interval of 50ms (at this time, the location of the buffer queue will also be released at this interval) * *, then the client will receive all 21 request responses at least 1s later, and this delay will be greatly increased, It is very undesirable.

If the burst parameter is not set, it is not suitable for our burst request applications. 20 of the 21 requests will directly return 503, which causes the problem that the resources of the site cannot be loaded.

For more in-depth study of this part, please refer to the following articles:

Configure the following settings in the http field to record the content of the superflow in error.log.

 limit_req_log_level error;

The log of a certain superflow is as follows:

 2020/08/25 18:09:49 [error] 10215#0: *2445032 limiting requests, excess: 10.700 by zone "www_sym", client: 120.*.3*.29, server: ***.com, request: "GET /RelatedObjectLookups.js HTTP/2.0", host: "***.com", referrer: "https://***/admin"

If the website is a reverse proxy, when the upstream website cannot be accessed, the log is as follows:

 2022/04/24 20:44:50 [error] 12985#0: *9662214 upstream timed out (110: Connection timed out) while connecting to upstream, client: 111.27.24.183, server: auth.ihewro.com, request: "GET /notice/version HTTP/2.0", upstream: "http://*****:8000/notice/version", host: "auth.ihewro.com", referrer: ""

If large-scale IP access causes PHP to fail to establish a socket, the error log is as follows:

 2022/04/24 21:49:21 [error] 12985#0: *9953796 connect() to unix:/tmp/php-cgi-74.sock failed (11: Resource temporarily unavailable) while connecting to upstream, client: 23.12.64.219, server: www.ihewro.com, request: "GET / HTTP/1.1", upstream: " fastcgi://unix:/tmp/php -cgi-74.sock:", host: "www.ihewro.com", referrer: " https://www.ihewro.com "

Limit_conn module

Limit_conn is used to limit the number of TCP connections for an IP or the entire site.

Note that in http/2, every concurrent request is considered as a connection!!! This is very important

Http_limit_conn official document

Configure in the http field:

 limit_conn_zone $binary_remote_addr zone=perip:10m; limit_conn_zone $server_name zone=perserver:10m;

Configure in the server field:

 limit_conn perserver 200; limit_conn perip 20;

Upper middle two hundred Indicates the maximum number of connections to a server site. twenty Indicates the maximum number of connections for an IP.

If your site is configured with http2, the number of tcp connections for a user will not exceed 5 under normal circumstances. It can be configured according to specific requests.

Configure the following settings in the http field to record the content of the superflow in error.log.

 limit_conn_log_level error;

The log of a certain superflow is as follows:

 2020/08/25 18:09:49 [error] 10216#0: *2445033 limiting connections by zone "www_sym", client: 120.2.33.29, server: ***.com, request: "GET /RelatedObjectLookups.js HTTP/2.0", host: "***.com", referrer: "https://***/admin"

Limit_rate module

Configure in the server field:

 limit_rate 512k;

above 512k Indicates restrictions One request The size of does not exceed 512kB.

Use of fail2ban

The fail2ban software, as its name implies, performs ban operations based on the number of matches in the error log. It can be used not only to scan nginx logs, but also to scan any logs. You can customize the filter regular expression to match. Ban operations are not only prohibited by iptabels, but can be processed by user-defined actions.

install

 # CentOS yum install -y fail2ban #Ubuntu uses apt's system sudo apt-get install -y fail2ban

to configure

After installation, enter /etc/fail2ban , you can see the following directories and introduce their functions as follows four

  • Action. d: Operation after meeting the condition of ban
  • Filter. d: filter, which tells fail2ban how to match a line in the log
  • Jail.local: jails are prisons. Configure one or more prisons in the file, define the name of the prison, the list of monitored log files, filers, and the actions that meet the conditions
  • Jail.conf: This is an official example of multiple prisons. You can directly copy the parts you need to jail.local.

use

Edit file, nano /etc/fail2ban/jail.local , add a new prison:

 [nginxcc] enabled  = true filter   = nginx-limit-req logpath  = /www/wwwlogs/***1.com.error.log /www/wwwlogs/***2.com.error.log maxretry = 120 findtime = 60 bantime  = 120000 action   = iptables-allports[name=nginxcc] sendmail-whois-lines[name=nginxcc, dest= ihewro@163.com ]
  • The first nginxcc is the name of the prison
  • The filter uses a filter that comes with fail2ban. The file path is /etc/fail2ban/filter.d/nginx-limit-req.conf
  • Logpath is the list of monitored logs. Here I monitor errorlog instead of access.log, because when the traffic is heavy, The access.log log refreshes quickly, which will result in the fail2ban failing to keep up (previously, it was found that the ban has been dropped, but the log still shows the log matching the access of the IP that has been blocked, which is strange. Theoretically, the matching speed should be very fast, but we don't know why this situation occurs) (so we need to set it well limit_req_log_level and limit_conn_log_level Is error)
  • Findtime=60 maxretry=120 means that if there are 120 times of overflow records for an IP in a 60s period, it will be blocked
  • The unit of bantime is s
  • The action blocking operation is to use the iptables tool. This action, fail2ban, has been written for us. The path is /etc/fail2ban/action.d/iptables-allports.conf

It should also be noted that, /etc/fail2ban/filter.d/nginx-limit-req.conf Only matches limit_req The module current limiting log does not match limit_conn The log of module flow restriction, so we edit the file and add a new regular match. One matching rule is one line. If there are multiple matching rules, it is multiple lines( Official document filter example )。 take failregex The value of is changed to:

 failregex = ^\s*\[[a-z]+\] \d+#\d+: \*\d+ .*, client: <HOST>,

At this point, you can use the following command to test whether your regex can match your log content normally:

 fail2ban-regex /etc/fail2ban/filter.d/test.log /etc/fail2ban/filter.d/nginx-limit-req.conf --print-all-matched
--print-all-matched The parameter is used to display all the matching lines. If this parameter is removed, the overall matching can be displayed.


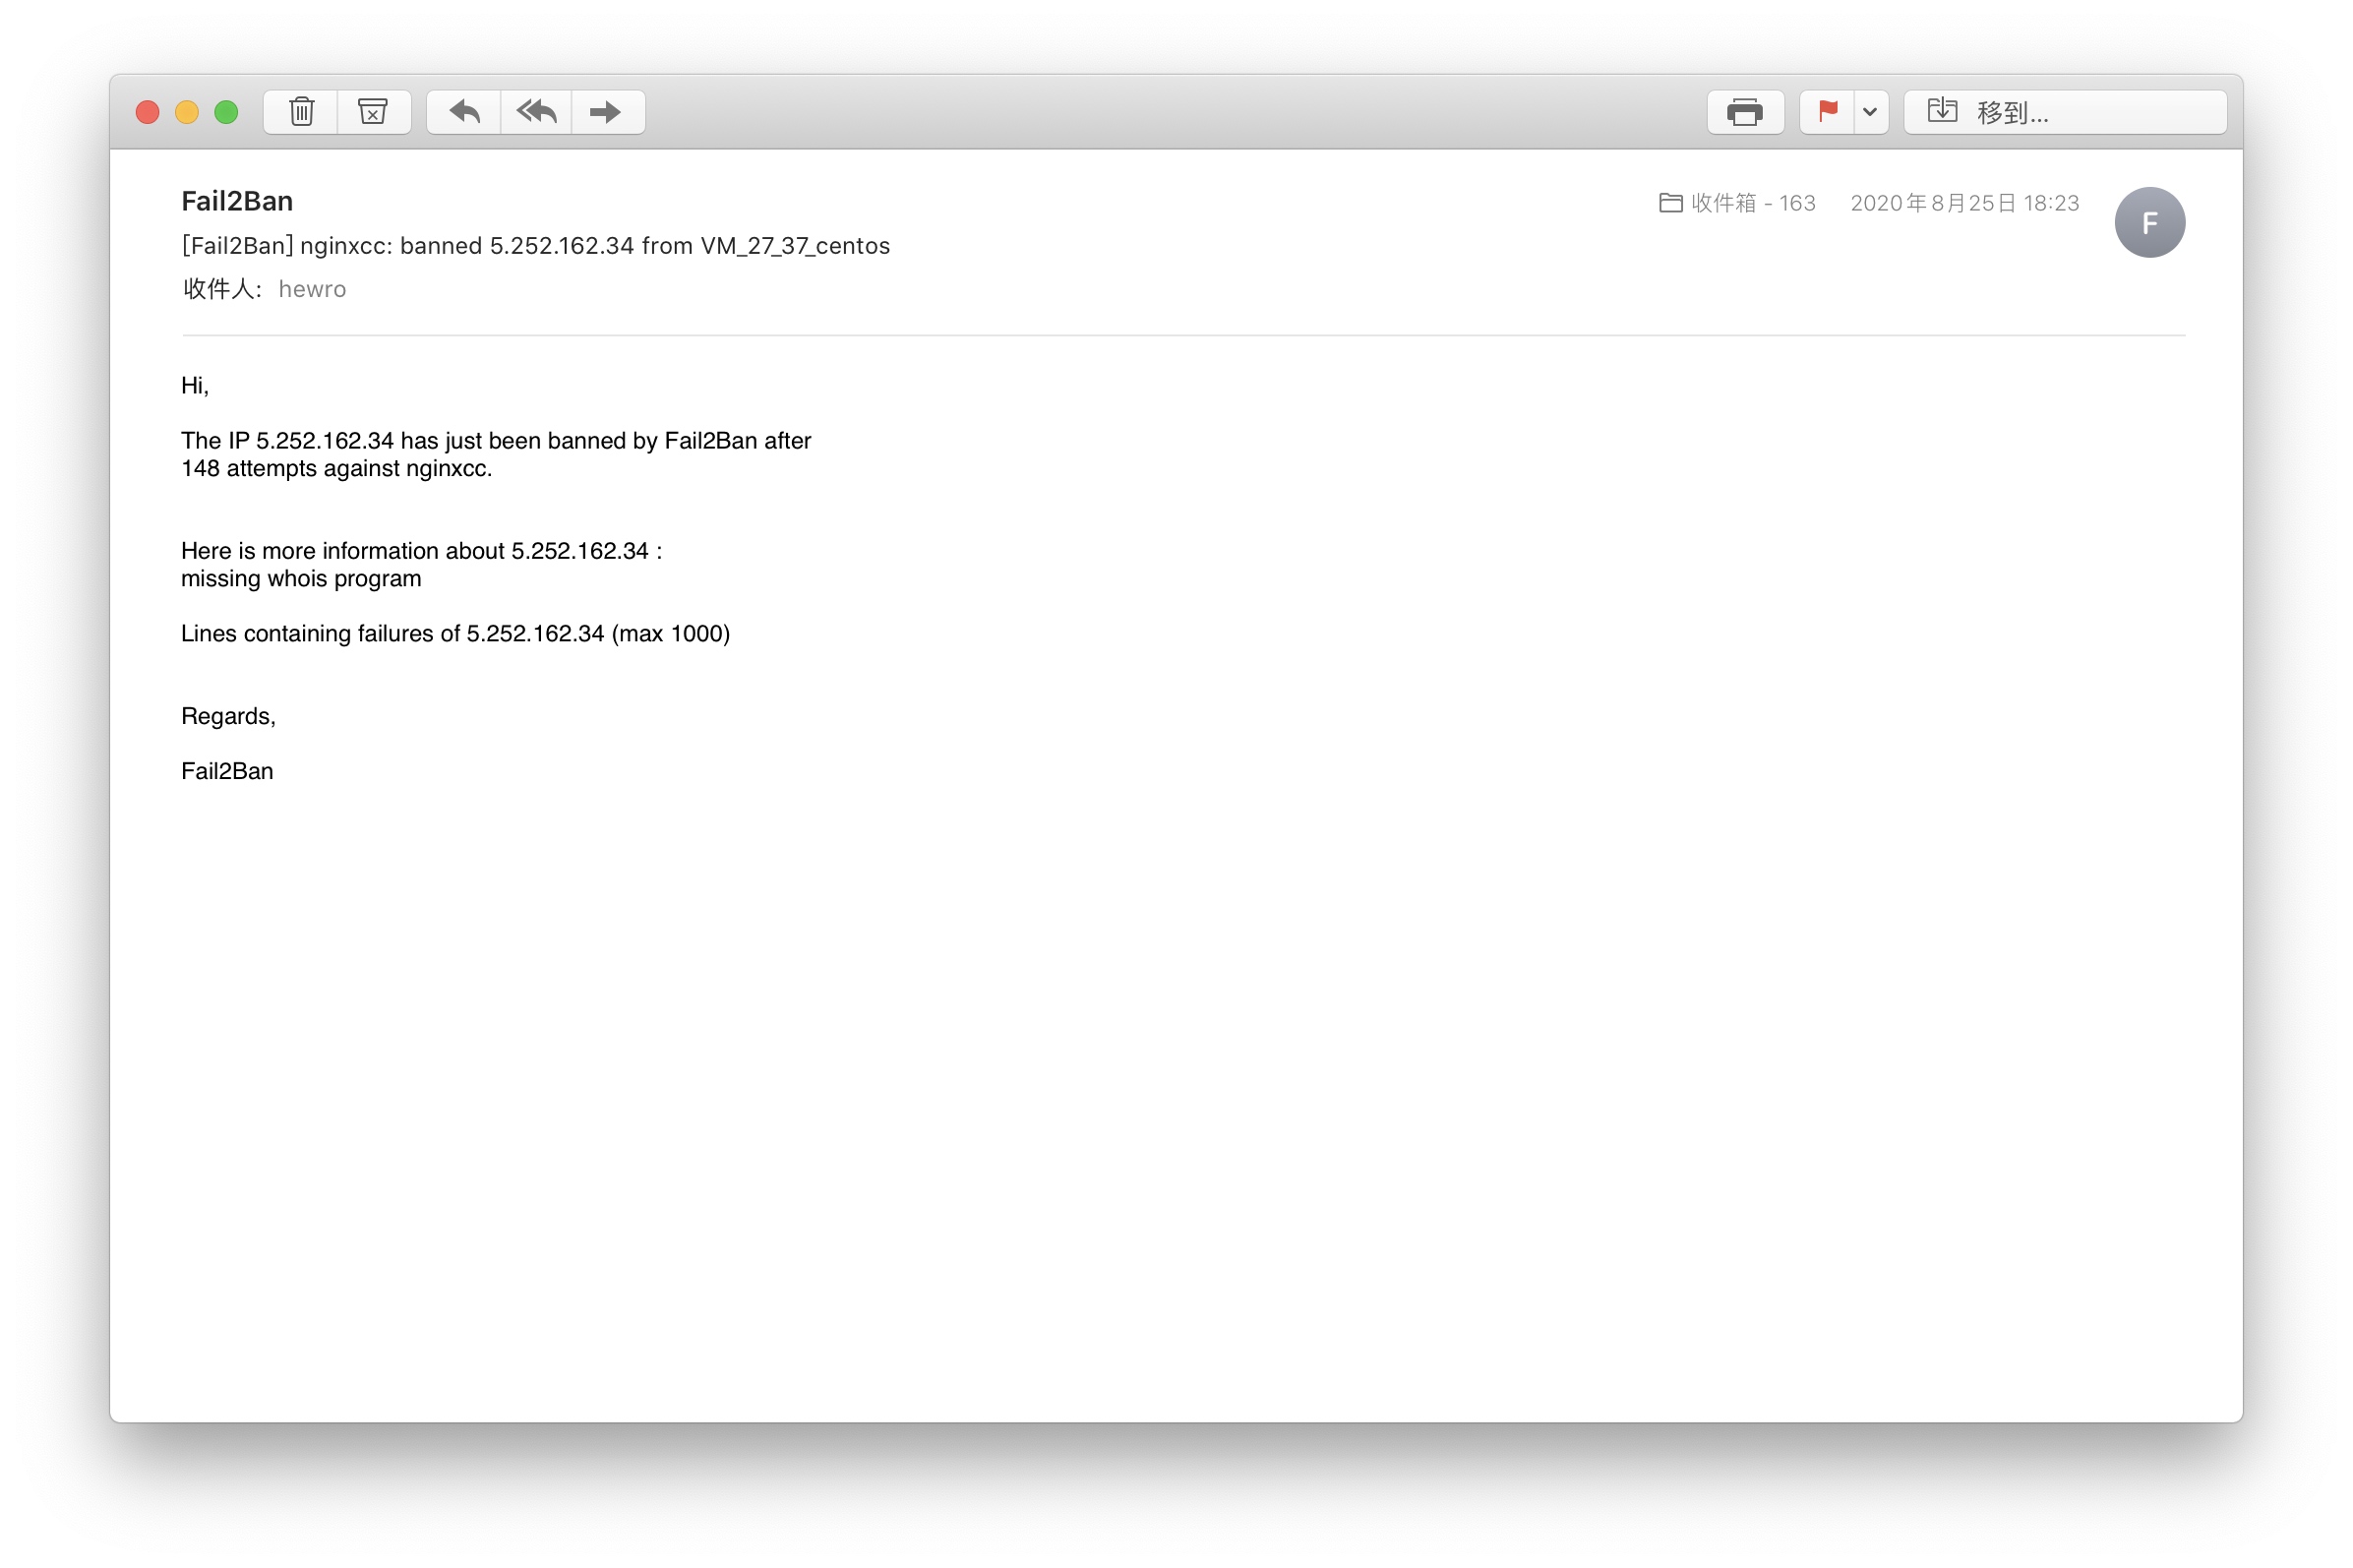
In addition, you may notice that there is another action sendmail Configuration of. After this option is configured, when the prison is enabled, stopped, or an IP address is blocked, an email will be sent to your dest email address. If your server is configured sendemail modular.

 15986868197773.jpg

The default email address is fail2ban@<hostname> , the format of the message is in /etc/fail2ban/action.d/sendmail-whois-lines.conf File.

Another thing to note is that the restart of iptables will fail. After restart, your blocked IP addresses will be lost and can be modified /etc/fail2ban/action.d/iptables-allports.conf , the modified code is as follows:

 [INCLUDES] before = iptables-common.conf [Definition] actionstart = <iptables> -N f2b-<name> <iptables> -A f2b-<name> -j <returntype> <iptables> -I <chain> -p <protocol> -j f2b-<name> actionstop = <iptables> -D <chain> -p <protocol> -j f2b-<name> <actionflush> <iptables> -X f2b-<name> actioncheck = <iptables> -n -L <chain> | grep -q 'f2b-<name>[ \t]' actionban = <iptables> -I f2b-<name> 1 -s <ip> -j <blocktype> && service iptables save actionunban = <iptables> -D f2b-<name> -s <ip> -j <blocktype> && service iptables save [Init]

That is, after the iptables operation, add service iptables save Keep records.

see

 #View the filter and ban logs of prison work tail -f /var/log/fail2ban.log #Start systemctl start fail2ban #Stop systemctl stop fail2ban #Restart systemctl restart fail2ban #Startup systemctl enable fail2ban #Check the operation status of the fail2ban module (generally used when troubleshooting the cause of errors) journalctl -r -u fail2ban.service #View prison list fail2ban-client status #Check the closure of a prison fail2ban-client status nginxcc #Delete an IP under a prison fail2ban-client set nginxcc unbanip 192.168.1.115 #Manually disable an IP fail2ban-client set nginxcc banip 192.168.1.115

Finally, remember to regularly clean your error.log and fail2ban.log logs. You can write a regular task to clean every half an hour

Last modification: May 14, 2022
Do you like my article?
Don't forget to praise or appreciate, let me know that you accompany me on the way of creation.