Topic: Can the hype of "dragon flying and phoenix dancing" be continued due to the intensification of short-term differences?
It has been 16 years since A-share first stood at 3000 on February 16, 2007 Experienced Nearly 50 so-called 3000 point defense battles. Looking back, 3000 o'clock almost becomes the "belief line" of A-share investors: every 3000 o'clock, there is an octagon of individual investors crying, media excitement, policy rescue, expert relief, and empty competition.
Let's take a look at a set of data: A shares have experienced 4052 trading days in total, from the intraday high of 3000 points on February 16, 2007 to the second low of 3000 points on October 20, 2023. Among them, 2083 trading days with closing price higher than 3000 points; There were 1969 days below 3000, and the difference between the two sides was only more than 100 days in more than a decade.
That is to say, from the perspective of big data, 3000 points is indeed the "Chu River Han Border" of A-share.
So, what do 3000 points look like in the past 16 years, and why is it different this time?
01 Market as a whole
First, we should define the historical time stamp when the market falls below 3000 points.
On February 16, 2007, the Shanghai Stock Exchange Index broke through 3000 points for the first time. Since then, except for this time, there have been five more obvious breakdowns:
The first time was on June 11, 2008, just experienced "6124 ” The Shanghai Stock Exchange Index fell back quickly for several months, and fluctuated above 3500 points for a long time in the future, but it was still a downward relay on the whole. Therefore, we regard it as a downward cycle to return to more than 3000 points from the middle of 2008 to the end of 2014. At that time, the media played up "stamp duty"( 0.3% down to 0.1% )The market did not work.
The second time was on January 13, 2016, that is, shortly after the "circuit breaker", A-share quickly fell back to the horizontal market near 3000 from the top before 5000 for two years. During this period, it repeatedly fell below 3000 points, and then experienced a wave of rebound to above 3500 points.
The third time was on June 19, 2018. After a slight rebound for two years, the Shanghai Stock Index fell below 3000 points again, and continued to decline to the horizontal market near 2500 points, maintaining the depressed market below 3000 points for nine months. "A-share investment"( A-share included in MSCI index )The market did not last too long.
The fourth time was on May 6, 2019. After a brief rebound, the Shanghai Stock Index returned below 3000 points again in less than a quarter. Within the next year's time limit, the Shanghai Stock Index was trading sideways at 2700-3100 points. At that time, the media played up the bull market. Now it's time to look at the bull market, but the bull market can't be found.
The fifth time is during the period from April 25, 2022 to October 10, 2022, it has repeatedly dropped below 3000 points, and during this period, it was around 3000 points. Because of the recent time, we have unified it as one time. The long-term reduction of reserve ratio and interest rate, as well as the sideways market situation that has lasted for many years, have made investors more or less disinclined to the "three axe" policy.
Next, from the perspective of the most basic valuation, we will review and express the common features of the 3000 point defense campaign.
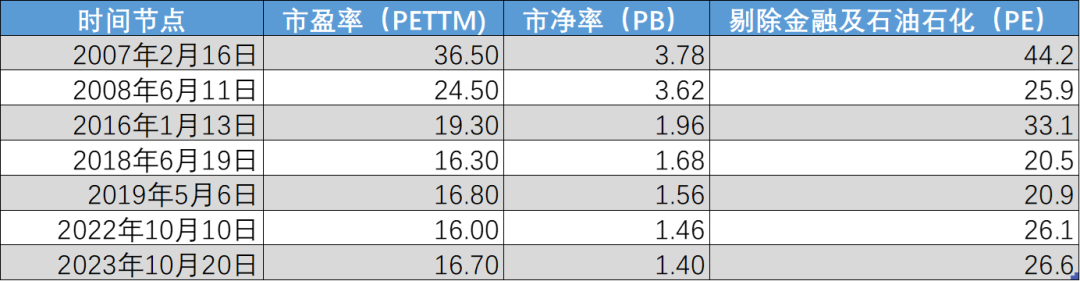 Figure: The valuation level when it has dropped below 3000 points, source: Brocade Research Institute
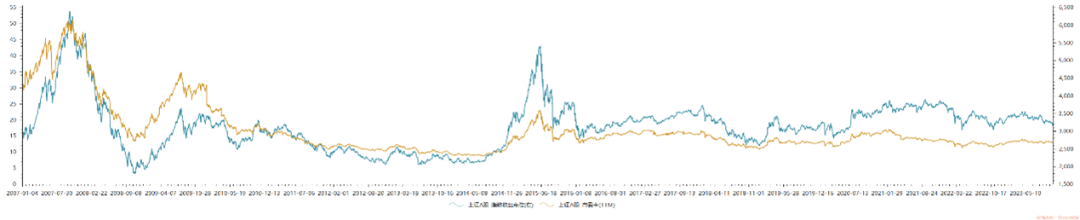 Figure: Shanghai Stock Exchange Index and overall P/E ratio, source: Choice Financial Client, Brocade Research Institute
 When we put the closing price line and the overall P/E ratio line of the Shanghai Stock Exchange Index in the same chart, we can clearly see that: Since 2016, the market no longer gives the Shanghai Stock Exchange Index a high valuation. Even in the period when the index rose, the valuation level remained stable within the 10-20 times range.
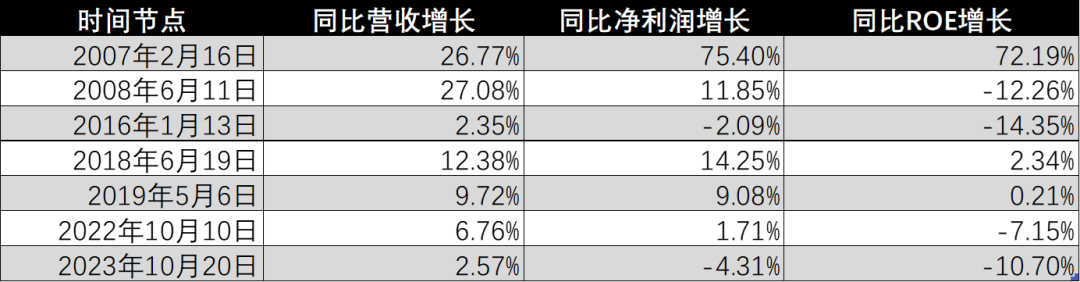
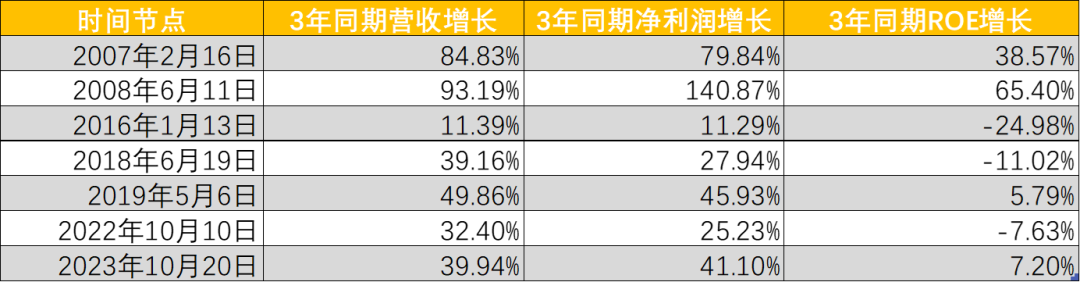
On the other hand, from the perspective of growth, except that all A-share companies were thriving when they broke 3000 points in 2007, it seems that every time they fell below 3000 points, there was some rationality: Over the same period, the return on net assets has declined significantly. From a long-term perspective, the overall enterprise's revenue and net profit have also declined significantly in recent years ( When it fell below 3000 points this year, the same period of three years was the financial reporting period at the beginning of the epidemic, not for reference )。
Brocade Research Institute
Therefore, from the perspective of the market as a whole, the relative valuation has reached a low point, 16.7 times of PE and 1.4 times of PB are undervalued, but they are not low when petrochemical oil and finance are excluded. And if you consider the growth of the enterprise itself, it is really not optimistic.
02
Industry valuation Let's first look at the PE valuation at the industry level (excluding financial banks )The sample selects 20 industries with the highest market value among the Shenyi industry:
Compared with the year 2007 when it broke through 3000 points, only the national defense industry maintained an increase in valuation multiples. In terms of the valuations below 3000 points for the last two times, the valuations of eight industries were lower than those when they fell below 3000 points last year, while the valuations of 12 industries were higher than those when they fell below 3000 points last year.
Among them, the valuation of agriculture, forestry, animal husbandry and fishery, electric power equipment and food and beverage shrank most significantly compared with the last time when it fell below 3000 points. Benefiting from AI and data elements, the valuation level of electronics, media and computers was higher than that when they fell below 3000 points last year.
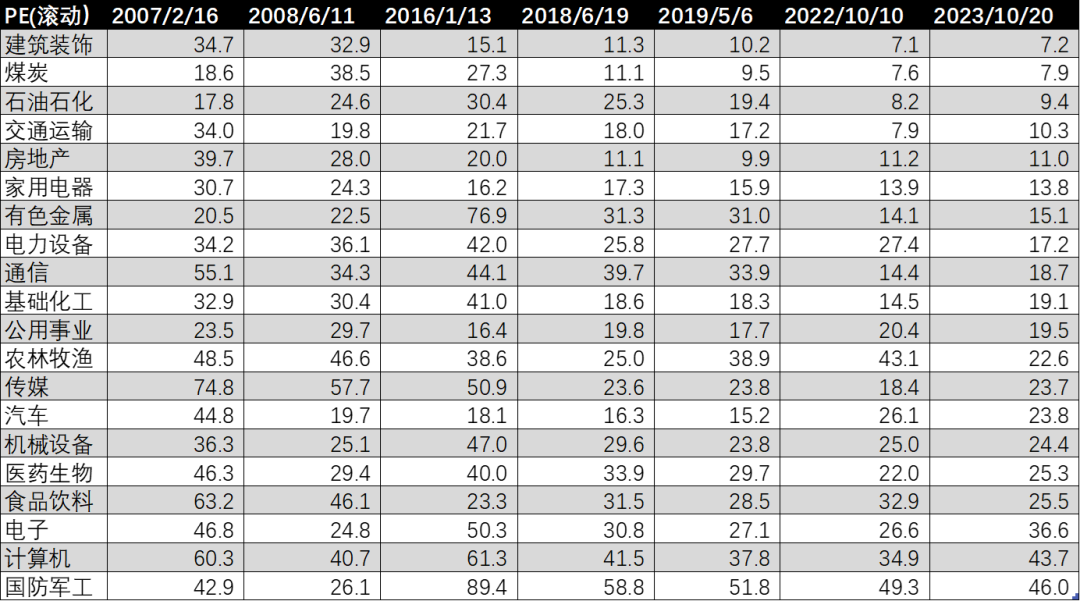 Figure: Top 20 PE valuation level of Shenyi industry in calendar period, source: Brocade satin research institute
 In PB band, we have added banks and petrochemicals. Like PE, the overall asset price is relatively cheap at present. Only the asset valuation of the household appliance industry has increased. However, compared with last year when it fell below 3000 points, there were still 11 industries with growth in PB valuation.
Compared with the first breakthrough of 3000 points in 2007, the PB valuation of banks, securities firms and media industries declined the most. The PB valuation of household appliances, computers and electronics was basically flat.
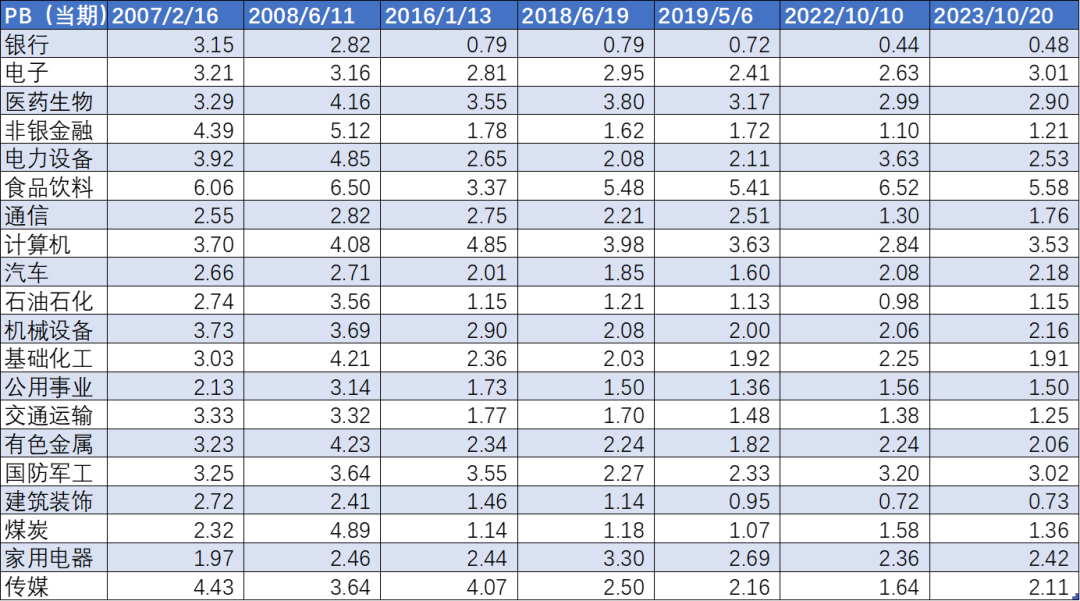 Figure: Top 20 calendar period PB valuation level of Shenyi industry, source: Choice financial client, Brocade satin research institute
 From the perspective of the valuation percentile, we will push back the valuation for five years when the value falls below 3000. From the perspective of PE: At present, steel, electronics and building materials are at historical high valuations; Although the quantile of real estate has declined significantly in the past year, it is still relatively high compared with the historical quantile.
At the same time, power equipment, national defense industry, food and beverage are at a historical low from the perspective of PE.
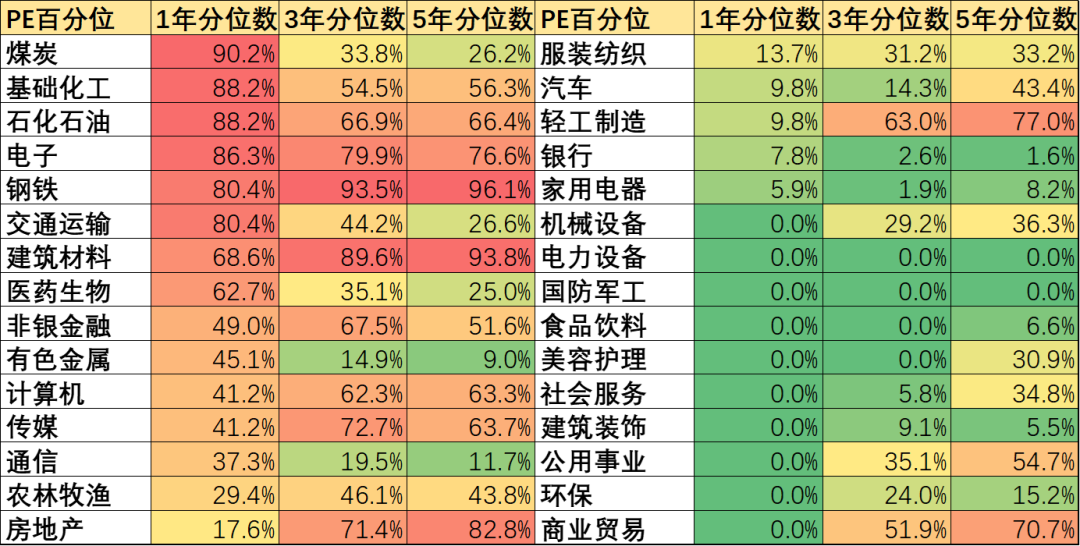 Figure: Percentage of PE valuation of Shenyi industry, source: Choice financial client, Brocade satin research institute
 In terms of the percentage of PB valuation, the valuation of all industries is low. In a one-year cycle, only the automobile industry is higher than the median; The three-year period reached a historical low, and no industry was higher than the three-year median.
In addition, building materials and decoration in the upstream and downstream industries of real estate have reached the lowest asset price in five years, which is basically in line with investors' judgment on the industry. At present, the auto industry has a slightly higher PB valuation, followed by coal and communications.
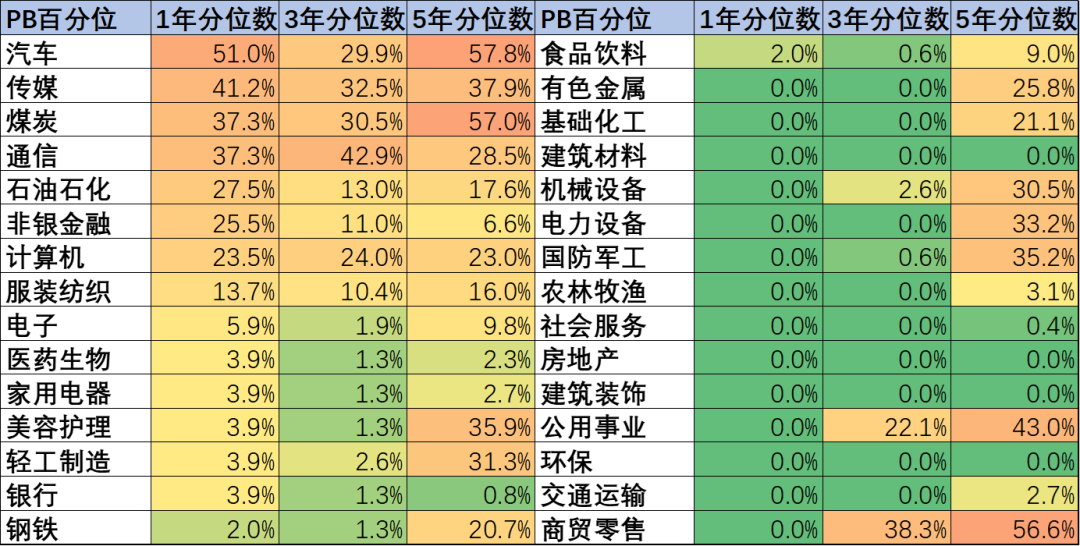 Figure: Percentage of PB valuation of Shenyi industry, source: Choice financial client, Brocade Research Institute
 03 Leading stocks
After looking at the overall valuation profile of the industry, let's take a look at where the valuation point of leading individual stocks has fallen below 3000 points over the years.
We selected the top three industry leaders among the 15 Shenyi industries with the highest market value. Taking this as a sample, the performance of individual stocks during the 3000 points defense war over the years is derived.
Let's first look at the PE list. Among the 45 leading samples, only 18 leading stocks have lower valuations than when they fell below 3000 points a year ago, which is constrained by performance, IFLYTEK The valuation is significantly higher than in previous periods. Of course, there are also leading stocks that have obviously benefited from AI, cycle and new energy, such as Kingsoft Office 、 SMIC International 、 Luoyang Molybdenum Industry 、 Shandong Gold and Great Wall Automobile 。
The PE valuation is significantly lower than that of the previous leading stocks, and the individual stocks with significant performance improvement, such as BYD 、 Ningde era There are also hot industries whose popularity has declined in the same period since this year, and the value of each stock market has declined significantly, such as Longji Lvneng 、 Mindray Medical 。
Looking at the PB list, there are also 45 samples, and only 17 leading companies have lower valuations than a year ago, including Mindray, Longji and Salt Lake Shares The PB valuation of iFLYTEK, Kingsoft Office and Shandong Gold significantly increased.
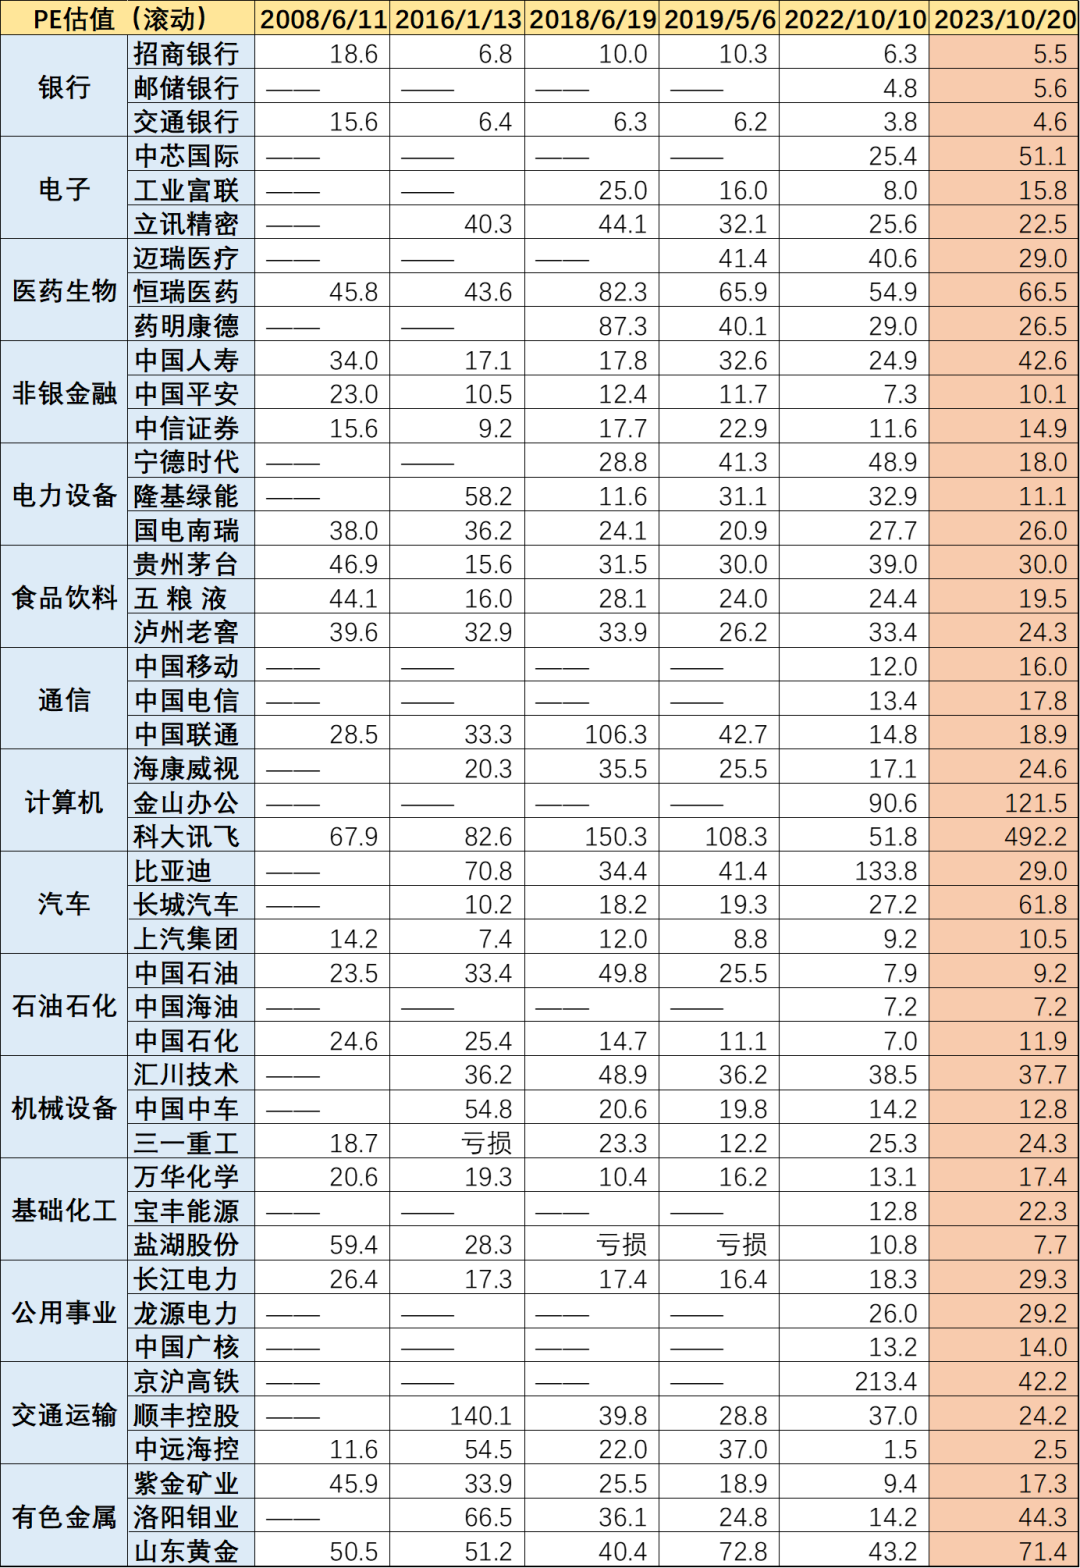 Figure: PE valuation level of the industry's top 3 leaders in the calendar period, source: Choice financial client
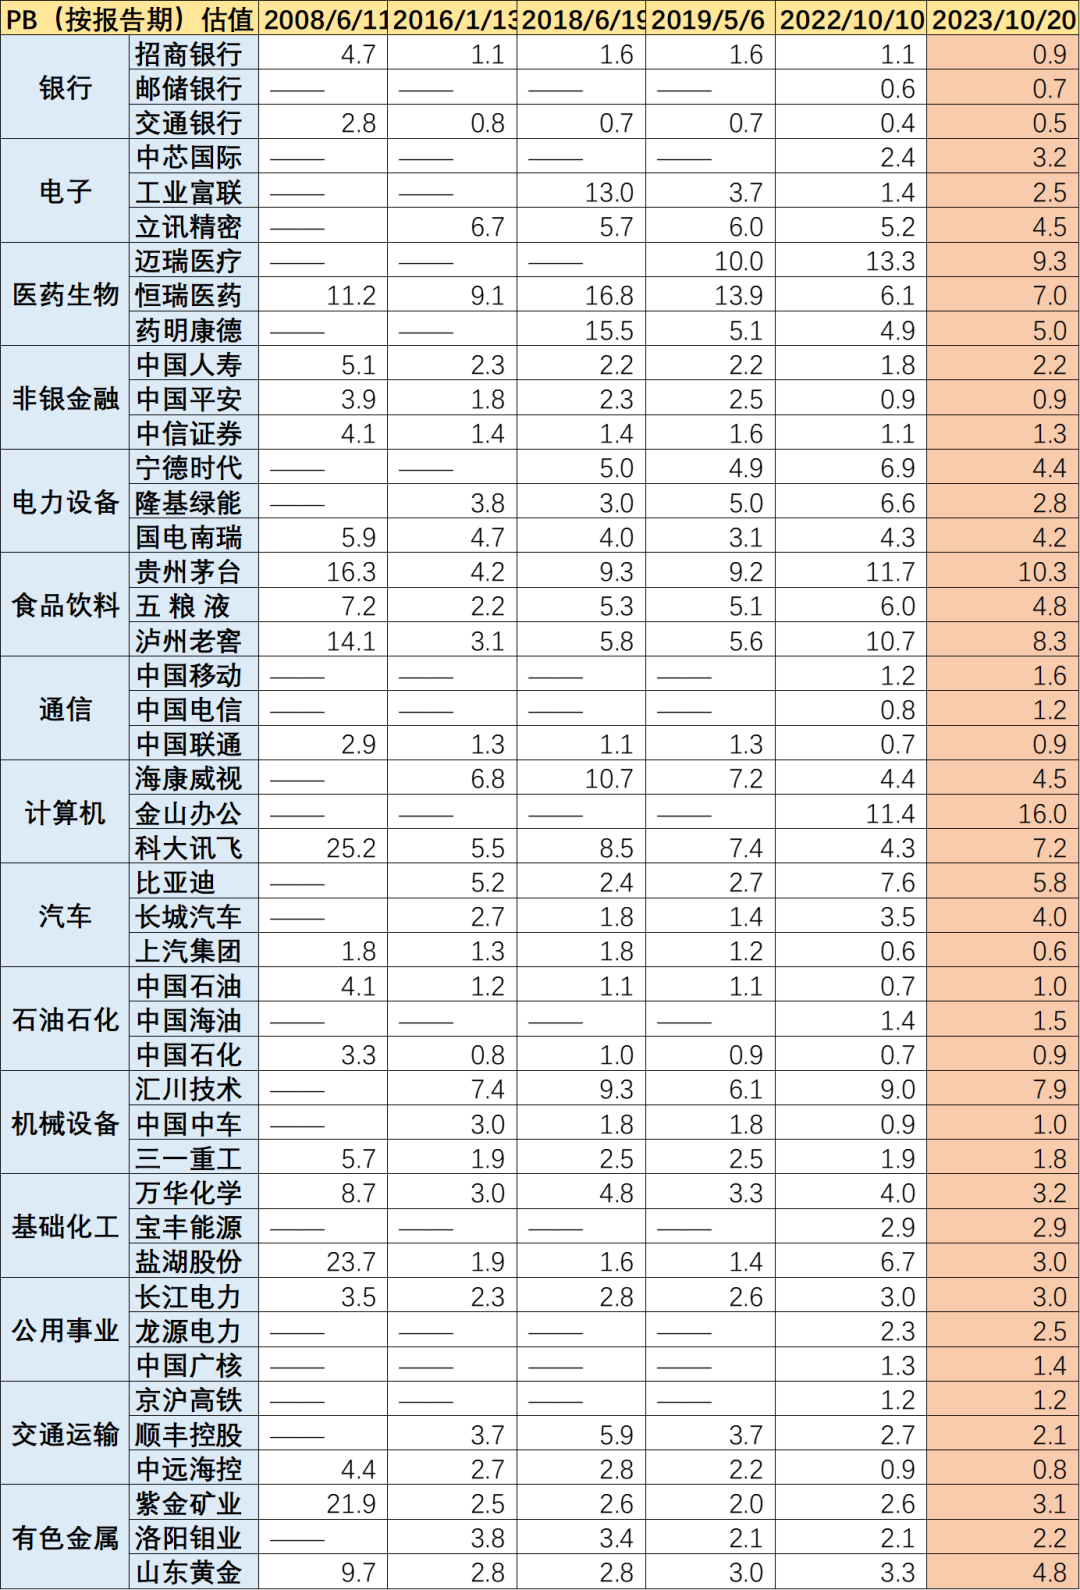 Figure: PB valuation level of the industry's top 3 leading calendar period, source: Choice Financial Client
 Finally, we calculated the percentage of PE and PB of leading stocks in the past 1, 3, and 5 years. Including high dividend industry Petrochemical oil service China Mobile, China Telecom and Bank of Communications Since this year, the market value performance has been excellent, so the market value percentage is not low.
Ningde era and Longji, Baijiu Moutai and Wuliangye , as well as Shunfeng in the logistics field, both PE and PB are currently in the undervalued range.
The complete table is as follows:
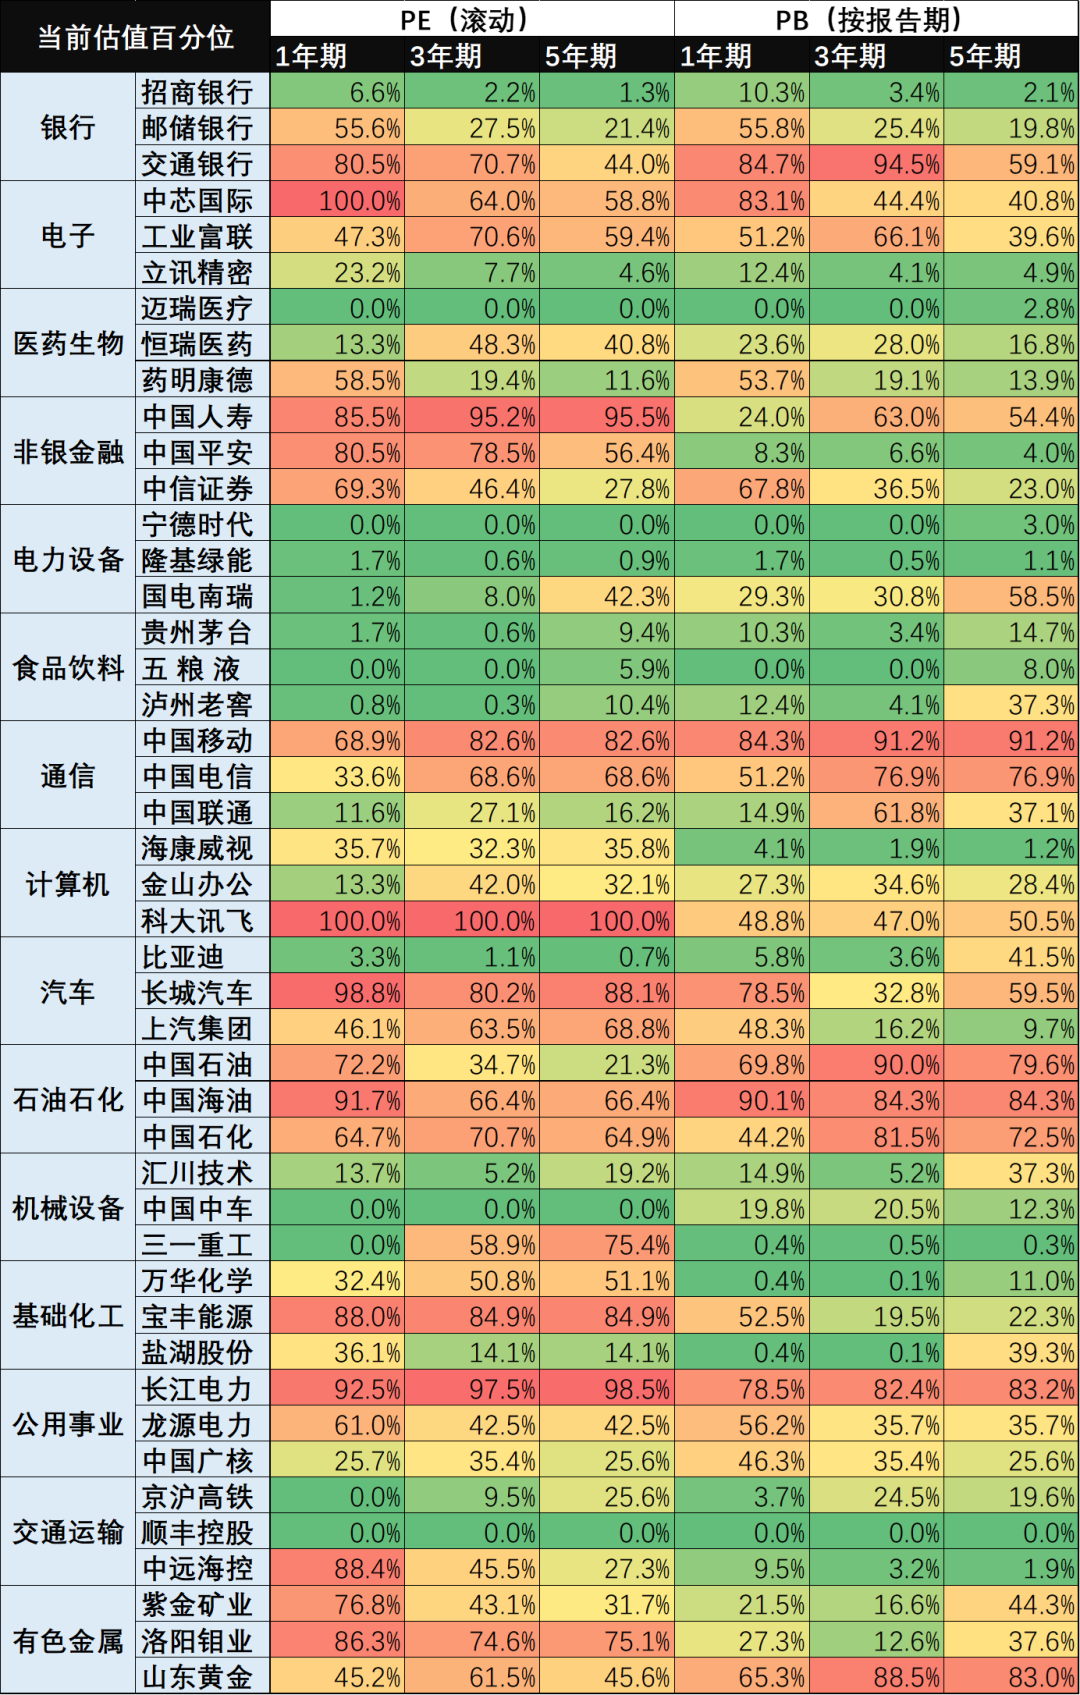 Figure: Top 3 industry leading valuation percentile, source: Choice Financial Client
 04 epilogue
As usual, let's make a summary:
1.3000 is the watershed of A-share market. Since 2007, the Shanghai Stock Exchange Index has been basically flat on trading days around 3000. If you look at it for a long time, in the past 16 years, there have been six obvious records of falling below 3000 points from the top horizontal.
2. These six times, the valuation of Shanghai and Shenzhen A is getting lower and lower, especially the P/B ratio, which is the lowest when it falls below 3000 this time. But excluding petrochemicals and bank securities companies, the overall P/E ratio of A-shares is still 26 times. For comparison, the S&P 500 is 22.6 times, the Dow Jones is 23.6 times, and the Nasdaq is about 40.4 times.
3. From the perspective of profit and return on capital, there are certain potential factors for this fall below 3000. The current profit level of listed companies is the lowest in the past five years when it fell below 3000. Both the net profit rate and ROE are poor year on year, so the basic confidence is poor.
4. From the industry level, the PE valuation of 12 of the top 20 industries with the current market value is higher than the valuation level when it fell below 3000 points last year, and the PB valuation of 11 industries is higher than the level last year. From the perspective of PE percentile, cyclical industries and high dividend industries are still in a high historical valuation range. From the perspective of PB percentile, almost all industries except automobiles have lower valuations than the median, and nearly half of the industries have reached new lows.
5. From the perspective of the leading individual stocks, the differentiation is relatively serious. The valuation of most leading individual stocks, whether PE or PB, is higher than that of the same period last year, which fell below 3000 points, that is to say, this round of downward small market capitalization of individual stocks fell more severely.
To sum up, this time it fell below 3000 points. From the perspective of valuation, many industries are already in valuation depression. But from the perspective of fundamentals, what the market lacks is not valuable assets, but confidence in the future.
Now we will give you 60 yuan of welfare red envelope, direct cash withdrawal is not a routine~~~Come to participate in the activity!

Massive information, accurate interpretation, all in Sina Finance APP
Editor in charge: Wei Yihan