On Friday, May 24, in the morning of the Asian market, spot gold hovered at a low level in the past two weeks, and is currently trading near 2331.98 dollars/ounce. Gold price The decline continued on Thursday, hitting as low as $2326.90/ounce, the lowest since May 9, closing at $2328.35/ounce. In the past two trading days, the cumulative decline was more than $90. The US initial jobless claims data showed strong performance, and investors were worried about the timing of US interest rate cuts and the strong performance of US corporate activities.
News interpretation: Due to the strong U.S. business activities reducing the urgency of the Federal Reserve's interest rate cut, spot gold fell ceaselessly, falling 50 dollars within the day, falling below the 2330 threshold, and finally closing 2.15% lower at 2327.69 dollars/ounce, the lowest since May 9; After hitting a record high above US $2450, the gold market fell into trouble again, because the hawkish sentiment of the Federal Reserve panicked the market;
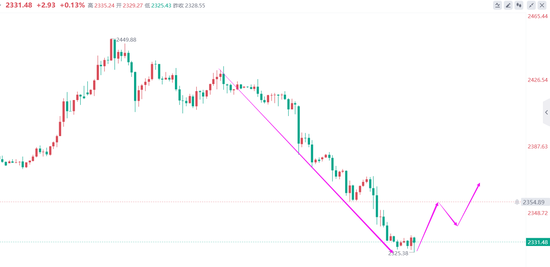
Gold trend analysis: on Thursday morning, the gold price peaked at 2383 and then fell again. During the Asian session, the gold price gradually stabilized in the 2367-2373 consolidation range. After entering the afternoon session, the gold price expanded its short-term decline to the lowest 2354 and then gradually stabilized in the 2354-2367 consolidation range. During the European session, the gold price expanded its short-term rebound to the highest 2369 and then fell back, During the US session, the gold price broke its position and fell again. In the early morning of Friday, the gold price bottomed out at the front line of 2327 and then remained relatively mild and volatile in the short term and stabilized at the front line of 2332.
Judging from the daily gold chart, the gold price stays above the key 100 day index moving average (EMA). However, with the gold price hitting a new high on May 20, the gold price has formed a bearish deviation, but (RSI) has formed a low high, which indicates that the momentum is slowing down, and the possibility of gold price correction or consolidation cannot be ruled out. The technical indicators fell back from the reading close to overbought, the red column shrank after the MACD top deviated, the KDJ high sent an overbought signal, and the short-term gold price was faced with further callback risk. The short-term target was at the 2350 pass, and the support of the 21 day moving average was also near this position.
From the four hour chart of gold, after this week's diving downward, the gold price ended its upward trend and fell below the long defensive line at the position of $2450, which means that the short-term upward pattern has been broken, and the disk price has entered the callback rhythm again after being pressured by $2450. There is no place for the rise from US $2277 to US $2450. There is also a rise of about US $180. A larger correction action is within the normal range, which means that we still define the current decline as downward correction correction, rather than turning around. The decline is only a short-term decline, which will return to a strong form later, and there will be high points.
One hour chart level of gold. The gold price has stepped down, and the decline along the way has not recovered. At present, it has dropped more than 120 points from the high. The short seller has been looking at the rebound correction at the end of the week. At present, the resistance is at 2350. If it successfully reaches 50 today, the long market will continue. From the perspective of indicators, the energy column of MACD indicators turns from green to red, and the fast and slow lines form a golden fork. KDJ also has a golden fork rising, not to mention the sharp rebound in gold prices. At least it is not a big problem to go to 2350. Therefore, it is recommended to step back to the low level in gold operations at present, focusing on the 2320 support level in the short term at the bottom and the resistance level at 2350 at the top.
Gold operation suggestions:
1. The lower part retraced the long and bullish near 2328 to protect 2320, and the upper part looked at the 2348 short-term target;
2. The upper reaches 2350 short short for one time, and look at the bullish trend again near the correction 2332.
Safe, fast and guaranteed futures account opening on Sina cooperation platform

Sina statement: This message is reproduced from Sina's cooperative media. The purpose of posting this article on Sina.com is to convey more information, and does not mean to agree with its views or confirm its description. The content of this article is for reference only and does not constitute investment advice. Investors operate accordingly at their own risk.
Massive information, accurate interpretation, all in Sina Finance APP
Editor in charge: Chen Ping