Custom monitoring provides you with the ability to monitor your own business data.You can push the time series indicator data and event data of your own business that you care about to the cloud monitoring platform through API.View monitoring data, add alarms, view alarm events, etc. on the cloud monitoring platform to escort your business in real time.
Difference between indicator monitoring and event monitoring:
Indicator monitoring: used to report, query and alarm the time series monitoring data that is collected periodically and continuously.
Event monitoring: used to report, query and alarm monitoring data of discontinuous event types.
The usage process of user-defined monitoring is as follows:
Create a namespace
Add monitoring indicators or monitoring events
Push data through API
View monitoring data
Alarm management, including adding policies, viewing events, etc.
Create a namespace
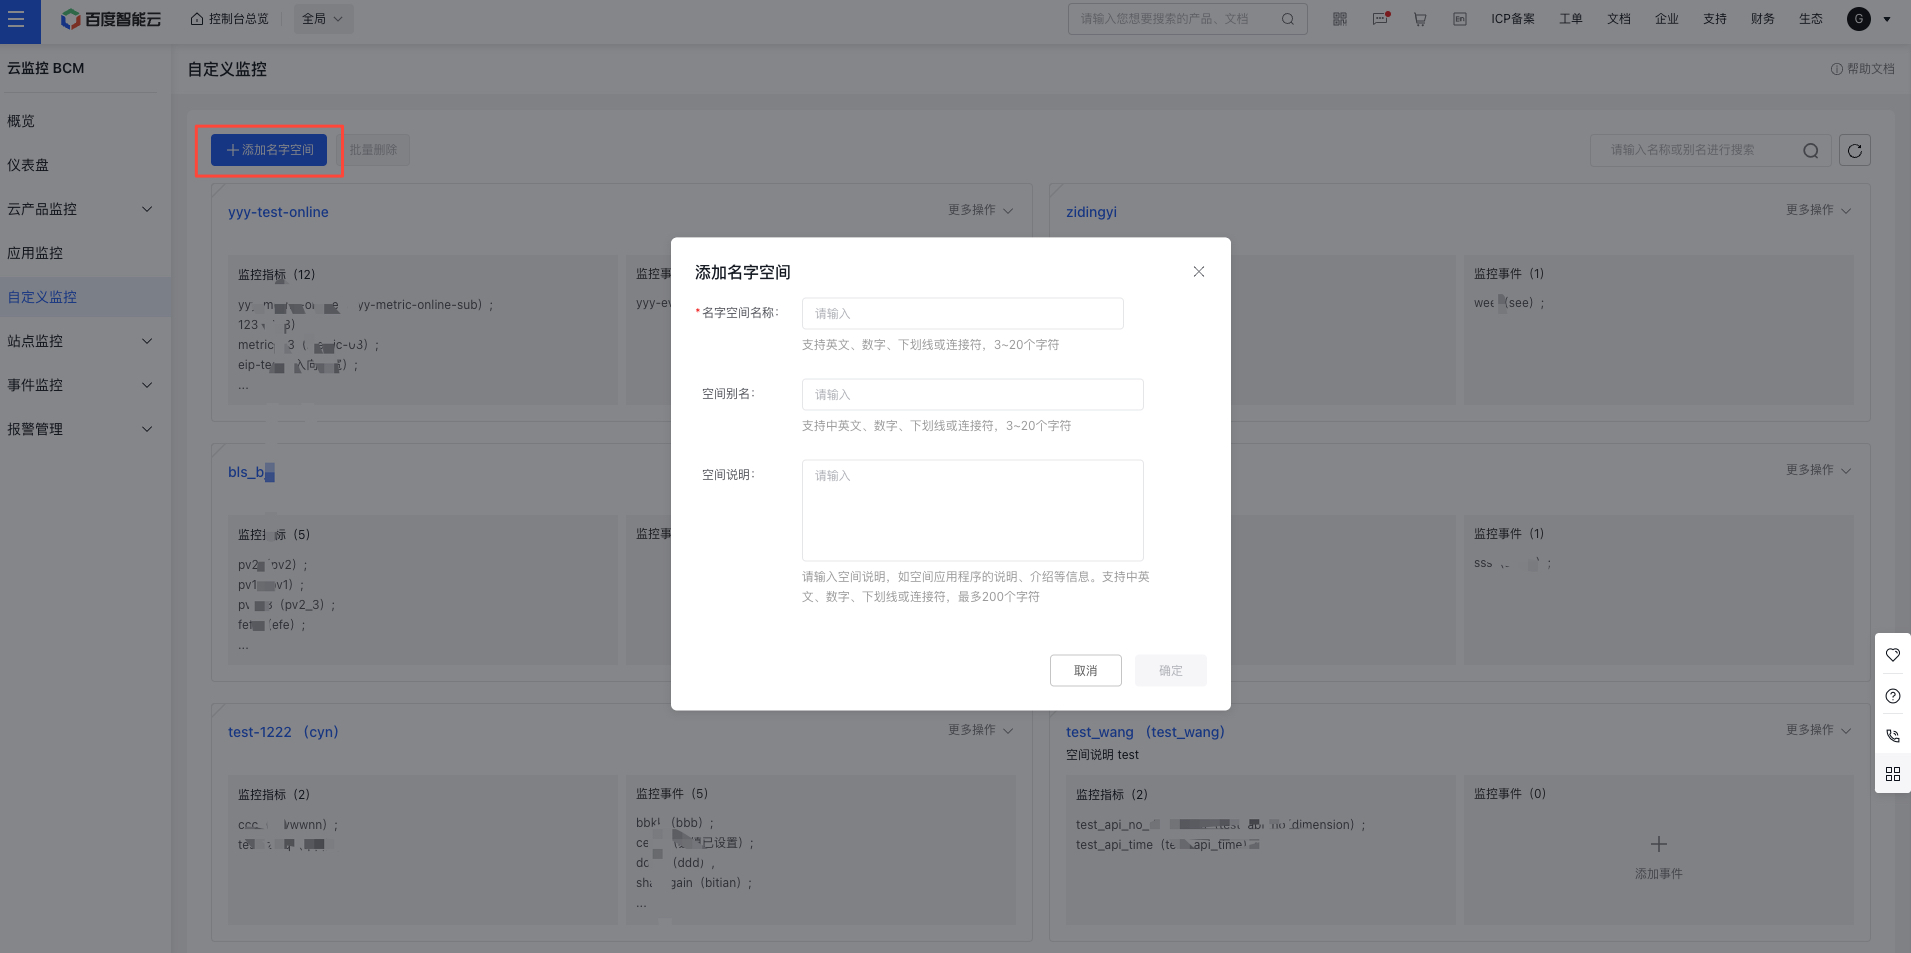
1. Enter the cloud monitoring platform, click<Custom Monitoring>-><+Add Namespace>in the left navigation bar to enter the Add Namespace form.After completing the form, you can complete the creation of the namespace.
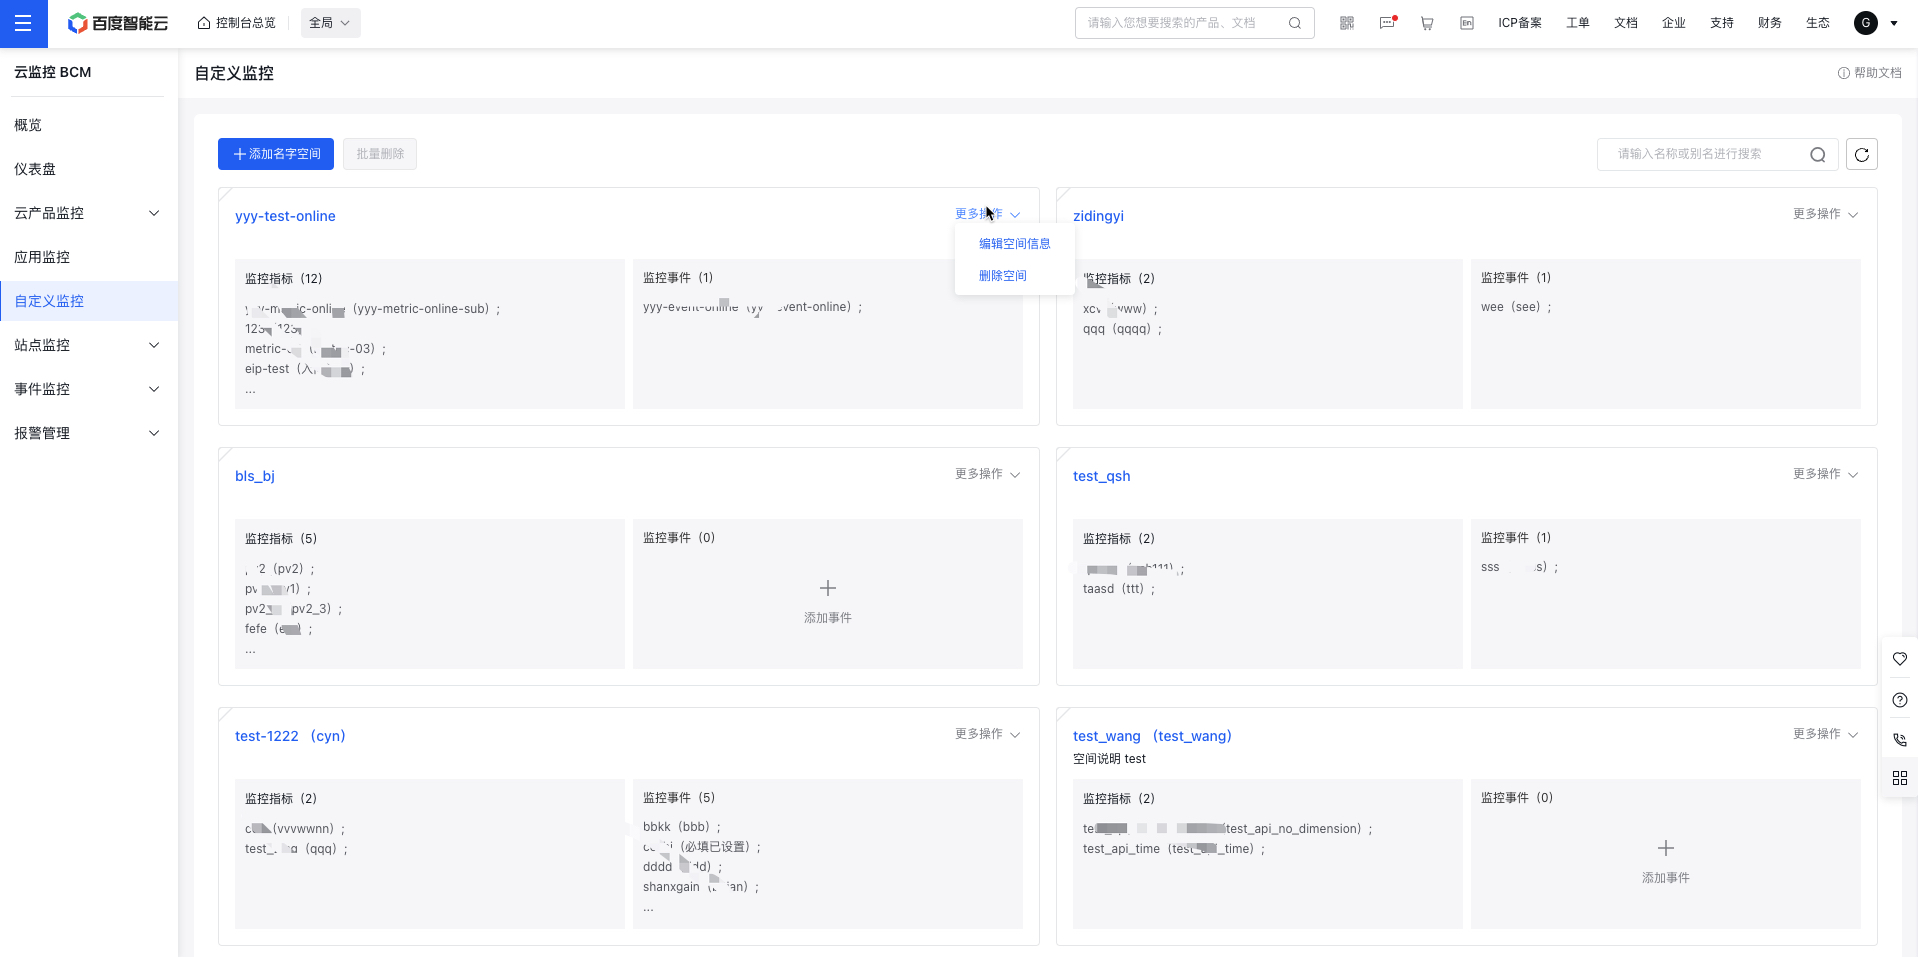
After creating a namespace, click More Actions in the upper right corner to edit or delete the namespace.
Add monitoring indicators or monitoring events
Add monitoring indicators
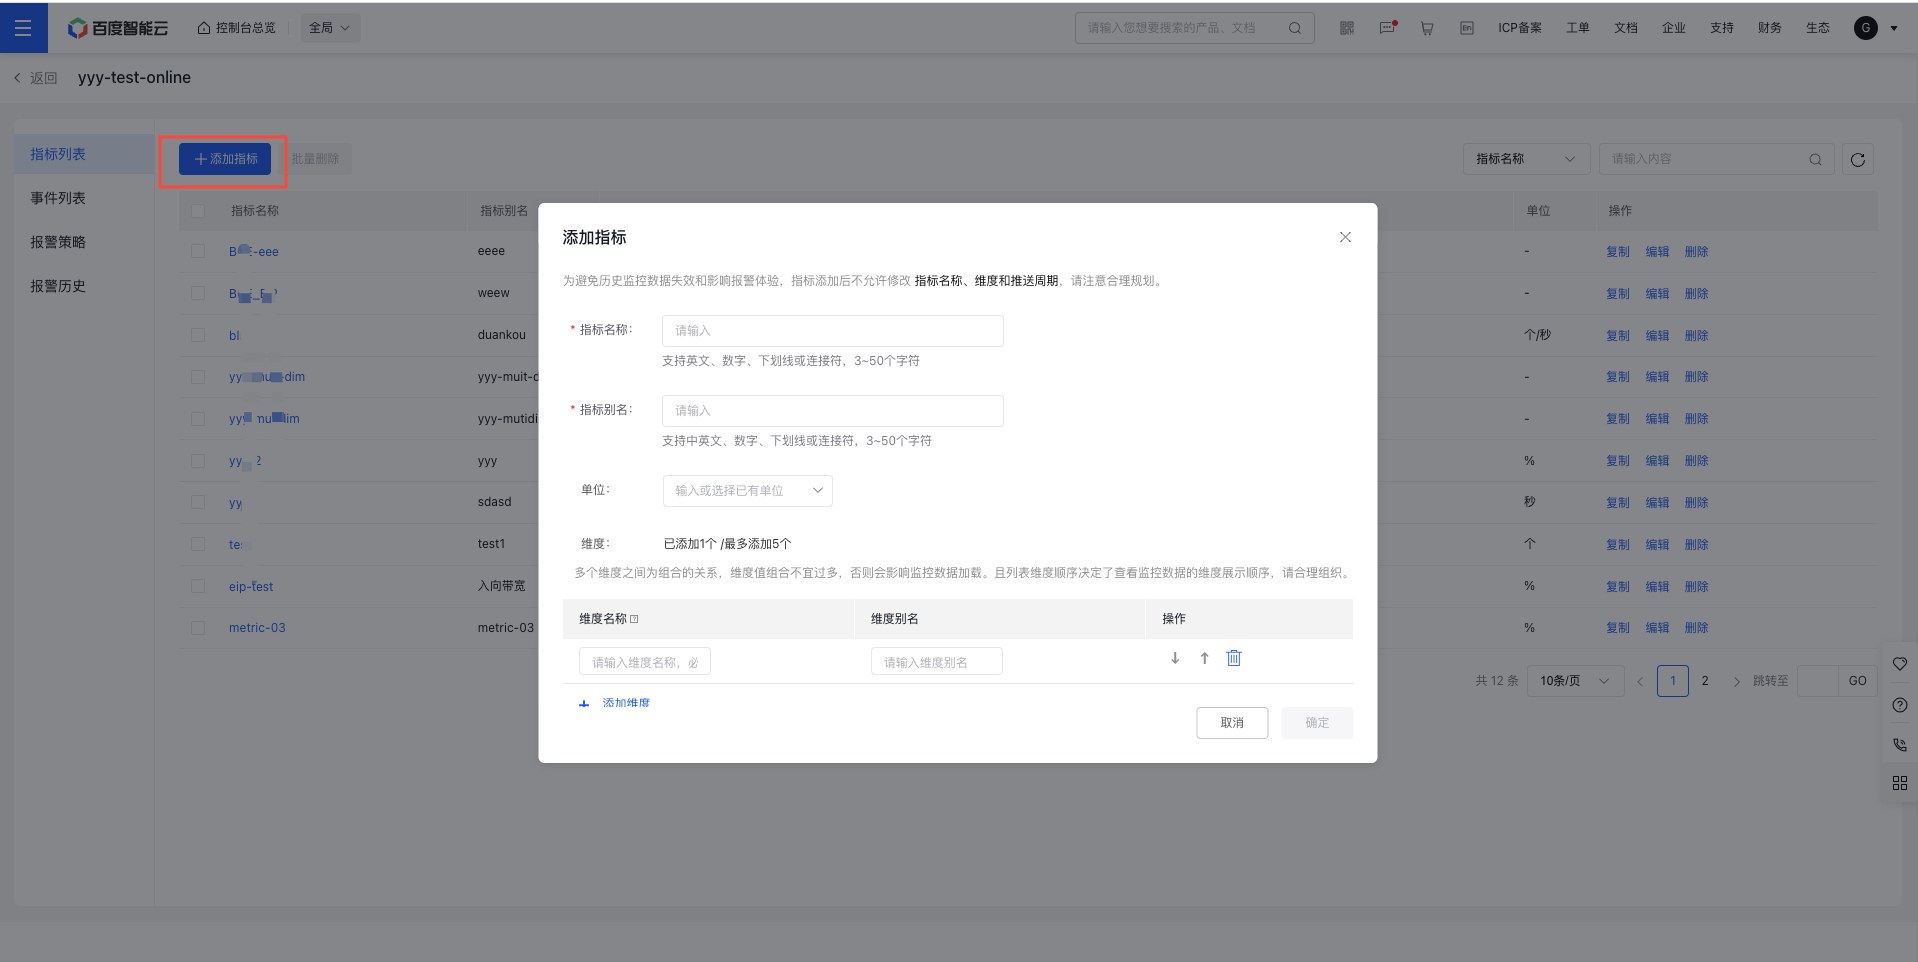
1. Enter the cloud monitoring platform, click<Custom Monitoring>-><Namespace Name>in the left navigation bar to enter the index list page of the namespace.Click Add Indicator to fill in the form and complete the configuration of indicator information.
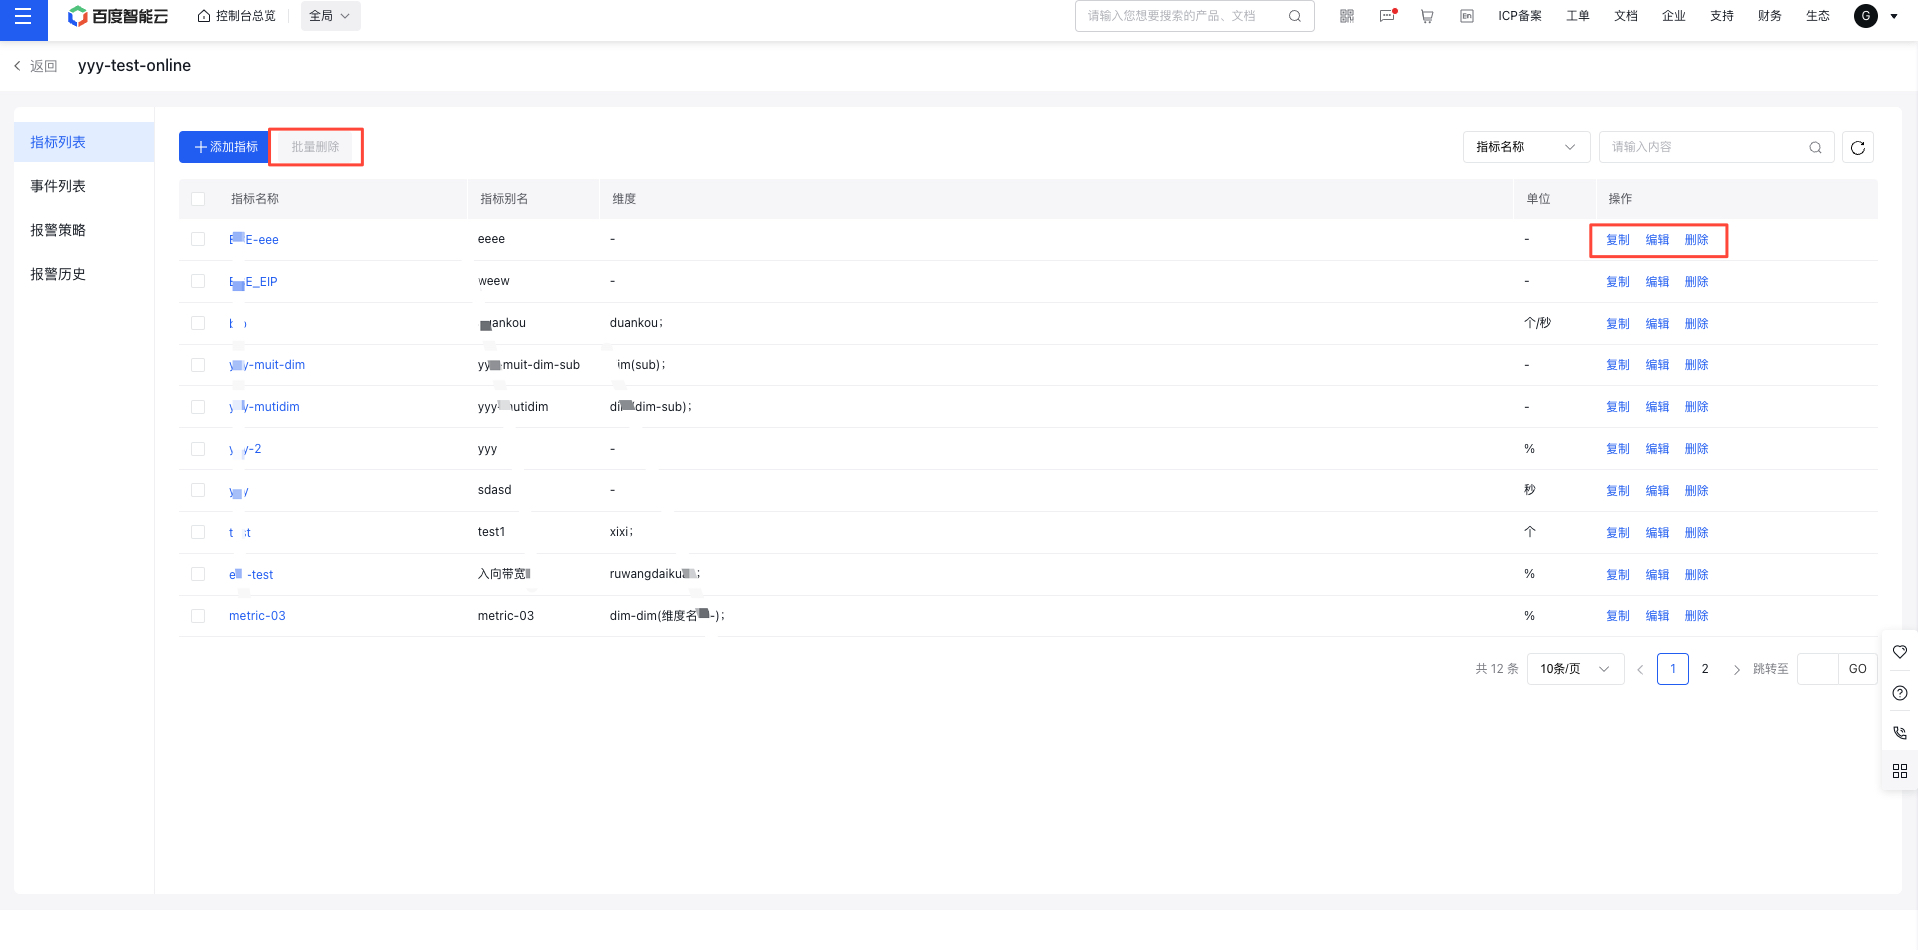
2. After the indicator information is configured, you can view all the monitoring indicators in the space in the indicator list.Click Convenient Operation to edit, copy, delete and batch delete indicators, so that you can quickly manage indicators.
explain:
In order to avoid the failure of historical monitoring data and the impact on the alarm experience, it is not allowed to modify the indicator name, dimension and push cycle after adding indicators. Please plan reasonably.
Add Event
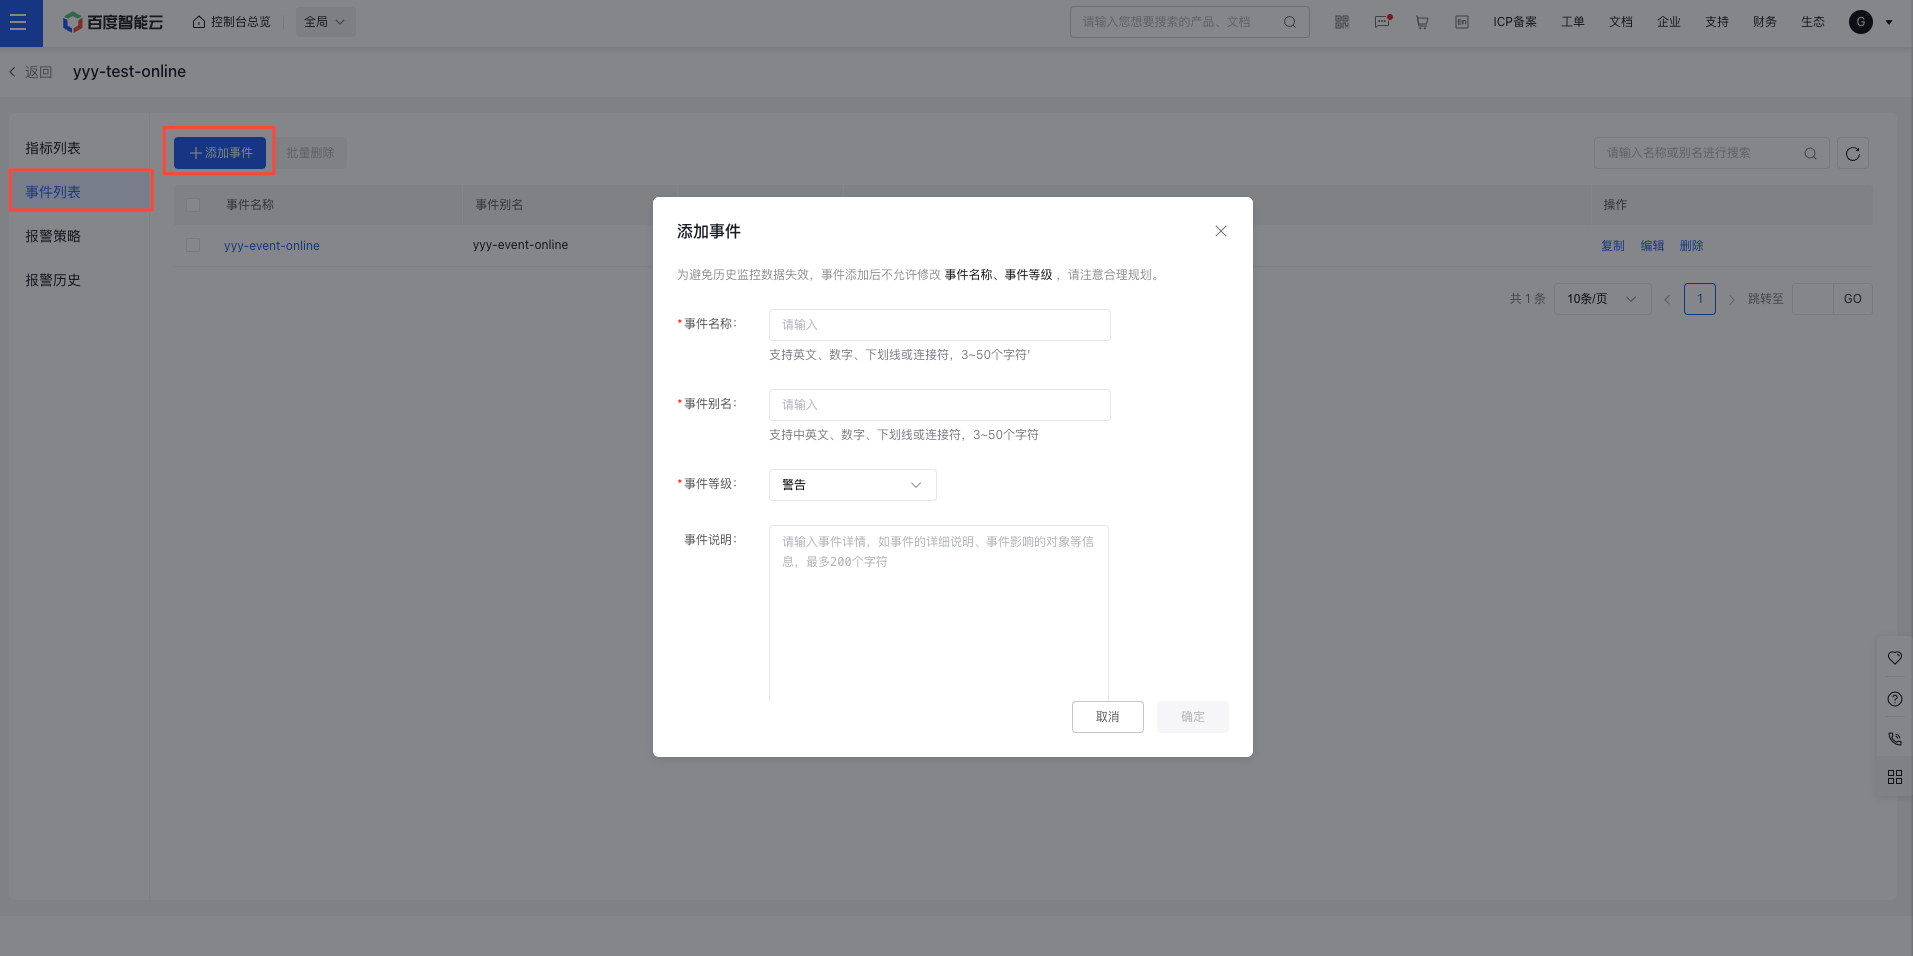
1. Enter the cloud monitoring platform, click<Custom Monitoring>-><Namespace Name>in the left navigation bar to enter the index list page of the namespace.Click the secondary navigation<Event List>-><Add Event>, fill in the form, and complete the configuration of event information.
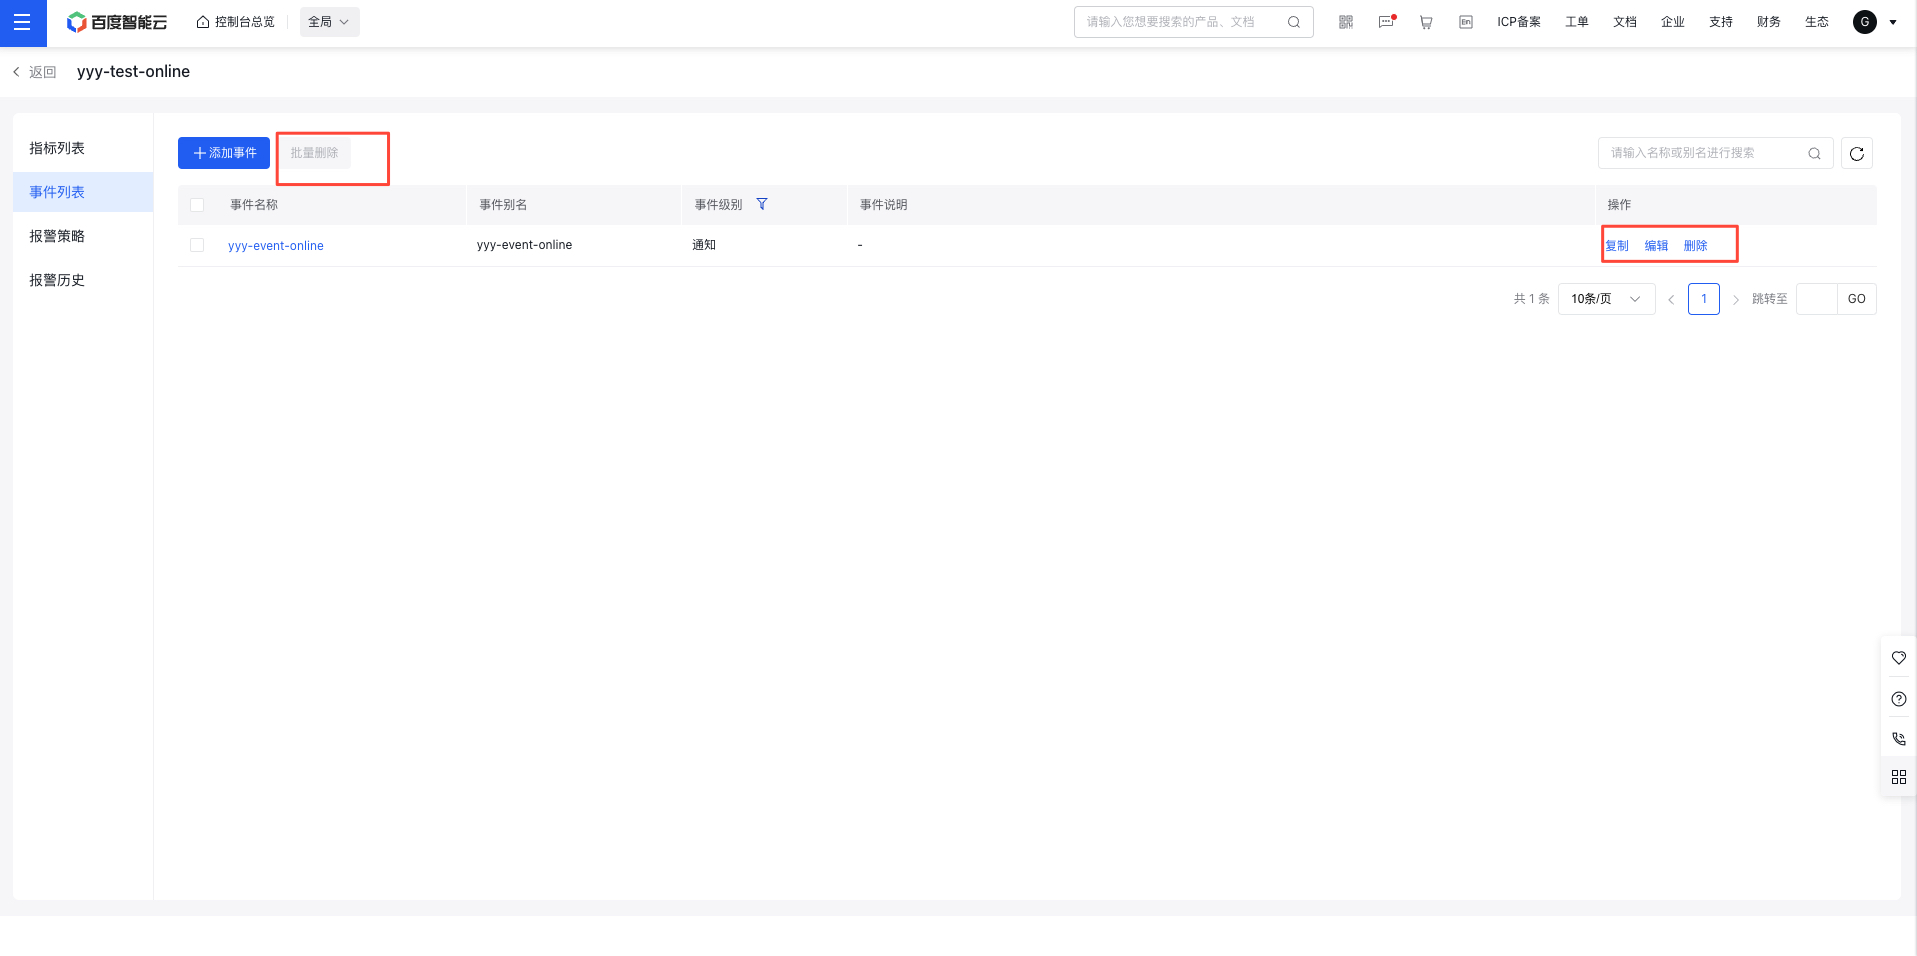
2. After completing the configuration of event information, you can view all events in the space in the event list.Click Convenient Operation to edit, copy, delete and batch delete events, so that you can quickly manage events.
explain:
To avoid the invalidation of historical monitoring data, the event name and event level cannot be modified after the event is added. Please plan reasonably.
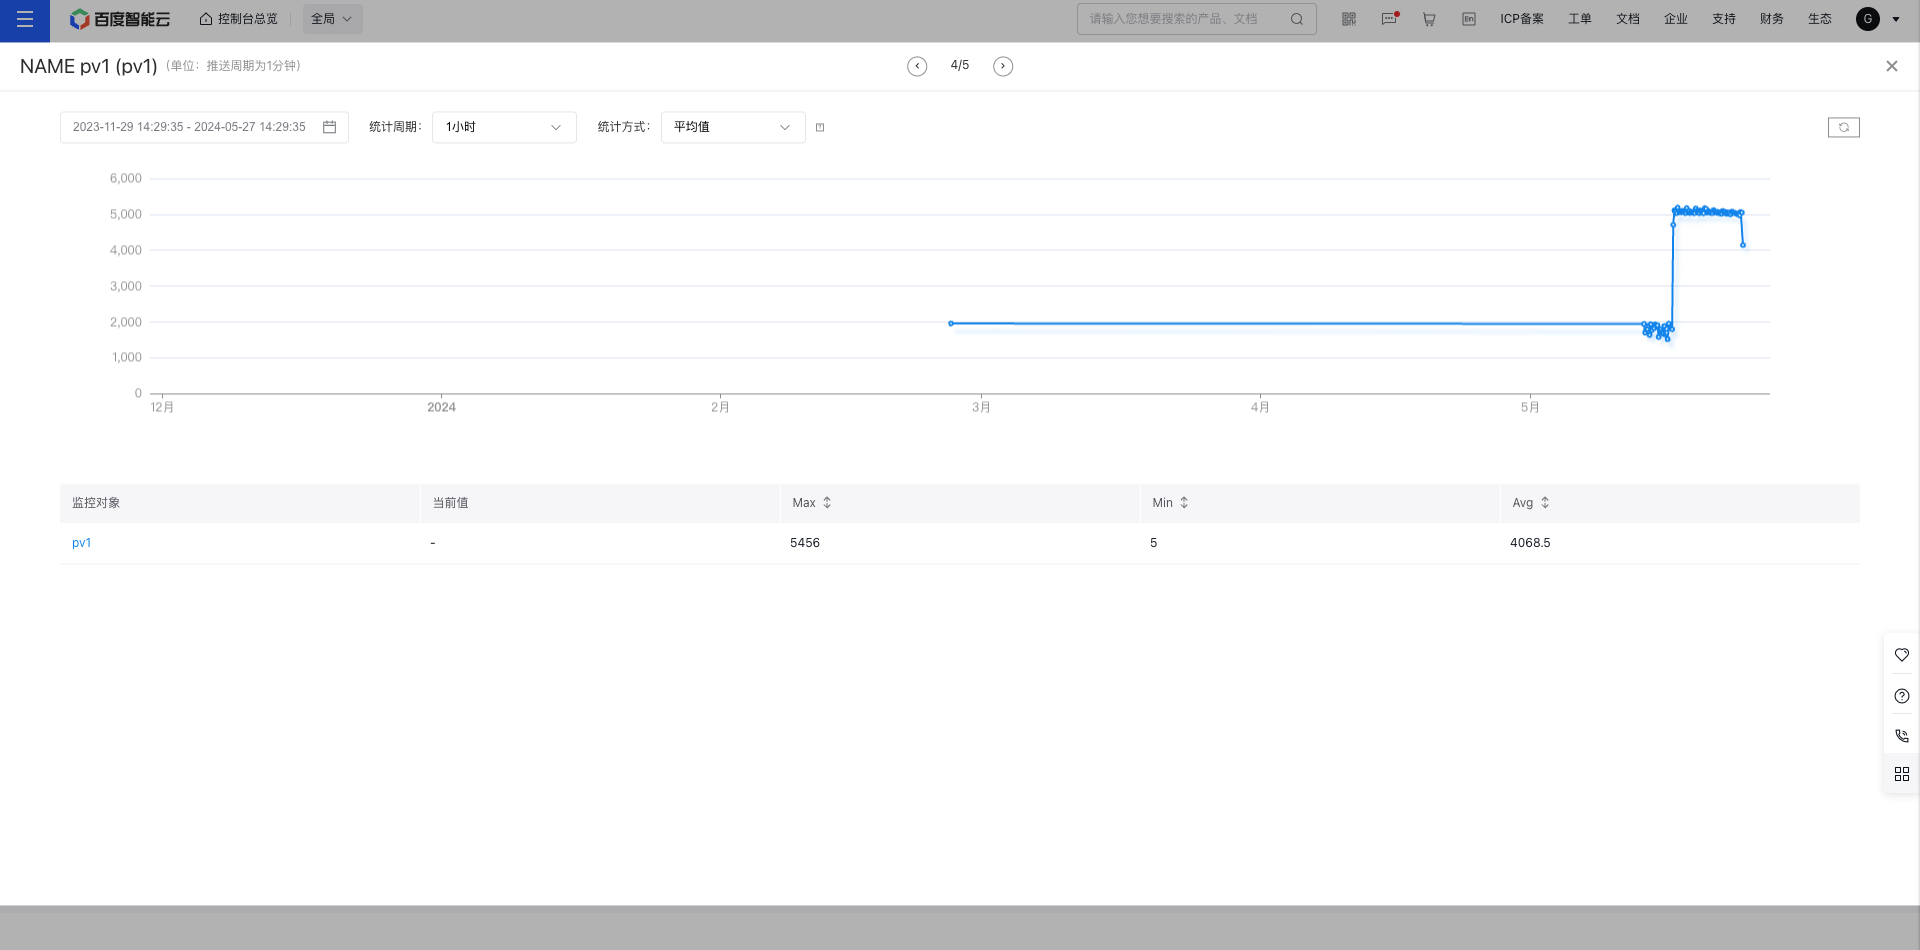
Enter the cloud monitoring platform, click<Custom Monitoring>-><Namespace Name>in the left navigation bar to enter the index list page of the namespace.Click the indicator name to view the monitoring data of the indicator.You can click the left and right sliding buttons at the top of the center to realize quick switch of indicators, so that you can improve the efficiency of viewing monitoring data.
View event monitoring data
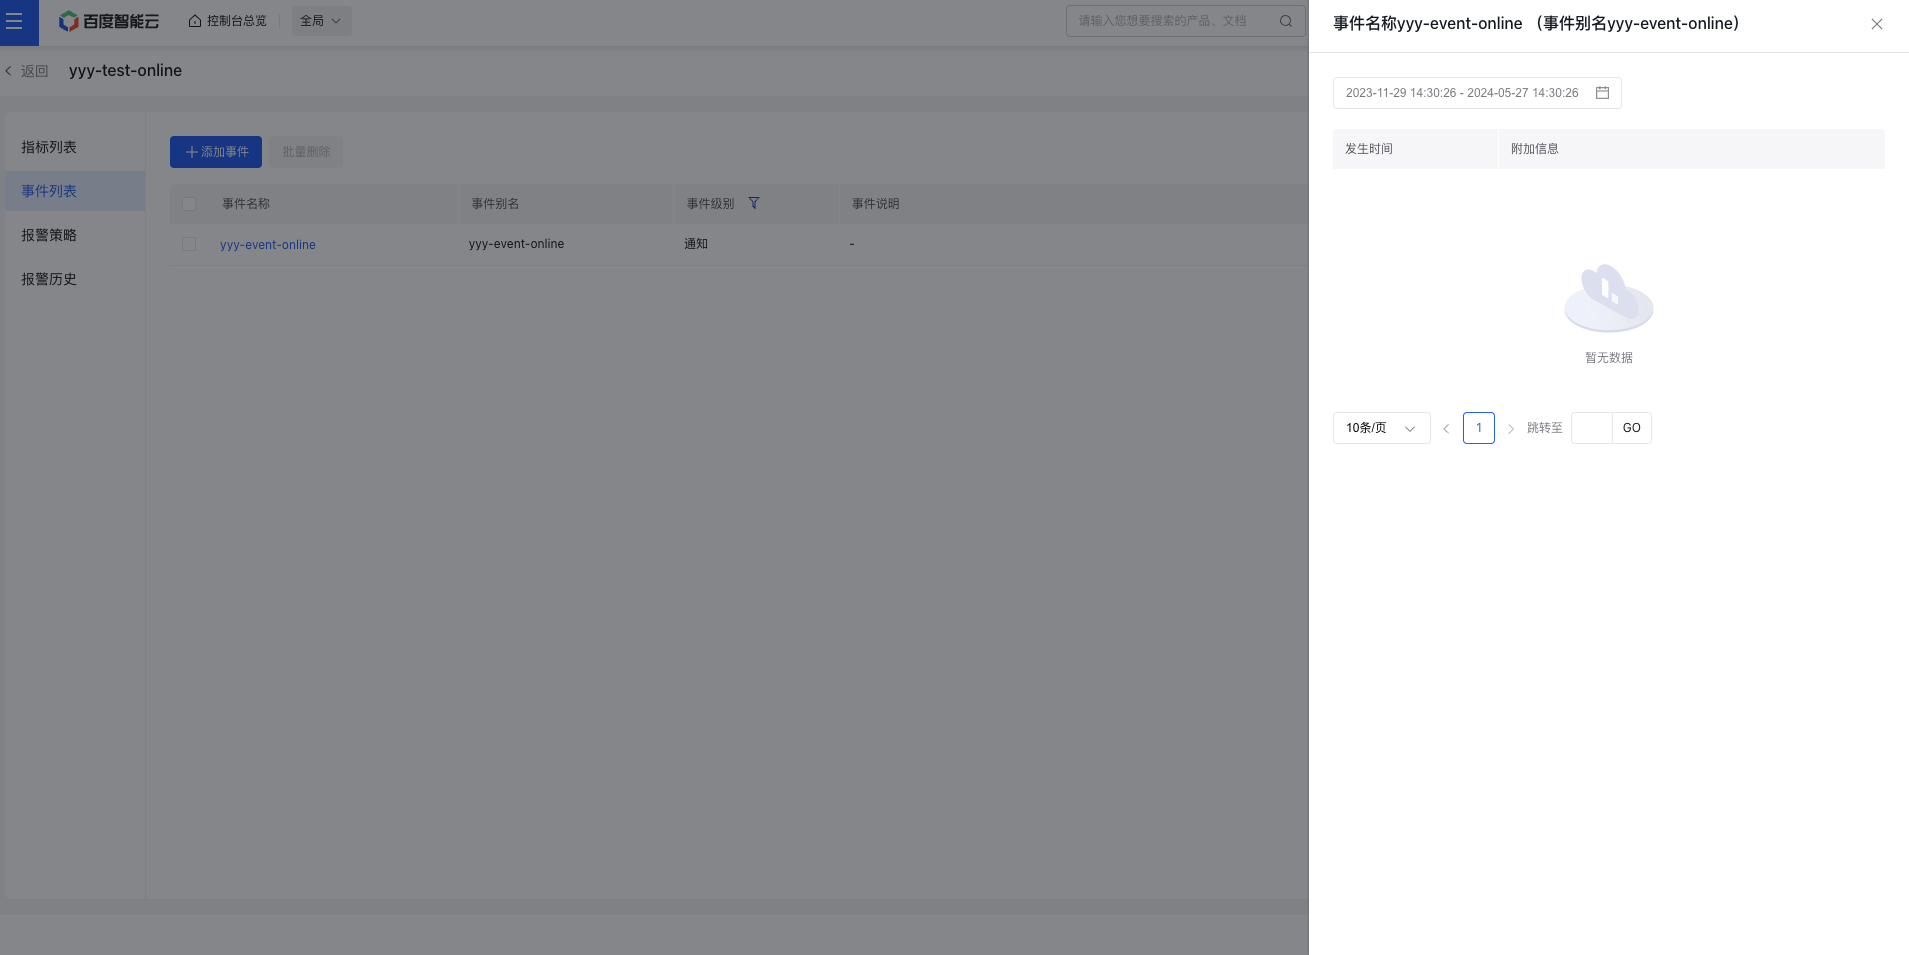
Enter the cloud monitoring platform, click<Custom Monitoring>-><Namespace Name>in the left navigation bar to enter the index list page of the namespace.In the secondary navigation, click<Event List>and click the event name to view the monitoring data of the event.
Alarm management
Alarm strategy
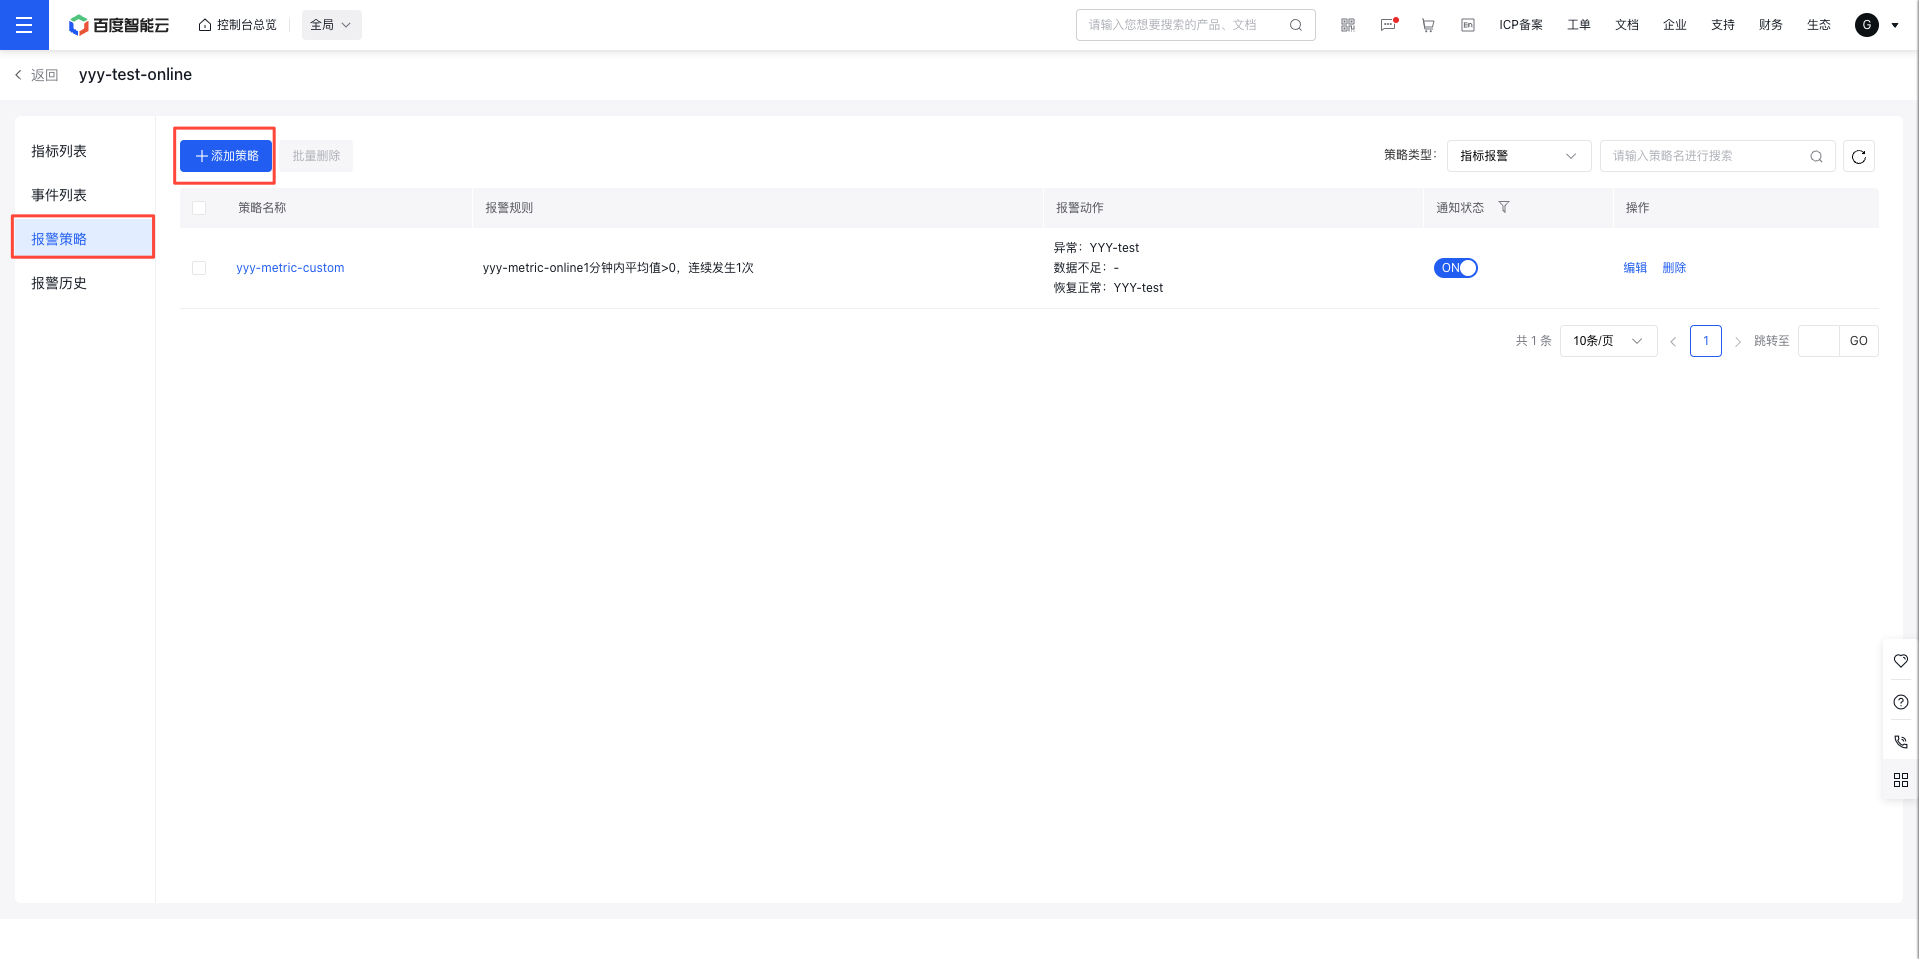
Method 1: You can navigate and click Alarm Strategy on the secondary side of a namespace to enter the alarm strategy page.On this page, you can add, view, edit, and delete alarm policies for monitoring indicators and monitoring events of the namespace.It is convenient for you to manage alarms in a business dimension.
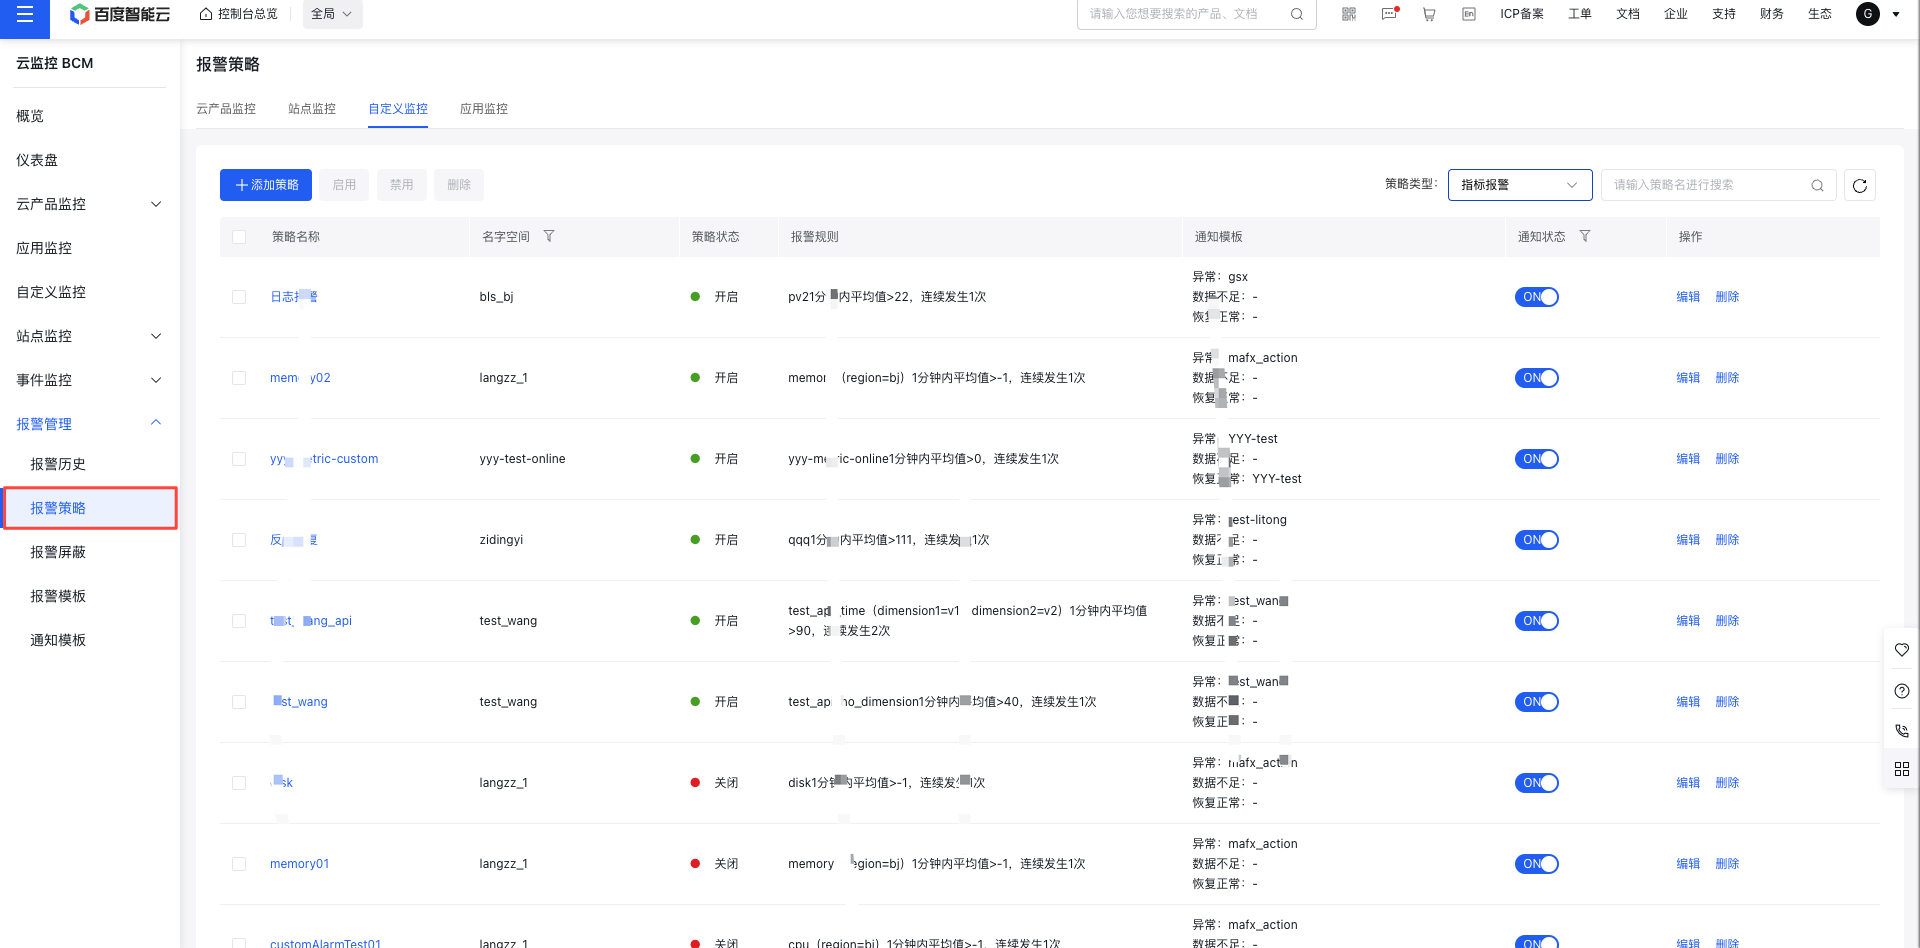
Method 2: You can click Alarm Strategy on the global Alarm Management portal to enter the global alarm strategy page.Manage alarm policies in the global dimension.
Alarm history
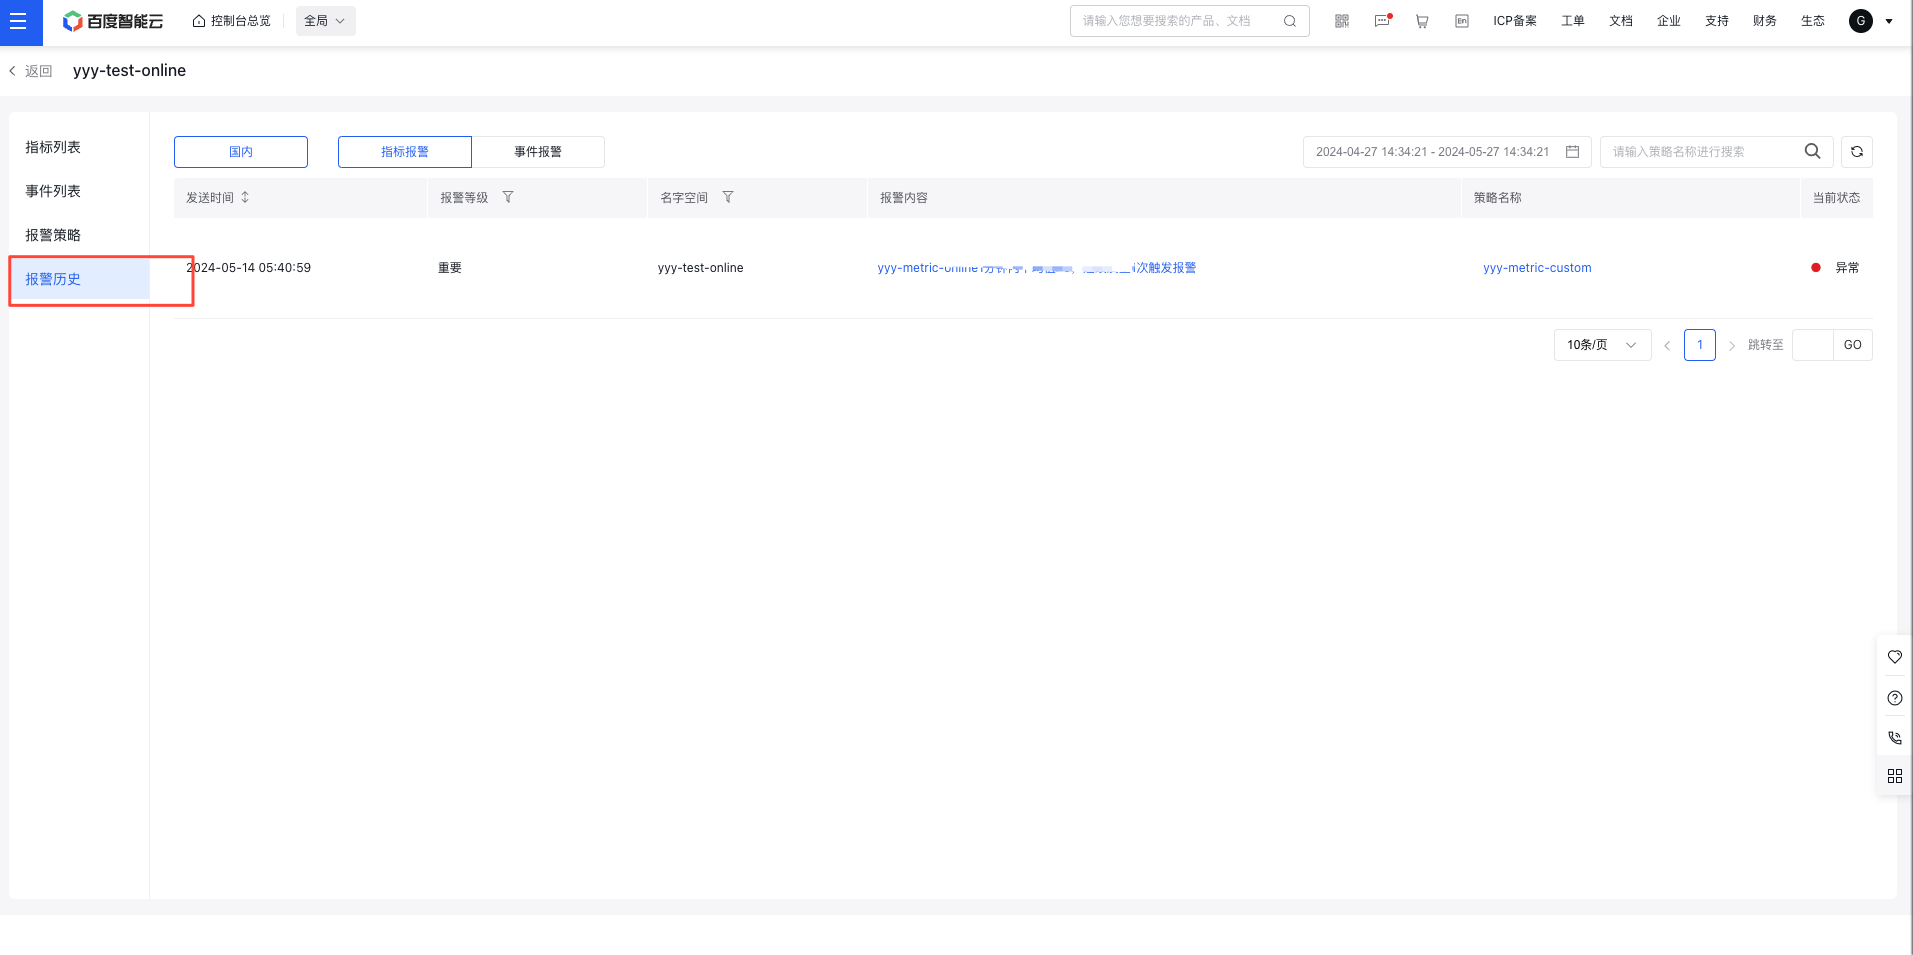
Method 1: You can navigate and click Alarm History on the secondary side of a namespace to enter the alarm history page.View and analyze the alarm history of the namespace on this page.
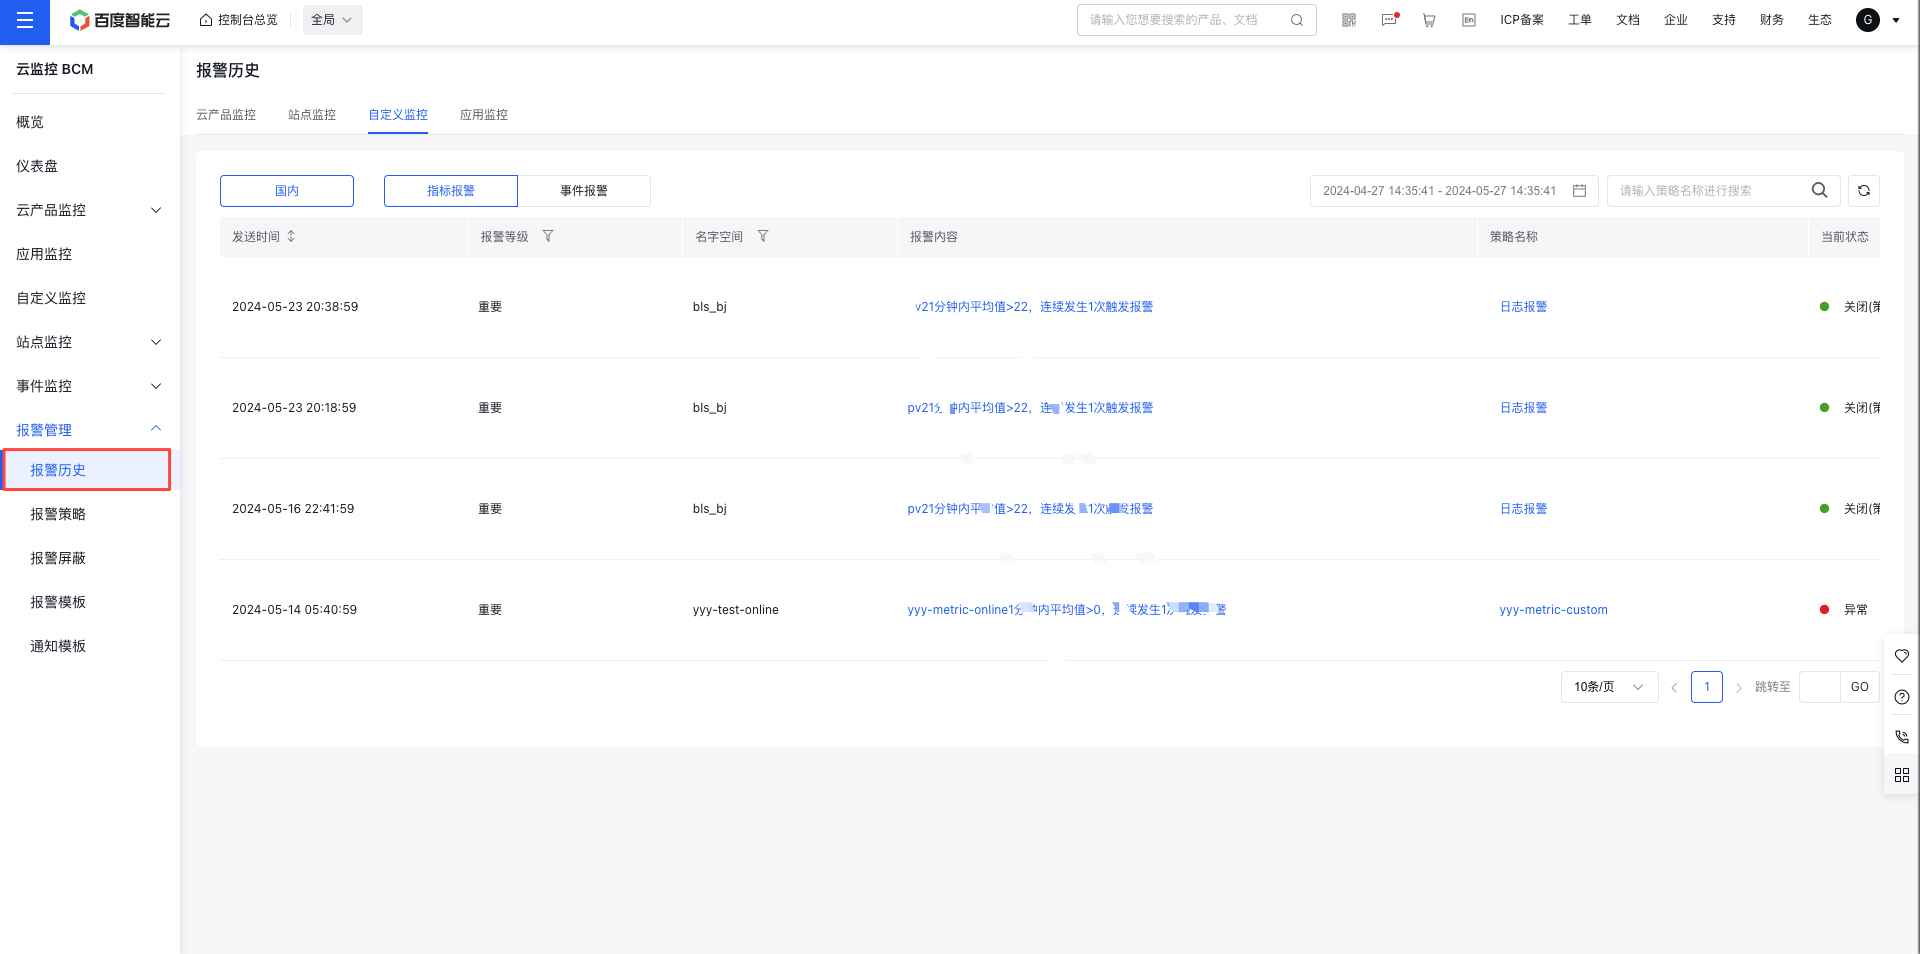
Method 2: You can click Alarm History at the global "Alarm Management" entry to enter the global alarm history page.Manage alarm history in the global dimension.