1557912727 Query Monitor Compressor Compressor

A necessary tool for optimizing WordPress performance: Query Monitor

use WordPress builds website Most of our friends will encounter the situation that the website opens slowly, and they don't know why WordPress opens slowly, so they left the pot to WordPress, thinking that WordPress is too bloated, and turned to lightweight blog systems such as Typecho.

So my father recommends one for you here WordPress plug-in :Query Monitor

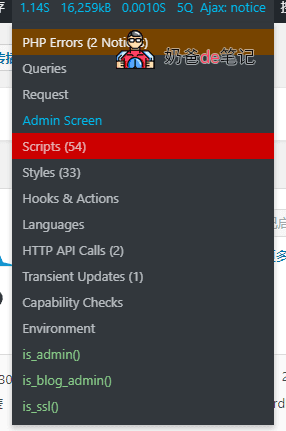
Introduction to the Query Monitor plug-in

Query Monitor is the developer tool panel of WordPress. It supports debugging database queries, PHP errors, hooks and operations, block editor blocks, queuing scripts and style sheets, HTTP API calls, and so on.

It includes some advanced functions, such as debugging Ajax calls, REST API calls, and user function checks. It includes the ability to narrow most of its output through plug-ins or themes, allowing you to quickly identify poorly performing plug-ins, themes, or features.

Query Monitor mainly focuses on presenting its information in a useful way, such as by displaying aggregate database queries grouped by plug-ins, topics or functions responsible for them. It adds a management toolbar menu to display the overview of the current page. Once you select a menu item, the complete debugging information will be displayed in the panel.

The above is an official introduction from Query Monitor. Ordinary users may feel a little confused, so the following daddy will demonstrate the use of Query Monitor

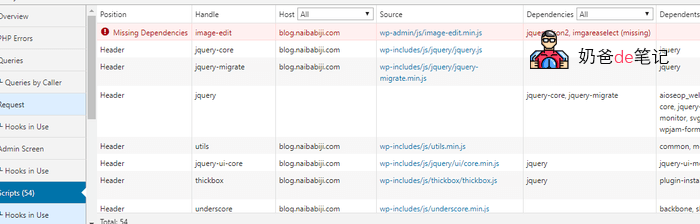
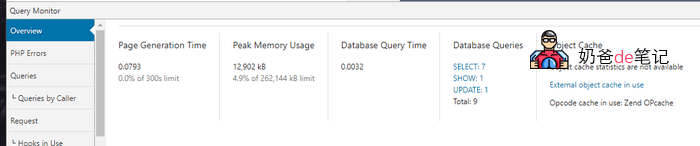
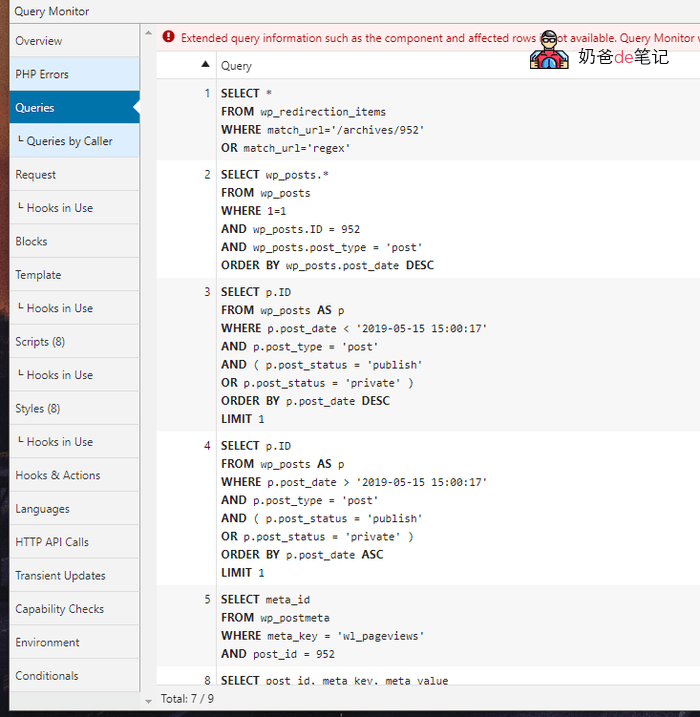
Use of Query Monitor

First, from WordPress The Query Monitor is installed and enabled in the background.

 Query Monitor Instructions

After enabling, you will see an additional indicator bar like the following image on the top adminbar.

 Query Monitor Instructions

The indicator bar is red, which indicates that there is an error in the web page. Move the mouse up and the error content will be displayed in red. Click in to see the details, and you can find out where the problem is.

 Query Monitor Instructions

Of course, judging this error still requires some judgment ability. For example, the error reported by the father seems to be an error in picture editing, because the father installed Shoot the clouds again The plug-in takes over the function of the media library, so it is estimated that error reporting is the problem here and can be ignored.

 Query Monitor Instructions

Usually, we give WordPress optimization That is, use the cache plug-in to cache pages, and then optimize and cache database queries. You can see the number of database queries in the Overview interface of Query Monitor.

 Query Monitor Instructions

The daddy's page has queried the database for 9 times in total. From the details page, we can roughly see which queries can be cancelled. It is OK to delete the corresponding plug-ins.

 Query Monitor Instructions

Of course, for Xiaobai users, it may still be difficult to optimize WordPress. One of the most direct suggestions from my father is to choose simple themes as far as possible and not add too many functions. Do not install plug-ins if they are not necessary.

Then install a WP Super Cache, the server installs the Memcached cache, and the previous one Another picture of cloud free CDN acceleration , basically there is no need to optimize, and it will be soon.

Query Monitor download address

If you are a foreign server, you can search Query Monitor directly from the WordPress background plug-in library for installation.

If you are a domestic server, you can download it through the following link and upload it to the website background for installation.

Download on official website   Online disk download

This is the 14th/20th article in the series: WordPress optimization

5/5 - (1 vote)
Scroll to top