IELTS Writing Sample Essay IELTS Writing Line Chart (Line Chart) British Children's Movement
Today we IELTS Writing Write a sample essay to study the lower line graph (line graph). The first chart shows the amount of money British parents spent on their children's sports between 2008 and 2014. The second chart shows the number of British children participating in three sports during the same time period. Although this topic is composed of two charts, they are both line charts and simple graphs. Old Roast Duck Xiaobian has collected a relevant model essay for examiners for your reference.
IELTS Writing Essay Title
The first chart below gives information about the money spent by British parents on their children’s sports between 2008 and 2014. The second chart shows the number of children who participated in three sports in Britain over the same time period.
Summarise the information by selecting and reporting the main features, and make comparisons where relevant.
Sample Essay for IELTS Writing
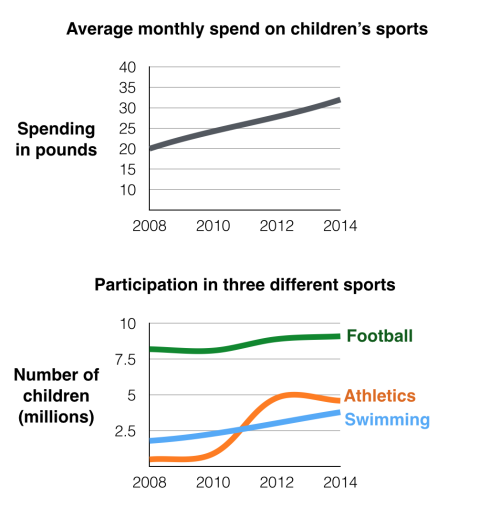
The line graphs show the average monthly amount that parents in Britain spent on their children’s sporting activities and the number of British children who took part in three different sports from 2008 to 2014.
The line chart shows the average monthly money spent by British parents on their children's sports activities, and the number of British children who participated in three different activities from 2008 to 2014.
It is clear that parents spent more money each year on their children’s participation in sports over the six-year period. In terms of the number of children taking part, football was significantly more popular than athletics and swimming.
Obviously, in the past six years, parents have spent more and more money on their children's sports every year. As for the sports that children participate in, football is obviously more popular than gymnastics and swimming.
In 2008, British parents spent an average of around £20 per month on their children’s sporting activities. Parents’ spending on children’s sports increased gradually over the following six years, and by 2014 the average monthly amount had risen to just over £30.
In 2008, British parents spent an average of about 20 pounds a month on their children's sports activities. Over the next six years, parents' spending on children's sports gradually increased and decreased. By 2014, the average monthly cost had exceeded 30 pounds.
Looking at participation numbers, in 2008 approximately 8 million British children played football, while only 2 million children were enrolled in swimming clubs and less than 1 million practiced athletics. The figures for football participation remained relatively stable over the following 6 years. By contrast, participation in swimming almost doubled, to nearly 4 million children, and there was a near fivefold increase in the number of children doing athletics.
Let's look at participation. In 2008, about 8 million British children played football, while only 2 million children participated in swimming clubs, and less than 1 million children practiced gymnastics. In the next six years, the number of children playing football remained basically unchanged. In contrast, the number of children who chose to swim almost doubled to nearly 4 million. The number of children practicing gymnastics has increased nearly five times.