Sample Essay of IELTS Writing Line Chart (Line Chart) Proportion of Elderly Population
Today we IELTS Writing Write a sample essay to study the lower line graph (line graph). This chart shows the proportion of people over 65 years old in the United States, Japan and Sweden, and their changes from 1940 to 2040. Old Roast Duck has collected a corresponding sample essay for examiners for your reference.
IELTS Writing Essay Title
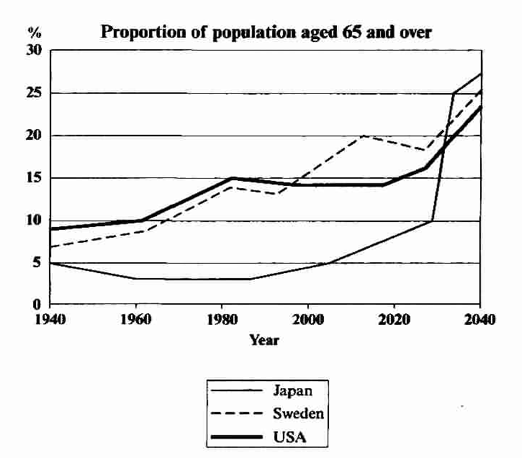
The graph below shows the proportion of the population aged 65 and over between 1940 and 2040 in three different countries.
Summarise the information by selecting and reporting the main features, and make comparisons where relevant.
Sample Essay for IELTS Writing
The line graph compares the percentage of people aged 65 or more in three countries over a period of 100 years.
The line chart compares the proportion of people over 65 years old in three countries in a decade.
It is clear that the proportion of elderly people increases in each country between 1940 and 2040. Japan is expected to see the most dramatic changes in its elderly population.
It is clear that the proportion of older people in every country is rising between 1940 and 2040. Among them, the elderly population in Japan has risen most rapidly.
In 1940, around 9% of Americans were aged 65 or over, compared to about 7% of Swedish people and 5% of Japanese people. The proportions of elderly people in the USA and Sweden rose gradually over the next 50 years, reaching just under 15% in 1990. By contrast, the figures for Japan remained below 5% until the early 2000s.
In 1940, about 9 percent of Americans were over 65, 7 percent in Sweden and 5 percent in Japan. Over the next 50 years, the proportion of the elderly population in the United States and Sweden gradually increased. In 1990, it reached almost 15 percent. By contrast, Japan's data remained below 5 percent until the beginning of the 21st century.
Looking into the future, a sudden increase in the percentage of elderly people is predicted for Japan, with a jump of over 15% in just 10 years from 2030 to 2040. By 2040, it is thought that around 27% of the Japanese population will be 65 years old or more, while the figures for Sweden and the USA will be slightly lower, at about 25% and 23% respectively.
Looking ahead, the proportion of Japan's elderly population is expected to rise abruptly. It will increase by more than 15 percentage points in the 10 years from 2030 to 2040. By 2040, it is estimated that about 27% of Japan's population will be over 65 years old. The data of Sweden and the United States will be slightly lower, 25% and 23% respectively.