Sample Essay for IELTS Writing Mix Chart Temperature and Precipitation
Today we IELTS Writing This is a sample essay to study the IELTS writing mix map. This chart is a combination of bar chart and line chart. The bar chart shows the precipitation of a city from January to December, and the broken line chart shows the temperature change during this period. The trends of the two are not completely consistent. The Old Roast Duck Editor has collected a corresponding model article. Please refer to how the examiner selects data and compares them.
IELTS Writing Essay Title
The climograph below shows average monthly temperatures and rainfall in the city of Kolkata.
Summarise the information by selecting and reporting the main features, and make comparisons where relevant.
Sample Essay for IELTS Writing
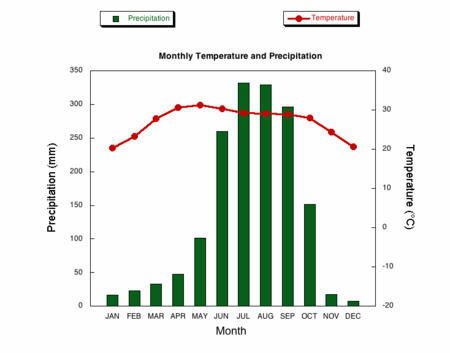
The chart compares average figures for temperature and precipitation over the course of a calendar year in Kolkata.
This chart compares the average data of temperature and rainfall in Calcutta in a year.
It is noticeable that monthly figures for precipitation in Kolkata vary considerably, whereas monthly temperatures remain relatively stable. Rainfall is highest from July to August, while temperatures are highest in April and May.
Obviously, the monthly precipitation data in Calcutta vary greatly. The temperature of each month is relatively stable. From July to August, rainfall is the highest, while April and May have the highest temperature.
Between the months of January and May, average temperatures in Kolkata rise from their lowest point at around 20°C to a peak of just over 30°C. Average rainfall in the city also rises over the same period, from approximately 20mm of rain in January to 100mm in May.
During January and May, the average temperature in Calcutta rose from the lowest 20 degrees to the peak of just over 30 degrees. The average precipitation in the city also increased in the same period, from about 20 mm in January to an average of 100 mm in May.
While temperatures stay roughly the same for the next four months, the amount of rainfall more than doubles between May and June. Figures for precipitation remain above 250mm from June to September, peaking at around 330mm in July. The final three months of the year see a dramatic fall in precipitation, to a low of about 10mm in December, and a steady drop in temperatures back to the January average. (173 words, band 9)
Although the temperature remained roughly the same in the next four months, the precipitation more than doubled between May and June. From July to September, the precipitation data remained above 250 mm, and reached the peak of 330 mm in July. Precipitation fell sharply in the last three months of the year, reaching a low point of about 10mm in December. At the same time, the temperature also dropped steadily back to the average level in January (173 words in total).