Sample Essay for IELTS Writing Bar Chart Number of Prisons
Today we IELTS Writing The article of the model composition is used to study the bar chart. The chart shows the number of people put into prison in five countries (Great Britain, Australia, New Zealand, the United States, Canada) between 1930 and 1980. Note that the unit of data displayed in the chart is 1000. Don't make a mistake. In addition, the chart gives more data, which tests your ability to compare in groups. Old Roast Duck has collected a related high score model essay for your reference.
IELTS Writing Essay Title
The table below shows the figures (in thousand) for imprisonment in five countries between 1930 and 1980.
Summarise the information by selecting and reporting the main features, and make comparisons where relevant.
Sample Essay for IELTS Writing
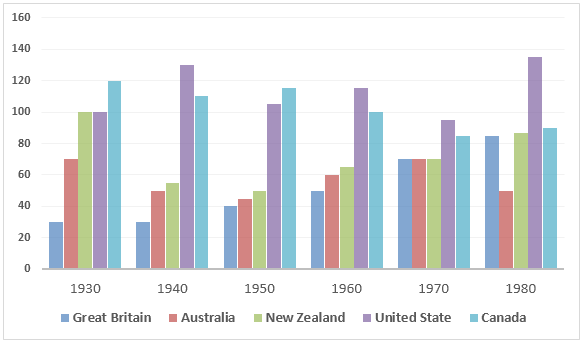
The table chart compares the numbers of prisoners from 1930 to 1980 in five different countries, namely Great Britain, Australia, New Zealand, the United States, and Canada. At a glance at the graph reveals that imprisonment figure in the USA and the UK climbed over the period and in Canada, Australia, New Zealand, it actually declined.
The table compares the number of prisoners in five different countries from 1930 to 1980. The five countries are Great Britain, Australia, New Zealand, the United States and Canada. At a glance, the chart shows that during this period, the number of prison inmates in the United States and Britain has increased, while the number of prison inmates in Canada, Australia and New Zealand has actually decreased.
It is clearly seen that the United States had the highest number of inmates. Also, Britain had the lowest figure in 4 out of 6 years. This translation is from Laokaoya website. In 1930, the number of prisoners in the United States was the highest, with 120 thousand prisoners, then this number increased significantly to reach a peak of 140 thousand in 1980. By contrast, Britain had the lowest figure of prisoners until 1970, then the figure jumped suddenly to reach 90 thousand.
It is obvious that the United States has the largest number of prisoners, while Britain has the smallest number of prisoners in four of these six years. In 1930, the number of prisoners in the United States was the highest, about 120000. Subsequently, the number increased significantly, reaching a peak of 140000 in 1980. In contrast, the number of British prisoners was the lowest until 1970, when it suddenly rose to 90000.
Canada had the highest number of imprisonment in 1930 and 1960 with nearly 140 thousand people each year. In 1970 the number of prisoners in Great Britain, New Zealand and Australia was the same, about 70 thousand people. In 1980, 50 thousands of people in New Zealand were put in prison which was the lowest figure in this year.
The number of prisoners in Canada peaked in 1930 and 1960, reaching almost 140000 a year. In 1970, the number of prisoners in Great Britain, New Zealand and Australia was the same, about 70000. In 1980, 50000 people in New Zealand were put into prison. This figure is the lowest in the year.