to configure Elasticsearch Heap Dump JVM
During normal development, testing, and even production environments, OutOfMemoryError is sometimes encountered, and the Java heap overflows, which indicates that there is a serious problem with the program. We need to find the cause of the memory problem. There are generally two situations:
1. Memory leaks. The object is dead and cannot be automatically recycled through the garbage collector. The solution can be determined by finding out the location and cause of the leaked code;
2. Memory overflow means that the objects in memory must still be alive, which indicates that the Java heap allocation space is insufficient. Check the heap setting size (- Xmx and - Xms), and check whether the code has too long object life cycle and too long holding time.
The above is the idea of dealing with the Java heap problem. Here we take Elasticsearch as an example to debug the heap dump of the JVM of es under the CentOS system.
Main process:
1. Use jmap to dump out the heap dump of the service
2. Use MAT to view the heap dump
The following is the record of pit filling.
Tool installation
It mainly needs jmap and MAT (Memory Analysis Tool).
1. Install jmap
sudo yum install java-1.8.0-openjdk-devel-debug
Jmap is one of the jdk tool chains. Generally, the service that needs to be debugged will use the tool chain of the version of the jdk that is running. For example, the java 1.8.0 jdk will use 1.8.0.
2. Install MAT
MAT (Memory Analyzer Tool), an Eclipse based memory analysis tool, is a fast, feature rich Java heap analysis tool that can help us find memory leaks and reduce memory consumption. Use the memory analysis tool to analyze from many objects, quickly calculate the occupied size of objects in memory, see who is preventing the garbage collector from collecting, and visually view the objects that may cause this result through the report.
Select different versions according to their respective desktop systems, and configure the java sdk bin environment variable to directly open it for use.
Download address: https://www.eclipse.org/mat/downloads.php
Use Configuration
1. Get the main process number of es
[ liuzexu@gz-52-175 ~]$ systemctl status elasticsearch ● elasticsearch.service - Elasticsearch Loaded: loaded (/usr/lib/systemd/system/elasticsearch.service; enabled; vendor preset: disabled) Drop-In: /etc/systemd/system/elasticsearch.service.d └─override.conf Active: active (running) since III 2018-09-12 02:08:28 CST; 1 day 9h ago Docs: http://www.elastic.co Main PID: 144765 (java) CGroup: /system.slice/elasticsearch.service └─144765 /bin/java -Xms31g -Xmx31g -XX:+UseConcMarkSweepGC -XX:CMSInitiatingOccupancyFraction=80 -XX:+UseCMSInitiatingO... September 12 02:08:28 gz-52-175 systemd [1]: Started Elasticsearch September 12 02:08:28 gz-52-175 systemd [1]: Starting Elasticsearch
among Main PID: 144765 (java) Of one hundred and forty-four thousand seven hundred and sixty-five It is the main process number.
2. Use jmap
Output in binary mode, output to /tmp/es-heap.hprof , where {PID} Change to one hundred and forty-four thousand seven hundred and sixty-five Can
sudo -u elasticsearch jmap -dump:format=b,file=/tmp/es-heap.hprof {PID}
output hprof During the process, the current es process will be kept in a blocked state and no longer work. Please be sure to do it in a time that does not affect business, such as late at night.
Hypothetical output hprof It usually takes 1 minute for the size of 22G.
3. Using MAT
If es-heap.hprof If it is larger than 1G, the MAT configuration needs to be changed to support reading large files. MATs in different environments are configured in different ways. The following is an example of Eclipse Memory Analyzer in Windows x64.
In the software directory, open Edit MemoryAnalyzer.ini , found -Xmx1024M , change to hprof Size, for example hprof 20G, changed to -Xmx20g 。 Save after modification. Restart MAT, and it can be opened smoothly hprof 。
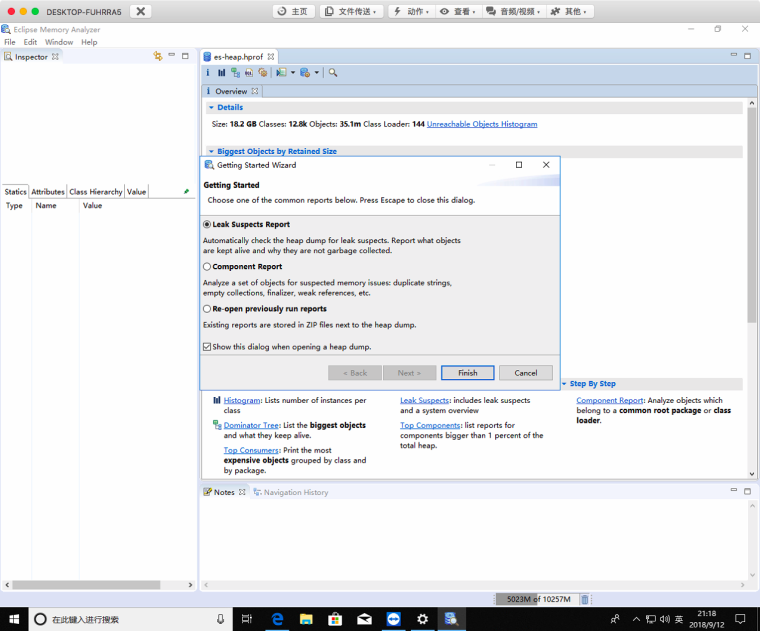
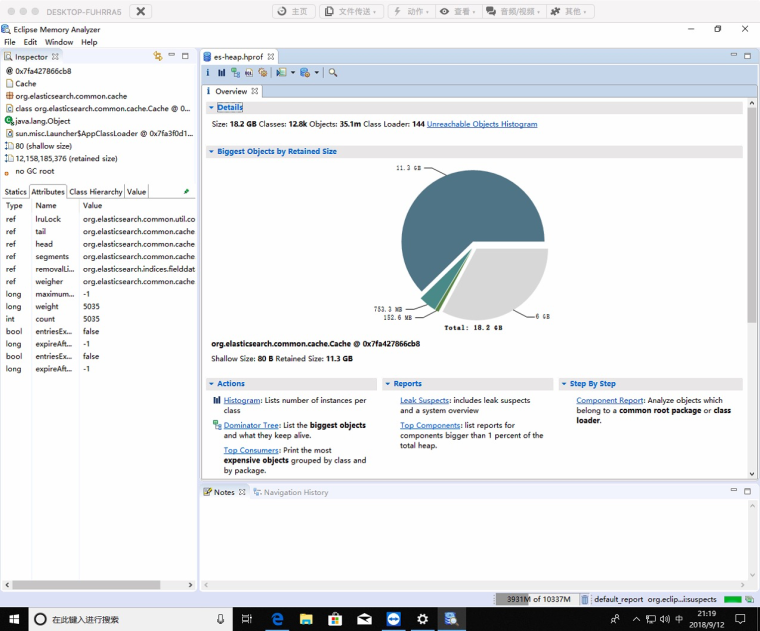
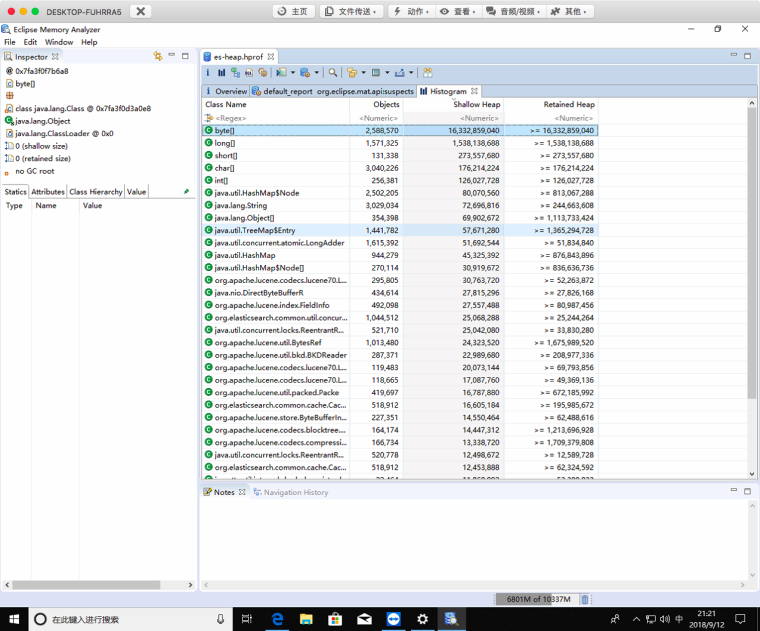
The following is an example after opening:
Then you can happily view various situations of heap.
This is the end of the tutorial.
This article is written by Chakhsu Lau Creation, adoption Knowledge Sharing Attribution 4.0 International License Agreement.
All articles on this website are original or translated by this website, except for the reprint/source. Please sign your name before reprinting.


