For most Linux VPS and server users, we may directly install a panel and a one button package for the purpose of building a website. In addition, the data is backed up regularly, and there is no special use for others. However, for some friends who play O&M, server monitoring is useful. For example, many O&M professionals will use tools such as zabbix, and others will use third-party monitoring tools.
There are still many tools and applications on Linux, especially some open source gadgets. I want to play with them sometimes. Lao Zuo has played pyDash before( Install the pyDash web-based Linux performance monitoring tool ), which is also a self built Linux server monitoring tool. To be honest, the installation of this tool is a little troublesome. I saw it today linux-dash Open source tools are relatively simple, and can be installed directly in the web environment by git.
Although it seems to be of little use, as a small tool, let's play with it. Somehow, if you need to brag in the future, you will know this tool.
First, official website
Tool official: https://github.com/afaqurk/linux-dash
II. Installation preparation conditions
According to the introduction, the Linux dash monitoring tool only needs to run in the WEB environment. In this article, the test machine on the old left hand is the installed pagoda panel. There is just a WEB environment, so you can directly find a directory to install it.
Linux dash does not need special compilation. It can be deployed directly in the corresponding site directory when git downloads the script, similar to a direct program.
II. Installation method
git clone https://github.com/afaqurk/linux-dash.git
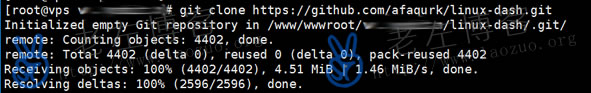
Download the script directly, and then open it in the corresponding directory/IP address of our website.
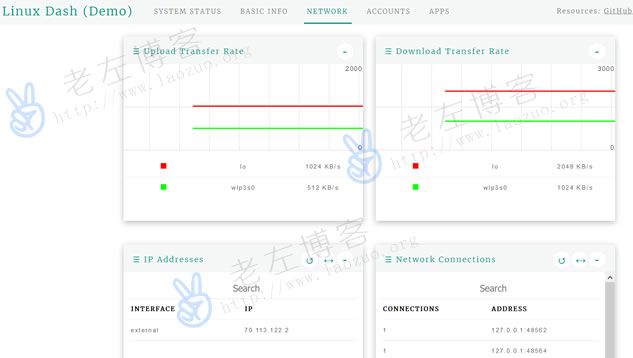
Here we can see that the Linux dash monitoring tool has CPU, memory, upload, download rate and other parameters.

Scan the code to follow the official account
Get more news about webmaster circle!
Entrepreneurship, operation and new knowledge