Observable monitoring Prometheus version
As a cloud native indicator monitoring platform, the observable monitoring Prometheus version is fully compatible with the Prometheus open source ecosystem, providing a one-stop indicator observation platform for different roles, such as operation and maintenance engineers and SRE engineers, to meet the monitoring and alarm needs of business customized monitoring/application component monitoring/cloud service monitoring/container monitoring/system monitoring and other scenarios.

Annual/monthly limited time special

"Monthly subscription" must first open pay as you go instance creation
The fully hosted monitoring service built on the open source Prometheus integrates common cloud services by default and is compatible with open source components. It provides Grafana Kanban and intelligent alarm services to help enterprises quickly build a monitoring system
Instance Type
Container service
Capacity specification
Small size
Storage time
1 month
Click Buy Now to get the latest price

Product advantages

Compared with the open source version of Prometheus, the performance is improved by 20 times, and the operation and maintenance costs are effectively reduced by more than 90%
Better performance
The data collection performance is 20 times higher than that of the open source version
Support second level query of long time interval data
Lower cost
Full custody service, operation and maintenance cost reduced by 90%
Pay according to the quota, and provide a large number of free indicators
Higher availability
Support acquisition of multiple copies for scale out
Cloud distributed storage ensures data reliability
Open source full compatibility
Fully compatible with Prometheus open source ecosystem
Support rich component monitoring

Product Functions

Specialized container extends to the whole stack observation, creating an integrated indicator observation market
Coverage business monitoring/application component monitoring/cloud service monitoring/container monitoring/system monitoring
System level indicator observation
Such as CPU, memory, disk, I/O and other basic indicators
Cloudy and multi cluster indicator observation
For example, Alibaba Cloud cluster container cluster, ECS cluster, non Alibaba Cloud cluster, etc
Vessel layer index observation
Deep integration with Alibaba Cloud container service ACK, free basic indicators
Cloud service indicator observation
Such as database, message queue, microservice, storage and other cloud services
Application component layer (self built) indicator observation
Self built application components such as middleware, database, message queue, etc
Application performance index observation
Deep integration with ARMS application monitoring/front-end monitoring, and support of OpenTelemetry standard
Business user-defined indicator observation
Such as transaction rate, order placement rate, user opening rate and other user-defined indicators
Grafana Kanban Enhancement
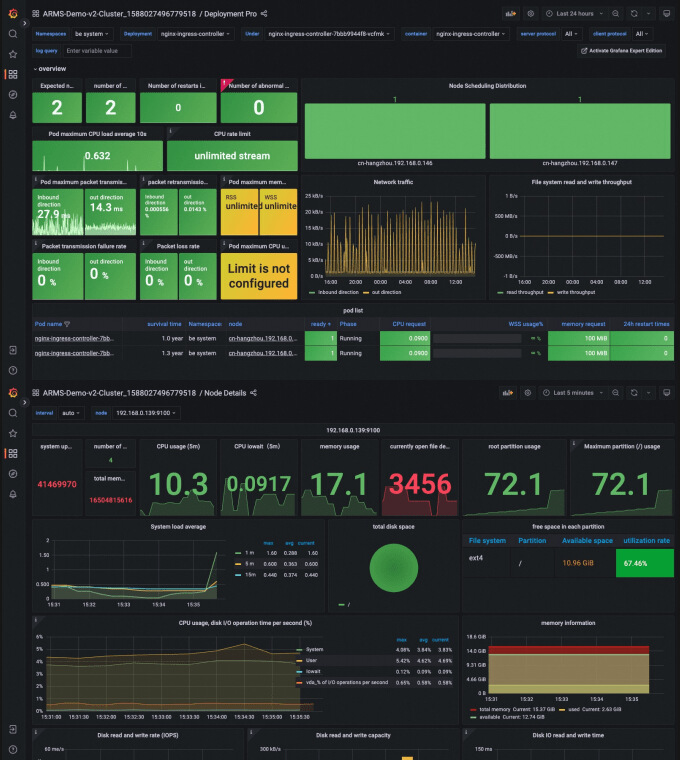
One click access to various monitoring markets and alarms
Preset Kanban templates for common cloud services and application components
Provide data source configuration and preset market of various cloud services, and realize unified display of various observable data
Grafana plug-in free extension
Add new plug-ins, new visual templates and data sources freely through the official Grafana to further meet the personalized O&M monitoring needs
Provide Pro template for mainstream services such as container service ACK
For mainstream cloud services such as container service ACK and message queue Kafka, provide Grafana Pro market to help operation and maintenance carry out more refined indicator observation
More secure authority management system
Get through to AliCloud account system SSO (primary and sub accounts), and support AliCloud user permission control RAM
Intelligent alarm management enhancement
Fault processing collaboration efficiency is improved, and alarm accuracy is effectively improved
Multi channel data push
Support 10+monitoring data sources such as nailing, email, SMS and Webhook to ensure timely access
Alarm collaboration improves collaboration efficiency
ChatOps based on nails, with the help of alarm management, alarm records, and history review, makes alarms collaborative, traceable, and statistical
Intelligent noise reduction
Provide algorithm capabilities such as exception check and intelligent noise reduction to effectively reduce invalid alarms
Alarm root cause analysis
Alarm root cause analysis based on application context to improve fault location efficiency
Multi instance global aggregation query
Global unified aggregation query, unified Grafana data source, unified alarm and other capabilities
Comparison between Alibaba Cloud Observable Monitoring Prometheus and Open Source Self built
Contrast item
Alibaba Cloud Observable Monitoring Prometheus
Self built Prometheus monitoring
Resource purchase&system construction
Alibaba Cloud full hosting
Purchase relevant resources and deploy the system
Operation and maintenance cost
Operation and maintenance free
Daily self operation and maintenance
High availability
It supports the collection of multiple copies of storage components, can be horizontally expanded, and has high availability
Single process, unable to scale horizontally, low availability
Data access
One click access to common cloud services, covering mainstream application components such as databases and middleware, as well as applications built by mainstream programming languages such as Java/Go, and supporting agent free installation monitoring of ECS cluster middleware
Create the Exporter of the corresponding component to complete data access
data storage
Based on cloud storage, the storage capacity is unlimited
Limited by storage capacity
Data visualization
Built in Grafana, all kinds of common monitoring templates are ready for use out of the box
Grafana needs to be deployed separately and Kanban needs to be configured
alarm management
Integrated ARMS alarm center to comprehensively improve alarm efficiency and accuracy
Self access to Alertmanager plug-in
Single copy acquisition performance (2C4G)
600w data point
100w data point
Data query performance (600 million time points)
8~10s
180s
security management
Alibaba Cloud's security capabilities are fully enhanced, and authentication functions are supported
I won't support it
Other capabilities
Support pre aggregation, downsampling and other capabilities
I won't support it

Application scenarios

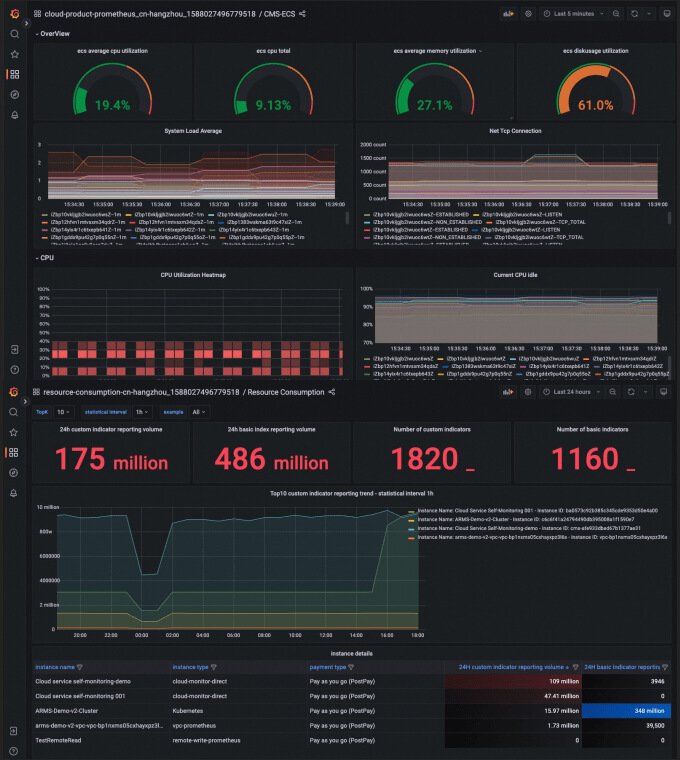
Cloud service unified indicator observation
Vessel layer index observation
Application performance index observation
Multi cloud application component indicator observation
Business user-defined indicator observation
Cloud service unified indicator observation
The observable monitoring Prometheus version provides the cloud product monitoring function, unifies the display, query and alarm of many cloud service indicator data, and provides a more convenient daily operation and maintenance observation interface for the operation and maintenance team. At present, more than 50 cloud services have been accessed and continue to increase.
Observation object
Learn more>
Vessel layer index observation
It is deeply integrated with Alibaba Cloud container service ACK, and can be started during container cluster configuration. It provides workload performance monitoring, ingress performance monitoring, CoreDNS performance monitoring and other components for the container, and provides dedicated observation of the large market coverage container services, application components, cloud services and application own observation indicators, and synchronizes cloud resource tags to display business dimension monitoring data.
Observation object
Learn more>
Application performance index observation
Integrate with the application real-time monitoring service ARMS, access the application performance observation indicators with one button, and preset the application performance indicator observation market. It also supports service discovery and reports application performance data.
Observation object
Learn more>
Multi cloud application component indicator observation
Provide corresponding exporter access schemes for third-party cloud/offline IDC centers to meet the observation requirements of component indicators in third-party cloud/offline IDC.
Learn more>
Business user-defined indicator observation
According to business characteristics, set business target indicators, business service quality indicators, technical component indicators, and basic resource indicators. Through indicator customization, configure related capture tasks, and fully display the associated indicators to improve data relevance.
Observation object
Learn more>

More products and services

Application real-time monitoring service ARMS
As an operation and maintenance intelligent monitoring platform oriented to business and cloud native architecture, Application Real Time Monitoring Service (ARMS) provides code level real-time performance and business monitoring for server applications and services. Help enterprises build a full stack of performance monitoring and end-to-end full link tracking and diagnosis, comprehensively covering different operation and maintenance scenarios such as applications, front ends, containers, etc., keep abreast of business health status, shorten fault location time, improve fault location accuracy, and improve user experience and application operation benefits.
Observation link OpenTelemetry version
The OpenTelemetry version of the observable link provides developers of distributed applications with complete tools such as call link restoration, call request statistics, link topology, and application dependency analysis. It can help developers quickly analyze and diagnose performance bottlenecks under the distributed application architecture, and improve the development diagnosis efficiency in the era of microservices.
Observable visual Grafana version
As a cloud native O&M data visualization platform, it provides users with the ability to run free and quickly start the Grafana operating environment. By default, it integrates various Alibaba Cloud service data sources, such as the database MySQL, message queue RockteMQ, real-time computing Flink, Elastic search, observable monitoring Prometheus version, log service SLS, and provides rich data boards, Make the operation and maintenance monitoring more efficient and precise.
Performance test PTS
It supports on-demand initiation of pressure test tasks, and can provide millions of concurrent, tens of millions of TPS traffic initiation capabilities, 100% compatible with JMeter. The provided scene arrangement, API debugging, traffic customization, traffic recording and other functions can quickly create business pressure test scripts, accurately simulate different levels of user access to business systems, and help businesses quickly improve system performance and stability.

Documentation and Tools