Install Docker
Dockers deployment
version: '1.0' services: #Zabbix server container configuration server: image: zabbix/zabbix-server-mysql:latest container_name: zabbix-server depends_on: - mysql - agent environment: TZ: Asia/Shanghai DB_SERVER_HOST: "mysql" MYSQL_DATABASE: "zabbix" MYSQL_USER: "zabbix" MYSQL_PASSWORD: "zabbix_pwd" MYSQL_ROOT_PASSWORD: "root_pwd" ports: - "10051:10051" volumes: - /etc/localtime:/etc/localtime:ro links: - mysql:zabbix-mysql - agent:zabbix-agent user: root networks: zabbixbr: ipv4_address: 172.20.0.6 restart: always #Zabbix agent container configuration agent: image: zabbix/zabbix-agent:latest container_name: zabbix-agent privileged: true ports: - "10050:10050" volumes: - /etc/localtime:/etc/localtime:ro user: root networks: zabbixbr: ipv4_address: 172.20.0.5 restart: always #Zabbix web environment container configuration web: image: zabbix/zabbix-web-nginx-mysql:latest container_name: zabbix-web depends_on: - mysql - server environment: TZ: Asia/Shanghai DB_SERVER_HOST: "mysql" ZBX_SERVER_HOST: "server" MYSQL_DATABASE: "zabbix" MYSQL_USER: "zabbix" MYSQL_PASSWORD: "zabbix_pwd" MYSQL_ROOT_PASSWORD: "root_pwd" volumes: - /etc/localtime:/etc/localtime:ro links: - mysql:zabbix-mysql - server:zabbix-server ports: - "90:80" user: root networks: zabbixbr: ipv4_address: 172.20.0.4 restart: always #MySQL container configuration mysql: image: mysql:5.7 container_name: zabbix-mysql command: --character-set-server=utf8 --collation-server=utf8_general_ci environment: TZ: Asia/Shanghai MYSQL_DATABASE: "zabbix" MYSQL_USER: "zabbix" MYSQL_PASSWORD: "zabbix_pwd" MYSQL_ROOT_PASSWORD: "root_pwd" networks: zabbixbr: ipv4_address: 172.20.0.3 volumes: #Database volume path:/home/data, adjusted according to your own needs - /home/data/zabbix/database/mysql:/var/lib/mysql - /etc/localtime:/etc/localtime:ro restart: always #Grafana Container Configuration grafana: image: grafana/grafana:latest container_name: zabbix-grafana environment: TZ: Asia/Shanghai #Fill in the plug-ins you want to install below, separated by commas. Of course, you can directly upload the plug-ins to the following volume GF_INSTALL_PLUGINS: alexanderzobnin-zabbix-app #Mount the volume for storage and map it to the host directory/var/lib/locker/volumes volumes: #Plug in and Grafana's user configuration data are stored here - grafana-storage:/var/lib/grafana #The grafana.ini configuration file is inside - grafana-etc:/etc/grafana ports: - "3000:3000" networks: zabbixbr: ipv4_address: 172.20.0.2 restart: always #Create containers used in the stack volumes: grafana-storage: grafana-etc: #Stack intranet configuration networks: zabbixbr: driver: bridge ipam: config: - subnet: 172.20.0.0/16 #Intranet gateway gateway: 172.20.0.1
docker pull mysql:5.7 docker pull zabbix/zabbix-server-mysql:latest docker pull zabbix/zabbix-agent:latest docker pull zabbix/zabbix-web-nginx-mysql:latest docker pull grafana/grafana:latest
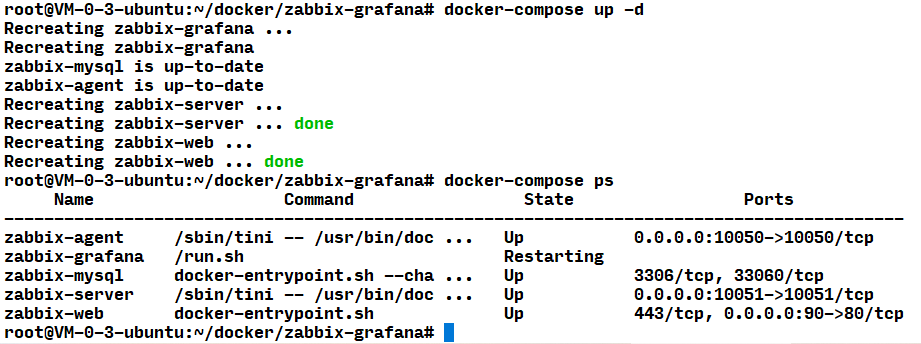
docker-compose up -d docker-compose ps
Configure Zabbix
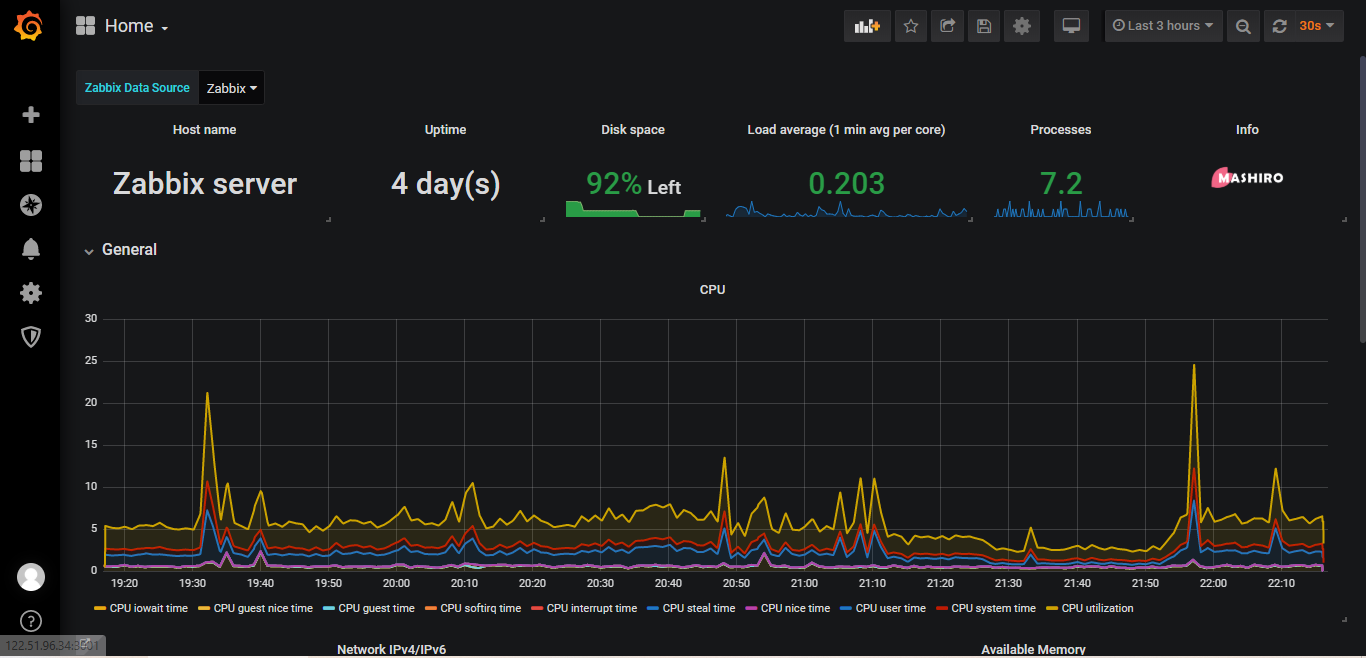
Configure Grafana