[ abstract ]Looking back at every bull bear conversion in the history of US stocks, it seems that there is a common law: the Federal Reserve "releases water" - speculation+leverage - promotes bubbles - the Federal Reserve raises interest rates - bubbles burst. Therefore, whether the US stock bubble will burst depends largely on the future policy trend of the Federal Reserve.
Three major illusions in life: house prices are going to fall, A-shares are at the bottom, and U.S. stocks are at the top.
Even after the worst epidemic in history, the three delusions of life still seem to be delusions, and everything seems unchanged.
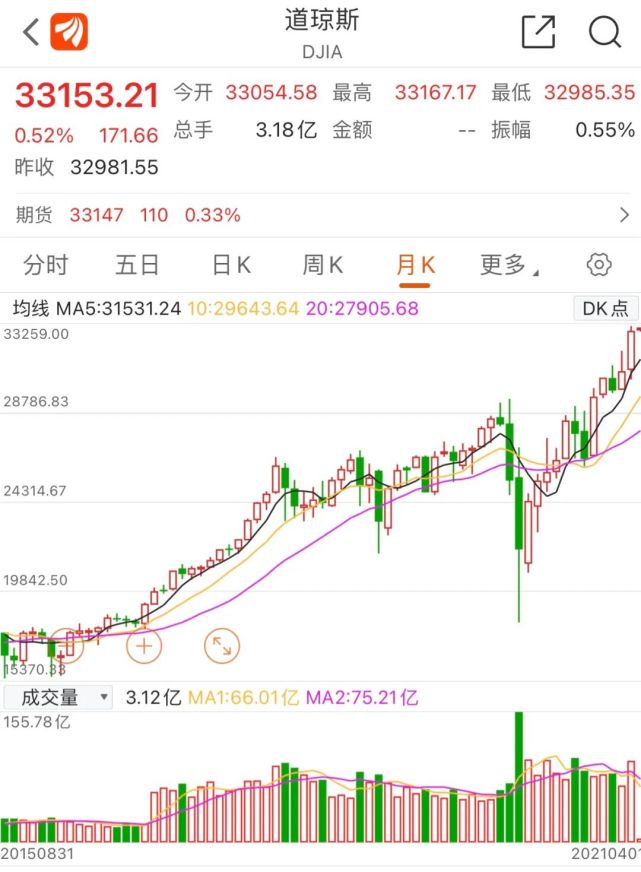
Just now, the US stock market has set a new record, and the NASDAQ is only one step away from the new record. This most lasting bull market in human history is still "playing and dancing".
While everyone is reveling, the danger signal is approaching. At present, the Buffett index (total market value of US stocks/US GDP) of US stocks has reached 190%, higher than the peak in the Internet bubble period at the beginning of 2000, and even higher than the peak on the eve of the "Great Depression" in 1929, which means that the current US stocks are at the most expensive level in history.
All this is inseparable from the epic "water release" of the Federal Reserve. Therefore, when the US stock market bubble will burst in the future may depend on the policy inflection point of the Federal Reserve.
How long can the most lasting bull market in human history last?
The start of this round of bull market in US stocks began on March 9, 2009. At the darkest moment of the financial crisis, the S&P 500 index fell to 666.79.
Since then, it has reversed itself in despair and opened a bull market. At the close of April 1 local time, the S&P 500 index hit a new record high, reaching 4019.87 points, with a cumulative increase of more than 500%.
Bank of America Merrill Lynch has counted the duration of each bull market in the history of American stocks. The previous holder of the longest bull market in American stocks was the Internet bull market from 1990 to 2000, which lasted for 113 months (3452 days), during which the S&P 500 rose by 417%.
Today, this record has already been broken. Since March 9, 2009, the bull market in US stocks has lasted for 146.7 months (4401 days), surpassing any bull market in the history of US stocks.
Under this bull market feast, technology stocks are undoubtedly the biggest winners. At present, the top five stocks with the highest market capitalization in the S&P 500 index are technology stocks, which are respectively Apple (AAPL), Microsoft (MSFT), Amazon (AMZN), Google (GOOG) and Facebook (FB), with a total market capitalization of US $2039.7 billion, US $1774.2 billion, US $1548.8 billion, US $1382.5 billion and US $828.2 billion, respectively.
Starting from March 9, 2009, by March 29, 2021, Amazon had the largest increase, with a cumulative increase of 4886% during the period; Apple ranked the second with a cumulative increase of 4536%; Facebook, which went public after 2009, saw the smallest increase, but it also exceeded 6.6 times.
However, after the Chinese Lunar New Year, US bond yields continued to soar, and the market began to worry about inflation. US technology stocks suffered a round of slump, making the focus of the market is changing: will US stocks repeat the Internet bubble burst 20 years ago? How long can this bull market last?
Buffett's indicator "explodes", how big is the bubble in US stocks?
The key to answering the above two questions is, how big is the current US stock bubble? When will the Fed's "water release" end?
Buffett, the "god of stocks", once wrote in Forbes magazine in December 2001 that the ratio of the total market value of the stock market to GDP can be used as an indicator to judge whether there is a bubble in American stocks. Since then, "US stock market value/GDP" has been called Buffett indicator.
Generally speaking, when Buffett's index is between 70% and 80%, it is a good time to buy American stocks. If Buffett's index exceeds 100%, investors need to pay attention to the risk of US stocks.
So, how big is the current US stock market bubble?
According to the latest data, the current "Buffett Index" of the US stock market has reached 190%, higher than the peak of the dotcom bubble period in early 2000, and even higher than the peak of the index before the "Great Depression" in 1929, which is the most expensive level in history.
Therefore, purely from the perspective of "Buffett indicator", the valuation of the US stock market has exceeded the historical highest level, while other indicators are also confirming that the US stock bubble is approaching the historical highest level.
Robert Schiller, the author of Irrational Prosperity and winner of the Nobel Prize in Economics, has conducted an in-depth study of the bubbles in American stocks since 1870, and proposed to use the 10-year periodic price earnings ratio (CAPE) instead of the 12-month price earnings ratio index to evaluate American stocks. This valuation system can accurately identify the stock market bubbles before the Great Depression in 1929 and the technology stock bubbles in 2000, This indicator is called Shiller PE.
At present, the current price earnings ratio index of Schiller is 35.7, which is higher than the highest price earnings ratio of 32.6 times in the early period of the Great Depression in 1929, and is close to the high point of 44.2 times in early 2000.
Another legendary investment master, Peter Lynch, invented the "20 rule", that is, when the price earnings ratio of the stock market in the last 12 months plus the inflation rate equals 20, the stock market valuation is in the fair range. At present, this indicator has soared to 33.8, surpassing the record of 32.7 set in March 2000 during the Internet bubble.
In addition, Michael Hartnett, an analyst at Bank of America Merrill Lynch, said that the US stock bubble is approaching its peak, the size of US financial assets has reached 6 times of US GDP, and the Bull Bear Index has further risen to 7.2 from the previous 7.1, which means that the US stock market is currently in a serious overbought range.
Lei?, founder of Bridgewater Fund? Ray Dalio also recently measured the bubble of US stocks. He observed the bubble degree of US stocks since 1910 through six quantitative indicators. At present, it is at a historical high of 77%. On the eve of the 1929 crash, it corresponds to a level of 100%.
There is no bubble that ended in a burst
"I can calculate the orbit of celestial bodies, but I can't measure the madness of human nature." - Newton.
The new global epidemic in 2020 nearly punctured the bubble of the US stock market, which was once the worst circuit breaker in history. Then the Federal Reserve, with its own efforts, reversed the trend of the collapse of the US stock market, quickly recovered the lost ground of the collapse, constantly set new records, and became the engine of the global bull market. Global investors continue to enjoy the bubble revelry.
From March to May 2020, the Federal Reserve's banknote printing volume reached $3 trillion, equivalent to 3.3 times of the total banknote printing volume ($900 billion) in the 200 years before 2008. In addition, data shows that in 2020, the Federal Reserve will release the highest amount of base currency in a single month, equivalent to the sum of 200 years before 2008.
The corresponding broad monetary aggregate and growth rate both set a historical record, increasing by 25% compared with the same period in 2019.
Therefore, since 2020, the bubble of US stocks has almost been driven by the liquidity of US dollars. According to the data of Tianfeng Securities, of the 29% increase in US stocks (S&P 500) in 2019, valuation contributed 27% and profit contributed 2%. In 2020, the US stock market increased by 16% in the whole year, of which the profit decreased by 24%, while the valuation increased by 54%.
Photo source: Guotai Jun'an Futures
Looking back at every bull bear conversion in the history of US stocks, it seems that there is a common law: the Federal Reserve "releases water" - speculation+leverage - promotes bubbles - the Federal Reserve raises interest rates - bubbles burst.
Therefore, whether the US stock bubble will burst depends largely on the future policy trend of the Federal Reserve.
At present, there is no inflection point in US dollar liquidity. The Federal Reserve is still dovish and intends to protect the market. In the short and medium term, it will still maintain the existing easing efforts, and emphasizes that if quantitative easing exits, it will communicate with the market a long time in advance.
On March 31 local time, U.S. President Joe Biden announced a plan for infrastructure construction and economic recovery of more than $2 trillion (about 13.1 trillion yuan). Prior to that, Biden also announced a $1.9 trillion stimulus plan, which directly paid $1400 to most Americans.
It means that the rhythm of "water release" in the United States is still continuing, and the loose liquidity environment may still support the continued bubble of the US stock market.
But under the bubble carnival, stay sober. Because in human history, there is no bubble that does not end with a burst. It is only a matter of time before the Federal Reserve ends its "water release".
In early March, Guo Shuqing, Chairman of the Banking and Insurance Regulatory Commission, clearly warned that he was worried that the bubbles in foreign financial markets would burst one day. Now the Chinese market is highly connected with foreign markets, and foreign capital continues to flow in. From the perspective of the most important external factors affecting the domestic stock market, the biggest potential negative for A-shares this year is probably the collapse caused by the bursting of the US stock bubble.