The days of logging in to servers and manually viewing log files are over. SolarWinds® Papertrail™ aggregates logs from applications, devices, and platforms to a central location.
SolarWinds® Papertrail™ provides cloud-based log management that seamlessly aggregates logs from applications, servers, network devices, services, platforms, and much more.
SolarWinds® Papertrail™ provides lightning-fast search, live tail, flexible system groups, team-wide access, and integration with popular communications platforms like PagerDuty and Slack to help you quickly track down customer problems, debug app requests, or troubleshoot slow database queries.
Mobile app crashes can be a real headache in the world of software development. They not only lead to user frustration and productivity loss but also tarnish your organization’s reputation. As a mobile developer, one of the most valuable tool in your troubleshooting arsenal is theCrash log.
When mobile apps crash, they generate logs that contain some information related to where the issues that caused the crash occurred. Taking a look at the log is one place to start your effort toward diagnosing and fixing the crash.
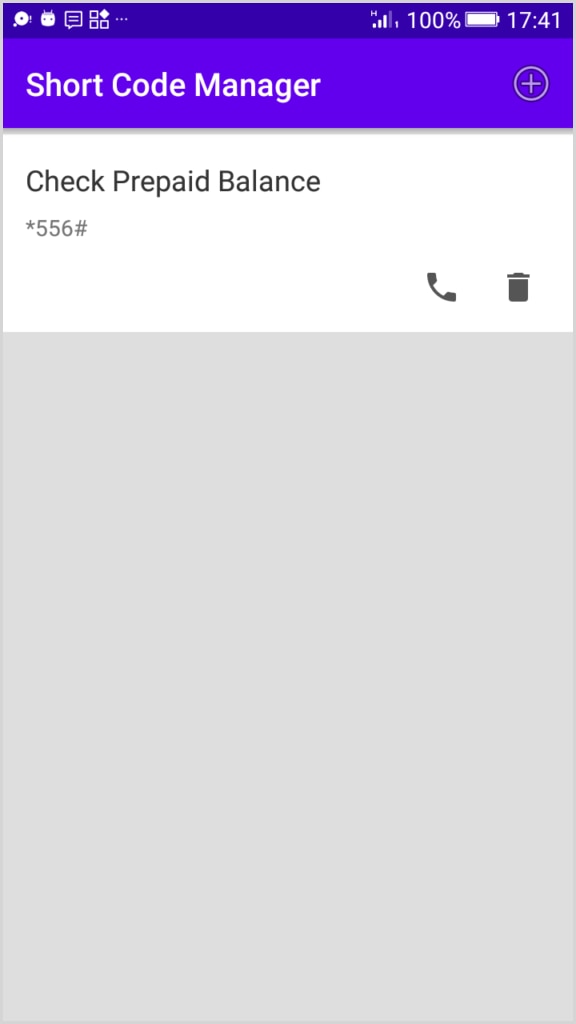
In this post, we will investigate the cause of a crash in an example app calledShort Code Manager. Short Code Manager is an Android app that I built for the purpose of this post. It’s supposed to do the following:
Let users store short USSD codes like *123#.
Have a user interface (UI) that enables the app user to dial short codes directly from the app.
Our Short Code Manager app is based on an app I built and published a few years ago. The issue we will be diagnosing occurred in an early release of that app. For some users, the app crashes whenever they attempt to dial USSD codes from the app. At the end of this post,I’ll show you how to diagnose and fix the issue using crash logs and how SolarWinds®Papertrail™can be an invaluable ally in this process.
Prerequisites
Before we get started, make sure you have the following so you can follow along with this tutorial:
Basic understanding of Java and Gradle.
Current version of the Android Studio IDE and Android SDK installed. You can download Android Studio for Windows, Mac, or Linux from theofficial download page. The Android SDK will automatically install the first time you launch Android Studio.
An Android device or emulator to run our example app. You can set up an emulator on Android Studio via the AVD Manager.
Upgrade Gradle and other dependencies used in the project to their latest versions.
The source code for the example app is availablehere.
Understanding Crash Logs
Crash logs are files that contain information about the state of an application when it unexpectedly terminates or crashes. They can help developers identify and fix the root causes of app issues, such as bugs, memory leaks, or compatibility problems. Crash logs can also provide useful feedback for improving the app’s performance, stability, and user experience.
Types of Android Crash Logs
Crash logs in Android development can be categorized into two main types: native crashes and Java crashes.
Native Crashes: These crashes occur in the native code, typically written in languages like C or C++. The associated logs provide information about the low-level details of the crash.
Java Crashes: Java crashes involve issues in the application’s Java code. The logs contain information about the Java stack trace, helping developers identify the problematic Java methods.
Components of an App Crash Log
Crash logs typically include some of the following key information:
Stack Trace: This is the most critical part of the crash log. It shows the sequence of method calls that led to the crash, starting from the main method or entry point of the app. It helps you pinpoint the exact location in your code where the crash occurred.
Exception Type and Message: This information tells you what kind of error or exception caused the crash. It’s often accompanied by a description that can help you understand the issue (e.g., NullPointerException, OutOfMemoryError, etc.).
Caused by: If the exception is caused by another exception, this section will provide information about the root cause. It’s important to trace back through these causes to find the initial trigger.
Thread Information: Crash logs may contain details about the threads running in your app at the time of the crash. You can use this information to identify potential concurrency issues.
Device Information: The logs also include details about the device, such as the model, operating system version, and memory usage. This can be helpful in reproducing the issue on specific devices.
Date and Time: Indicates when the crash occurred.
Reasons Why an App Might Crash
Several factors can trigger app crashes, including:
User Actions:Unpredictable user interactions, such as rapid tapping, entering unexpected data, or executing actions not accommodated by the app’s design, can lead to crashes.
Operating System Updates:Changes in the underlying operating system can sometimes clash with an app’s code, resulting in crashes if the app isn’t updated to sync with the latest OS version.
Memory Issues:Apps may crash if they consume more memory than the device can provide, often due to memory leaks, inefficient memory management, or extensive data processing.
Uncaught Exceptions and Error Handling:Inadequate error-handling mechanisms can spell disaster. Uncaught exceptions, whether related to network issues, unexpected user inputs, or system failures, can cause abrupt app termination.
Compatibility and Resource Issues:Apps must seamlessly function across diverse devices, operating systems, and versions. Incompatibility with specific device elements or other installed apps can result in crashes.
Network Connectivity Problems:Apps heavily reliant on network connections may falter if they mishandle network-related issues, such as poor connectivity, timeouts, or server-side problems.
Getting the Crash Log
In the following section, we will walk through four steps to get the crash log after our app crashes. I’ll be using Android Studio and running the example app on a physical Android phone. If you don’t have an Android phone, an emulator can be an alternative.
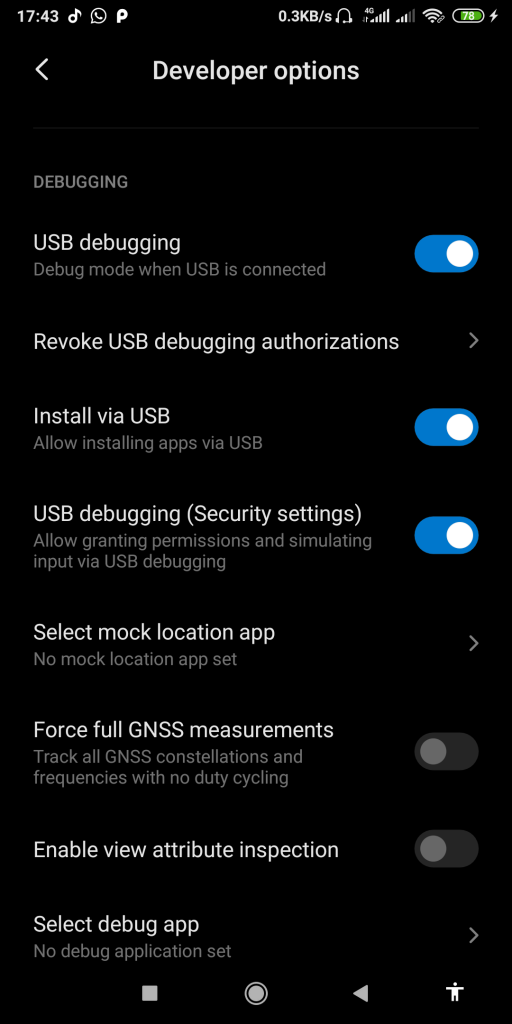
1. Enable USB Debugging on Device
To enable communication betweenADBand a physical Android device, we will need to turnDeveloper optionson and enableUSB debugging. The steps may vary across devices; for my Redmi device runningMIUI, I followed these steps:
Openedsettingsand navigated toAbout phone.
Tapped onBuild number(MIUI version) repeatedly until I received the “You are now a developer” message.
Went back to the main settings UI, selectedAdditional settings, and foundDeveloper options. InDeveloper options, I turned on USB debugging.
If you will be running the app on an emulator, you can skip the above step. Also, run a Google search for something like “Enable USB debugging on Samsung device” if you are using a Samsung phone. Replace the Samsung part with the actual name of your device manufacturer to get more device-specific instructions on how to enable USB debugging on your device.
2. Install the App Via Android Studio and ADB
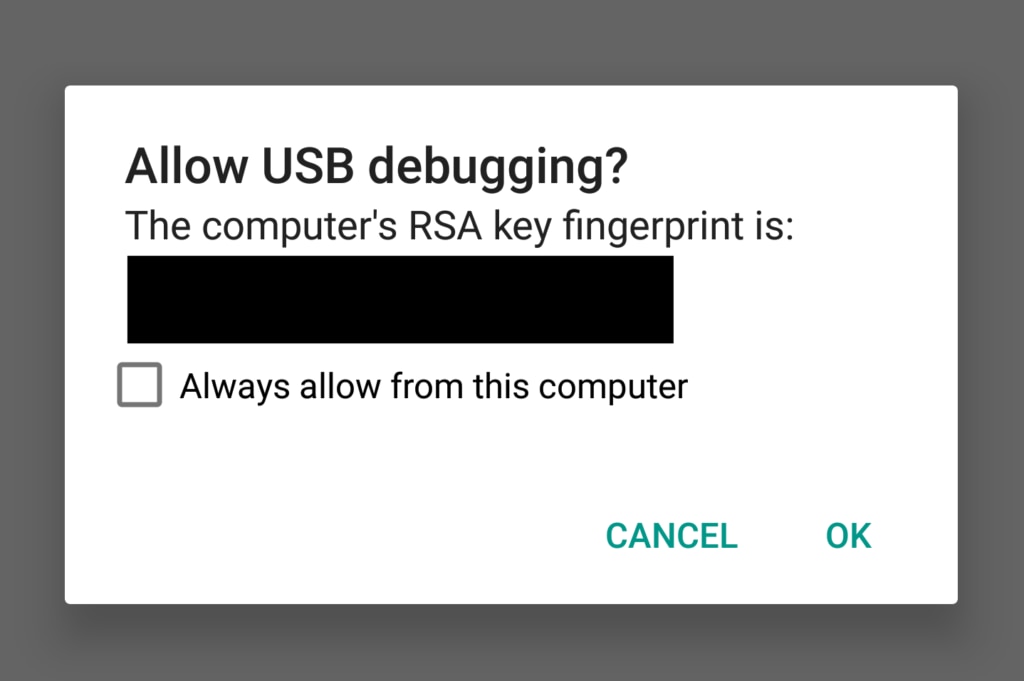
Now that we have USB debugging enabled, Android Studio should be able to detect the Android device connected to our computer via a standard USB cable. If you are connecting a device for the first time, a prompt might be shown on your Android device requesting permission to let ADB connect. Make sure you accept the request.
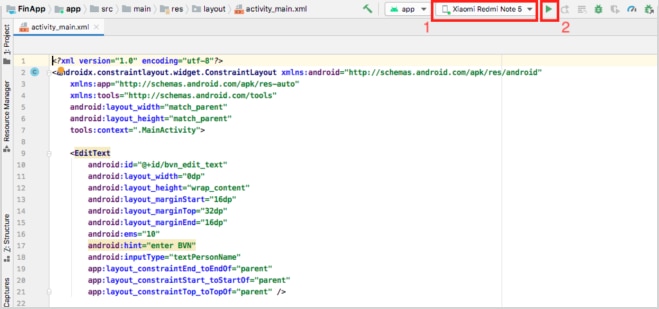
Check “Always allow from this computer” to prevent the dialog from showing in the future. Make sure your device or emulator is selected on the Android Studio device drop-down menu and then hit the green play button to install the app like you usually do during debugging.
3. Producing the Crash
Let’s try to crash our example app. After the app has been installed and is running, add some short codes using the app UI. With some codes already saved, let’s try to dial one of the codes. In some cases, our app is expected to crash. But for this tutorial, I’ve written the code for the app so it crashes on the first try so we get the crash log message instantly. In real-life/production apps, the case is much different. We’ll discuss that later in the post.
To dial a code, we hit the phone icon next to the code on the app UI.
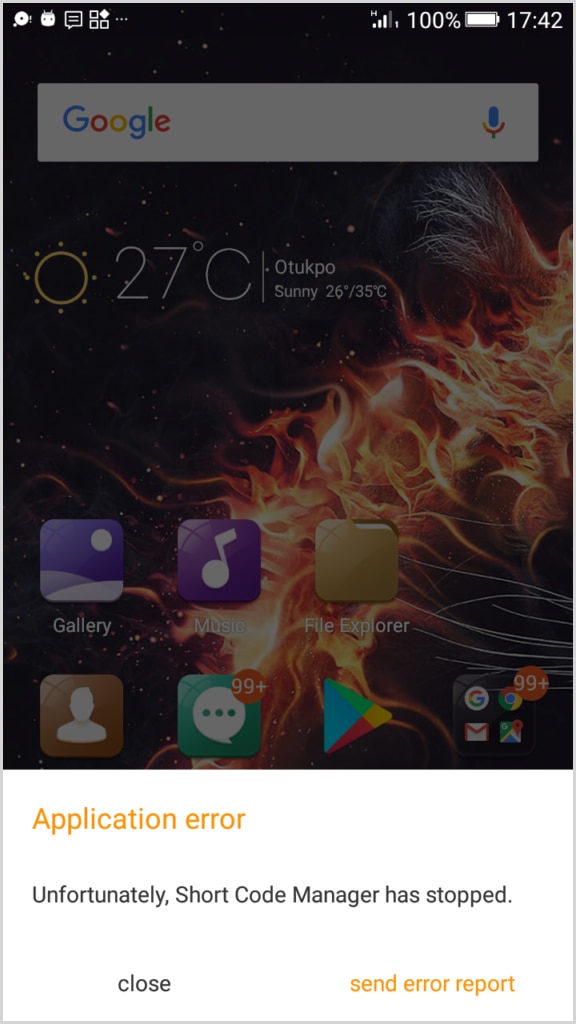
Just after that, our app crashes with a message like “Short Code has stopped working…” and force closes.
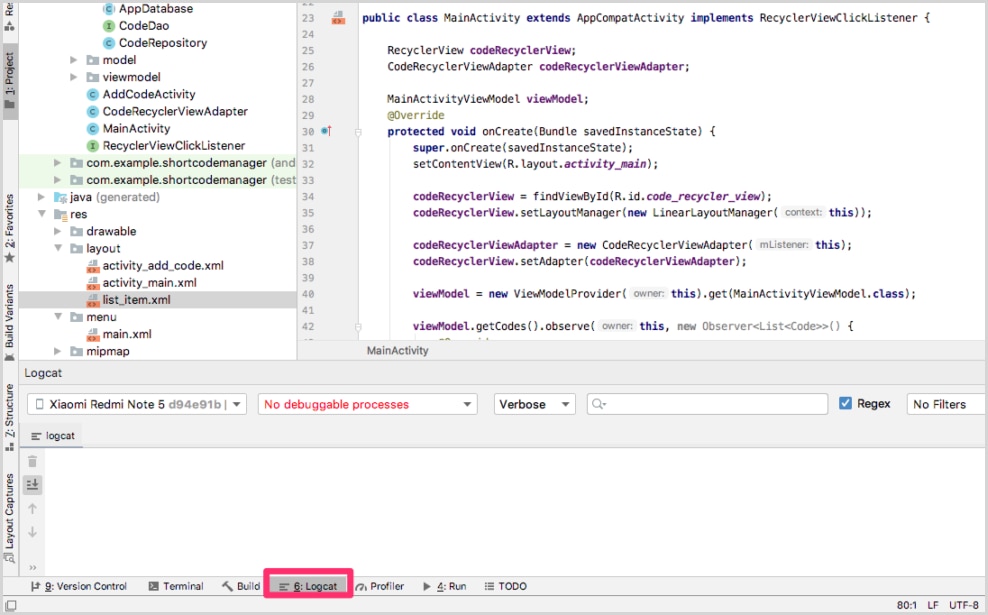
4. Investigating the Crash using LogCat
With our device connected via USB before the crash, Android Studio’s Logcat feature will display information about our app and the crash. To switch toLogcatview on Android Studio, click on theLogcatlabel in the bottom tool window.
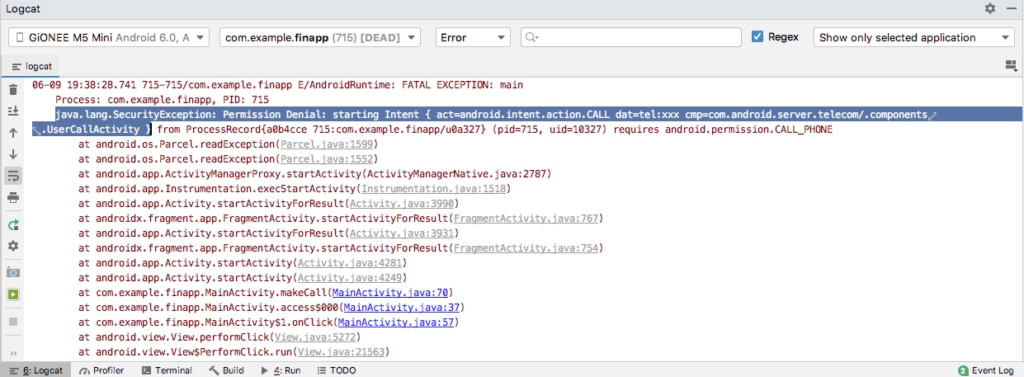
Below is the report from Logcat just after the crash occurred:
The Logcat window allows you to search and filter logs. Changing the log level toErrorwill help trim things down so that we can find the critical issue that caused our app to crash. The Logcat window also shows the current device and app (using the package name). Ensure that you are reading logs for the correct device and app.
The following info from the log trace gives some clues about why our app crashed:
Reading the trace further, we can see where the error occurred in our app, including the associated class and line of code. From the information provided in Logcat, we can diagnose the cause of the crash and start working on a fix.
Fixing the Crash
Fortunately, the log entry included enough information, so we were able to pinpoint which part of our code was in execution just before the crash. Creating event messages like this is key to being able to quickly identify what’s happening. If you’re interested in some best practices for creating event messages, check out thearticle on JSON logging.
Logcat shows that our app crashed due to a security exception. In Android, before apps can use some OS features and services like camera, phone call, internet, read/write storage, etc., the app needs to request permission and the user must grant access.
Our example app requires permission to make phone calls (android.permission.CALL_PHONE ). At the moment, the app doesn’t verify whether the user has granted the app such permission or not. We just have a method that kickstarts the phone call. Not verifying explicitly that the user has granted the required permission may lead to crashes on some devices and Android versions (Android 6.0 in our test). To fix this issue, we need to verify that users on the affected OS version have granted the necessary permissions before running the code that starts a phone call. This can be done with anifstatement or whichever way you prefer.
Crashing Is Inevitable. Burning Is Optional
By running our app on a device connected to Android Studio via ADB, we were able to view crash logs on Logcat. We used the information from Logcat to detect the issue with our app. Logcat also reports the class, method, and line of code associated with the crash. Thanks to that, we were able to diagnose and fix the issue that caused our example Short Code Manager app to crash.
Our example here is a simple case. In real-life/production apps, diagnosing issues in an app could be more complex. Logcat alone can’t help you detect and fix issues. For example, an application in production might
Be installed on hundreds, thousands, or even more devices.
Be installed on devices with various configurations (e.g., multiple Android versions).
include user-specific logic to generate behavior for different users based on their account and user-generated content;
or include integrations with external services or other applications.
Much more effort is required to collect logs effectively in any of the above cases.
As a developer, you can only test on a limited number of devices, and users are very likely to interact with your apps in new and unexpected ways that you didn’t imagine. It’s important to diagnose app crashes fast and provide a timely fix to avoid poor user experience, which might lead to app uninstalls.
While Logcat is a powerful tool for retrieving crash logs and debugging apps during development, the process becomes more intricate when dealing with production-level apps across multiple devices and users. This is where services likeSolarWinds Papertrailcome in handy.
How SolarWinds Papertrail Can Help
SolarWinds Papertrail is acloud-based loggingmanagement solution that can significantly aid in the efficient collection, centralization, and analysis of logs from various sources, including applications, servers, and systems. Papertrail brings logs from multiple services and applications together and lets you search them from asingle UI. For crash logs, thetail featurein Papertrail is one I use frequently. It lets me livestream logs (like a tail-f) and search and filter them as they’re written. If you’re interested in seeing this for yourself,sign up for a free trial of Papertrail.
This post was written by Pius Aboyi.Piusis a mobile and web developer with over four years of experience building for the Android platform. He writes code in Java, Kotlin, and PHP. He loves writing about tech and creating how-to tutorials for developers.
Aggregate, organize, and manage your logs
Collect real-time log data from your applications, servers, cloud services, and more
Search log messages to analyze and troubleshoot incidents, identify trends, and set alerts
Create comprehensive per-user access control policies, automated backups, and archives of up to a year of historical data