Stock job web V1 is a full stack stock system developed based on Python's pandas, tushare, bokeh, tornado, stockstats, ta lib and other frameworks.
1) You can directly use Docker to deploy and run locally. The whole project is compressed on the Docker Hub to 200BM, and the local area occupies 500MB of disk space.
2) Use Docker to solve the Python library installation problem, and use Mariadb (MySQL) to store data. Grab data with tushare (old API, later developed with tushare pro)
3) The CORN is used as a scheduled task to perform data capture calculation every day. The data calculation starts at 18:00 every day to calculate the data of the day. The calculation takes about 15 minutes to complete using 300 days of data.
4) The stock data interface is prevented from being sealed, and data cache is carried out on a daily basis to store the data of the last three days, which is cleared regularly every day. At the same time, it is stored in the gzip compression mode of read_pickle to_pickle.
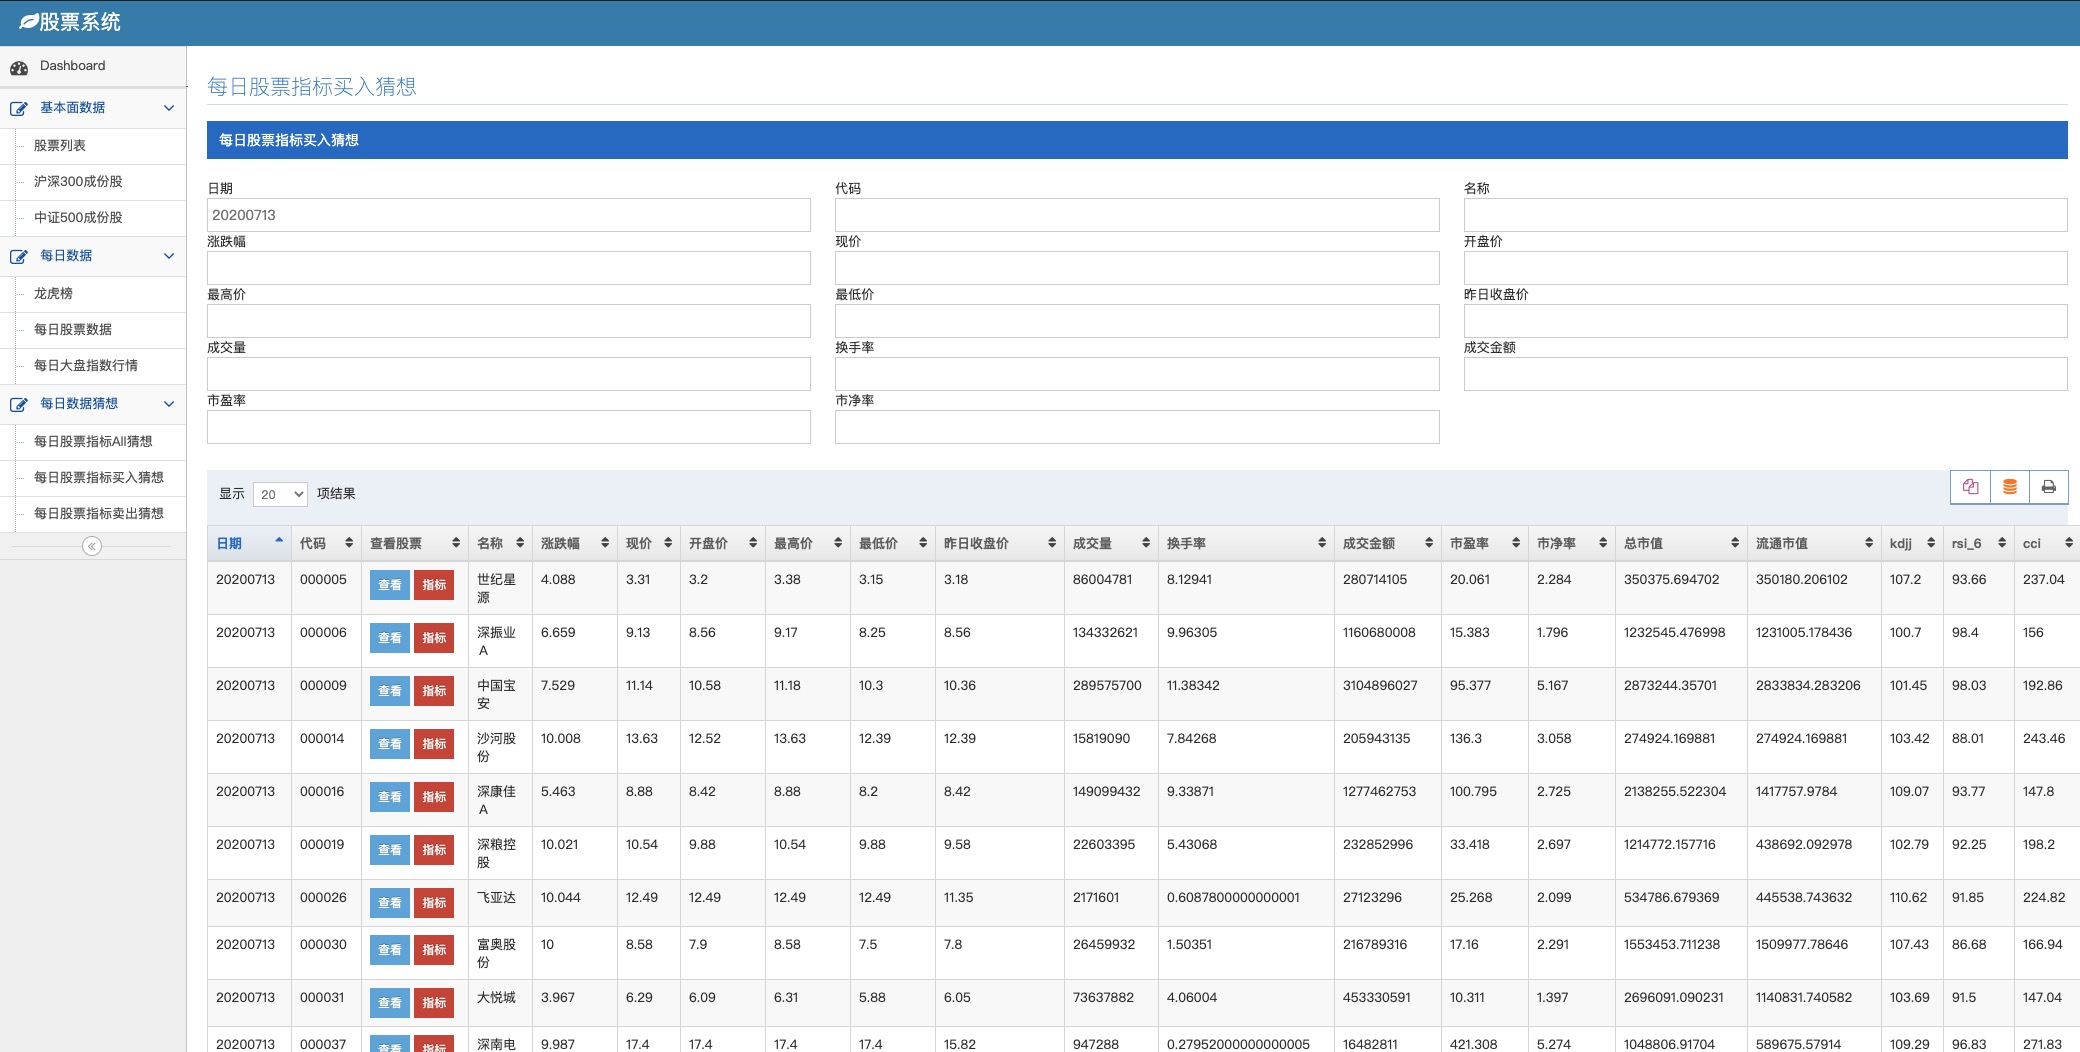
5) Use tornado to develop web system, support stock data, CSI 300 constituent stocks, CSI 500 constituent stocks, Dragon Tiger List data, daily stock data, daily market index, etc
6) The data display system is a general data display system. After the dictionary template is configured, the page automatically loads the data and completes the data display. The index data developed later can be added.
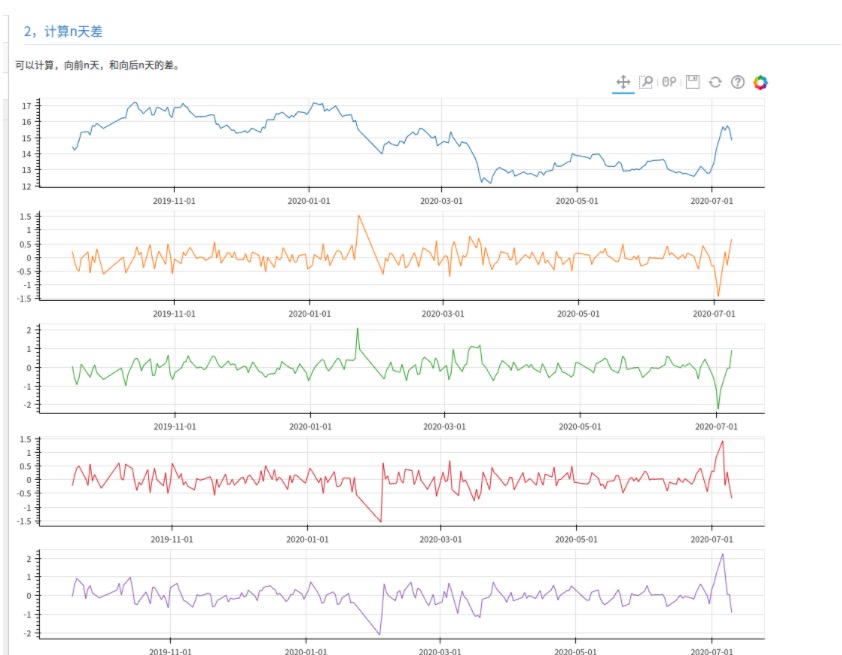
7) Add curve data analysis. When viewing stocks, you can directly jump to the Oriental Wealth page to view relevant information. Click indicators and use Bokeh to plot data of up to 17 indicators for chart display.
The 17 indexes calculated from the daily stock index data are as follows (data table guess_indicators_daily):
| Calculation index |
explain |
| 1. Trading volume delta indicator analysis |
The Volume Delta (Vol ∆) |
| 2. Calculate n day difference |
The difference between the previous n days and the subsequent n days can be calculated. |
| 3. Calculate the percentage of rise and fall in n days |
As you can see, the percentage of - n day data and today's data. |
| 4. CR index |
http://wiki.mbalib.com/wiki/CR%E6%8C%87%E6%A0%87 When the price momentum indicator CR breaks through the four lines of a, b, c and d, and then climbs up 160 from the low point, it is a good opportunity for short-term profits, and stocks should be appropriately sold. When CR falls below 40, it is a good opportunity to build a position. When the CR is higher than 300~400, attention should be paid to proper reduction. |
| 5, maximum, minimum |
The maximum value of the calculation interval volume max of three days ago, yesterday and two days later stock ["volume_ - 3,2, - 1_max"] volume min between 3 days ago and tomorrow stock ["volume_ - 31_min"] When actually used, use - 22 to calculate the maximum and minimum values for 5 days. |
| 6. KDJ index |
http://wiki.mbalib.com/wiki/%E9%9A%8F%E6%9C%BA%E6%8C%87%E6%A0%87 The random index (KDJ) generally calculates the immature random value RSV of the last calculation cycle according to the principle of statistics, through the highest price, lowest price and closing price of the last calculation cycle in a specific cycle (usually 9 days, 9 weeks, etc.) and the proportional relationship between the three, and then calculates the K value D value and J value, and draw a curve to judge the stock trend. (3) In use, there are often indicators of the J line, that is, 3 times the K value minus 2 times the D value (3K-2D=J). The purpose is to find out the maximum deviation between the K value and the D value, and to find the bottom and head with the leading KD value. When J is greater than 100, it is overbought; when J is less than 10, it is oversold. |
| 7. SMA index |
http://wiki.mbalib.com/wiki/Sma Simple Moving Average (SMA) can dynamically input parameters to obtain a moving average of several days. |
| 8. MACD index |
http://wiki.mbalib.com/wiki/MACD Moving Average Convergence Convergence Convergence (MACD), also known as the moving average convergence and dispersion indicator MACD, can play its due role. However, when the market is in a cowhide consolidation pattern and the stock price remains unchanged, the trading signal of MACD is less obvious. When MACD is used for analysis, other technical analysis indicators such as short-term K and D graphs can also be used as auxiliary tools, and the trading signals can also be double confirmed. |
| 9. BOLL index |
http://wiki.mbalib.com/wiki/BOLL Bollinger Bands |
| 10. RSI index |
http://wiki.mbalib.com/wiki/RSI Relative Strength Index (RSI), also known as relative strength index and relative strength index. (3) The strength index mostly fluctuates between 70 and 30. When the six day index rises to 80, it means that the stock market has been overbought. If it continues to rise, and exceeds 90, it means that it has reached the warning area of serious overbought. The stock price has formed a head, which is likely to reverse in the short term. |
| 11. W% R index |
http://wiki.mbalib.com/wiki/%E5%A8%81%E5%BB%89%E6%8C%87%E6%A0%87 Williams% Rate This index uses the swing point to measure the overbought and oversold phenomenon in the market. |
| 12. CCI index |
http://wiki.mbalib.com/wiki/%E9%A1%BA%E5%8A%BF%E6%8C%87%E6%A0%87 The homeopathy indicator, also called CCI indicator, is called "Commodity Channel Index" in English. It is created by Donald Lambert, an American stock market analyst, and is a stock market analysis tool that focuses on studying and judging stock price deviation. 1. When the CCI index breaks through the+100 line from bottom to top and enters the abnormal range, it indicates that the stock price has broken away from the normal and entered the abnormal fluctuation stage. The medium and short term should buy in time. If there is a relatively large trading volume, the buying signal is more reliable. 2. When the CCI index breaks through the - 100 line from top to bottom and enters another abnormal range, it indicates that the consolidation stage of the stock price has ended and will enter a relatively long bottoming process. Investors should mainly wait and see with money. CCI, default to 14 days |
| 13. TR and ATR indicators |
http://wiki.mbalib.com/wiki/%E5%9D%87%E5%B9%85%E6%8C%87%E6%A0%87 Average True Range (ATR) The ATR is the moving average of the stock price volatility within a certain time period, which is mainly used to study and judge the timing of buying and selling. |
| 14. DMA index |
http://wiki.mbalib.com/wiki/DMA DMA indicator (Difference of Moving Average), also known as parallel linear difference indicator, is a medium and short-term indicator in the current technical indicators of stock market analysis, which is often used for the research and judgment of large market indexes and individual stocks. DMA, difference of 10 and 50 moving average stock[‘dma’] |
| 15, DMI,+DI, - DI, DX, ADX, ADXR indicators |
http://wiki.mbalib.com/wiki/DMI Directional Movement Index (DMI) http://wiki.mbalib.com/wiki/ADX Average Directional Indicator (ADX) http://wiki.mbalib.com/wiki/%E5%B9%B3%E5%9D%87%E6%96%B9%E5%90%91%E6%8C%87%E6%95%B0%E8%AF%84%E4%BC%B0 The average directional index evaluation (ADXR) is actually the average value of today's ADX and the ADX of a previous day. The synchronous decline of ADXR and ADX at high position can increase the early confirmation of ADX turning around. ADXR is a subsidiary product of ADX. It can only send a supplementary and positive signal, not an indicator of market entry, but only needs to coordinate with the trend of the trend indicator (DMI) to make a buying and selling strategy. In application, ADX shall be the main and ADXR shall be the auxiliary. |
| 16, TRIX, MATRIX indicators |
http://wiki.mbalib.com/wiki/TRIX TRIX indicator is also called Triple Exponentially Smoothed Average |
| 17. VR, MAVR indicators |
http://wiki.mbalib.com/wiki/%E6%88%90%E4%BA%A4%E9%87%8F%E6%AF%94%E7%8E%87 Volume Ratio (VR) (referred to as VR) is a medium-term technical indicator to grasp the momentum of market trading by analyzing the ratio of daily turnover (or volume, the same below) of rising stock prices to daily turnover of falling stock prices. |
Usage (Docker dependent)
Use mariadb and stock images
mkdir -p /data/mariadb/data docker pull pythonstock/pythonstock:latest docker pull mariadb:latest docker run --name mariadb -v /data/mariadb/data:/var/lib/mysql \ -e MYSQL_ROOT_PASSWORD=mariadb -p 3306:3306 -d mariadb:latest docker run -itd --link=mariadb --name stock \ -v /data/notebooks:/data/notebooks \ -p 8888:8888 \ -p 9999:9999 \ pythonstock/pythonstock:latest
To directly start stock and use other MySQL databases, you need to configure the variable mode:
docker run -itd --name stock \ -v /data/notebooks:/data/notebooks \ -p 8888:8888 \ -p 9999:9999 \ -e MYSQL_HOST=127.0.0.1 \ -e MYSQL_USER=root \ -e MYSQL_PWD=mariadb \ -e MYSQL_DB=stock_data \ pythonstock/pythonstock:latest
Enter the image:
docker exec -it stock bash sh /data/stock/jobs/cron.daily/run_daily
Note: After the container is started, it will be called. Run_init.sh initializes the data, and executes the data of the day in the background for the first time. In the future, stock data will be captured and calculated at 18:00 every day (only around 18:00 today's data is available).
Local access port
http://localhost:9999 Stock system
http://localhost:8888 jupyter
To view the password of jupyter:
docker exec -it stock bash To view login token problems: jupyter notebook list #You can see the token, and then you can log in.
Stock System Design
Related blog materials: http://blog.csdn.net/freewebsys/article/category/7076584
The stock data fetching framework uses TuShare. http://tushare.org/
Use pandas and numpy for data analysis and cleaning http://pandas.pydata.org/
The data is stored on the disk, and the MySQL database is used. Store stock data. https://pypi.python.org/pypi/mysqlclient
The web framework uses tornado http://www.tornadoweb.org/en/stable/
Tornado web system http://docs.pythontab.com/tornado/introduction-to-tornado/
Scikit ear document, Chinese document https://scikit-learn.org/stable/ https://github.com/apachecn/sklearn-doc-zh/
architecture design
The whole system is implemented in python. Because they are all python class libraries, it is convenient to call each other. From data capture, data processing, to data display, data operation are all implemented in python.
The final data is displayed at the front end. It is mainly divided into 4 folders.
Jobs grabs data and stores implementation classes.
Libs general tool class.
Web front-end presentation framework.
Supervisor process management tool.
Github address: https://github.com/pythonstock/stock
Blog materials: http://blog.csdn.net/freewebsys/article/category/7076584