software function
1、 Statistical function
Stati has a strong statistical function. In addition to the traditional statistical analysis methods, it also collects new methods developed in the past 20 years, such as Cox proportional risk regression, index and Weibull regression, logistic regression between multiple types of results and ordered results, Poisson regression, negative binomial regression and generalized negative binomial regression, random effect model, etc. Specifically, Stata has the following statistical analysis capabilities:
General analysis of data on numerical variables: parameter estimation, t-test, one-way and multifactor analysis of variance, covariance analysis, interaction effect model, balanced and unbalanced design, nested design, random effects, pairwise comparison of multiple means, processing of missing data, test of homogeneity of square differences, test of normality, variable transformation, etc.
General analysis of classified data: parameter estimation, contingency table analysis (contingency coefficient, exact probability), epidemiological table analysis, etc.
General analysis of grade data: rank transformation, rank sum test, rank correlation, etc
Correlation and regression analysis: simple correlation, partial correlation, canonical correlation, as well as dozens of regression analysis methods, such as multiple linear regression, stepwise regression, weighted regression, bond stabilizing regression, two-stage regression, percentile (median) regression, residual analysis, strong influence point analysis, curve fitting, linear regression model of random effects, etc.
Other methods: quality control, design efficiency of cluster sampling, diagnostic test evaluation, kappa, etc.
2、 Drawing function
The graphics module of Stata mainly provides the following eight basic graphics: histogram, bar, oneway, pie, twoway, matrix, star, and quantile. The ingenious application of these graphs can meet the statistical mapping requirements of most users. Some non drawing commands also provide the function of drawing a specific graph, such as survival curve drawing in survival analysis and residual error drawing in regression analysis.
Matrix operation function of Stata
Matrix algebra is an important tool for multivariate statistical analysis. Stata provides basic matrix operations required in multivariate statistical analysis, such as addition, product, inverse, Cholesky decomposition, Kronecker inner product, etc; It also provides some advanced operations, such as eigenvalue, eigenvector, singular value decomposition, etc; After executing some statistical analysis commands, some system matrices are also provided, such as estimation coefficient vector, covariance matrix of estimation coefficient, etc.
3、 Programming function
Stata is a statistical analysis software, but it also has strong program language functions, which provides users with a broad world of development and application. Users can give full play to their intelligence, skillfully apply various skills, and really do what they want. In fact, Stata's ado file (advanced statistics section) is written in Stata's own language
Stata's statistical analysis capability far exceeds that of SPSS and SAS in many aspects! Because Stata reads all the data into the memory during analysis and exchanges data with the disk after all the calculations are completed, the calculation speed is extremely fast (generally speaking, SAS is at least one order of magnitude faster than SPSS, and some modules in Stata are nearly one order of magnitude faster than SAS when compared with SAS modules that perform the same function!) Stata is also operated in command line mode, but it is much easier to use than SAS. Its functions of survival data analysis, longitudinal data (repeated measurement data) analysis and other modules even exceed those of SAS. The statistical graph drawn with Stata is quite exquisite and distinctive.
4、 Function list
Data management
Data conversion, grouping, additional files, ODBC, row column conversion, data tags, string functions, etc
Basic statistics
Orthogonal table, correlation, t-test, variance equality test, proportional test, confidence interval, etc
Linear models
Robust Huber/Hite/Sandwich variance estimation, third-order least square method, quasi uncorrelated regression, homogeneous polynomial regression, GLS
Generalized linear models
Ten link functions, user defined links, ML and IRLS estimates, nine variant estimates, seven residuals, etc
Binary, counting and finite strain (Binary, count, and limited dependent variables)
Rogesta, probit, Poisson regression, tobit, truncated regression, conditional Rogesta, polynomial logic, nested logic, negative binomial, zero impacted model, Heckman selection mode, marginal influence
Panel data/cross sectional time series
Regression of random and fixed effects, GEE, Poisson and negative binomial distribution of random and fixed impact, random impact, instrumental variable regression, AR (1) interference regression
Nonparametric methods
Multivariate methods
Factor analysis, multivariate regression, canonical correlation coefficient
Model testing and post estimation support
Wald test, LR test, linear and nonlinear combination, nonlinear limit test, marginal influence, modified mean Hausman test
Cluster analysis
Weighted average, mass center and median connection kmeans 、 kmedians 、 dendrograms 、 Stop rules, user expansion
Graphics
Line chart, scatter chart, bar chart, pie chart, hi lo chart, regression diagnostic chart
Survey methods
Sampling weight, cluster sampling, stratification, linear variance estimator, quasi probable maximum estimator, regression, instrumental variable
Survival analysis
Kaplan – Meier, Nelson – Aalen, Cox regression (weak), parameter mode (weak), hazard ratio test, time covariate, left right check, Weibull distribution, index distribution
Tools for epidemiologists
Proportion standardization, case control, matched case control Mantel – Haenszel, Pharmacology, ROC analysis, ICD-9-CM
Time series
ARIMA 、 ARCH/GARCH 、 VAR 、 Newey – West 、 correlograms 、 periodograms 、 White – noise test, minimum integer root verification, time series operation, smoothing
Maximum likelihood method
Transforms and normal tests
Box – Cox 、 Power transformation Shapiro – Wilk, Shapiro – Francia verification
Other statistical methods
Sample number and power, nonlinear regression, stepwise regression, statistics and mathematical functions
Include sample session
Resampling and simulation methods
bootstrapping 、 jackknife 、 Monte Carlo simulation and alignment verification
5、 Network function
New installation instructions, network upgrade, website file sharing, Stata latest news
Why Stata?
Fast. Accurate. Easy to use. Stata is a complete, integrated software package that provides all your data science needs—data manipulation, visualization, statistics, and reproducible reporting.
- Master your data
- Broad suite of statistical features
- Publication-quality graphics
- Truly reproducible reporting
- Truly reproducible research
- Real documentation
- Trusted
- Easy to use
- Easy to grow with
- Easy to automate
- Easy to extend
- Advanced programming
- Automatic multicore support
- Community-contributed features
- World-class technical support
- Cross-platform compatible
- Widely used
- Comprehensive resources
- Vibrant community
- Affordable
Master your data
Stata’s data management features give you complete control.
- Manage multiple datasets simultaneously
- Import, export
- ODBC, SQL
- Sort, match, merge, join, append, create
- Built-in spreadsheet
- Unicode
- Process text or binary data
- Access data locally or on the web
- Collect statistics across groups
- BLOBs—strings that can hold entire documents
- Billions of rows
- Hundreds of thousands of variables
- Survival data, panel data, multilevel data, survey data, discrete choice data, multiple-imputation data, categorical data, time-series data
Stata/MP is faster — much faster.
Stata/MP lets you analyze data in one-half to two-thirds the time compared with Stata/SE on inexpensive dual-core laptops and in one-quarter to one-half the time on quad-core desktops and laptops. Stata/MP runs even faster on multiprocessor servers. Stata/MP supports up to 64 cores/processors.
Speed is often most crucial when performing computationally intense estimation procedures. A few of Stata’s estimation procedures, including linear regression, are nearly perfectly parallelized, meaning they run twice as fast on two cores, four times as fast on four cores, eight times as fast on eight cores, and so on. Some estimation commands can be parallelized more than others. Taken at the median, estimation commands run 1.8 times faster on 2 cores, 3.1 times faster on 4 cores, and 4.2 times faster on 8 cores.
Speed can also be important when managing large datasets. Adding new variables is nearly 100 percent parallelized, and sorting is 75 percent parallelized.
Some procedures are not parallelized and some are inherently sequential, meaning they run the same speed in Stata/MP.
For a complete assessment of Stata/MP’s performance, including command-by-command statistics, see the Stata/MP Performance Report .
Home Page: https://www.stata.com
Download address
Data analysis Stata 17 for Windows
Baidu online disk: https://pan.baidu.com/s/1UYSJUTp3ifPzFG__APD4-Q?pwd=7glt Extraction code: 7glt
123 Cloud Disk: https://www.123pan.com/s/PjcA-q8CRA
Data analysis Stata 16 for Windows Baidu online disk: https://pan.baidu.com/s/1fVgzo6W5oPFR1E5CEmb0BA
Installation Guide:
Run SetupStata16.exe to install, and then copy STATA in the Crack folder LIC and StataMP-64.exe to the installation directory
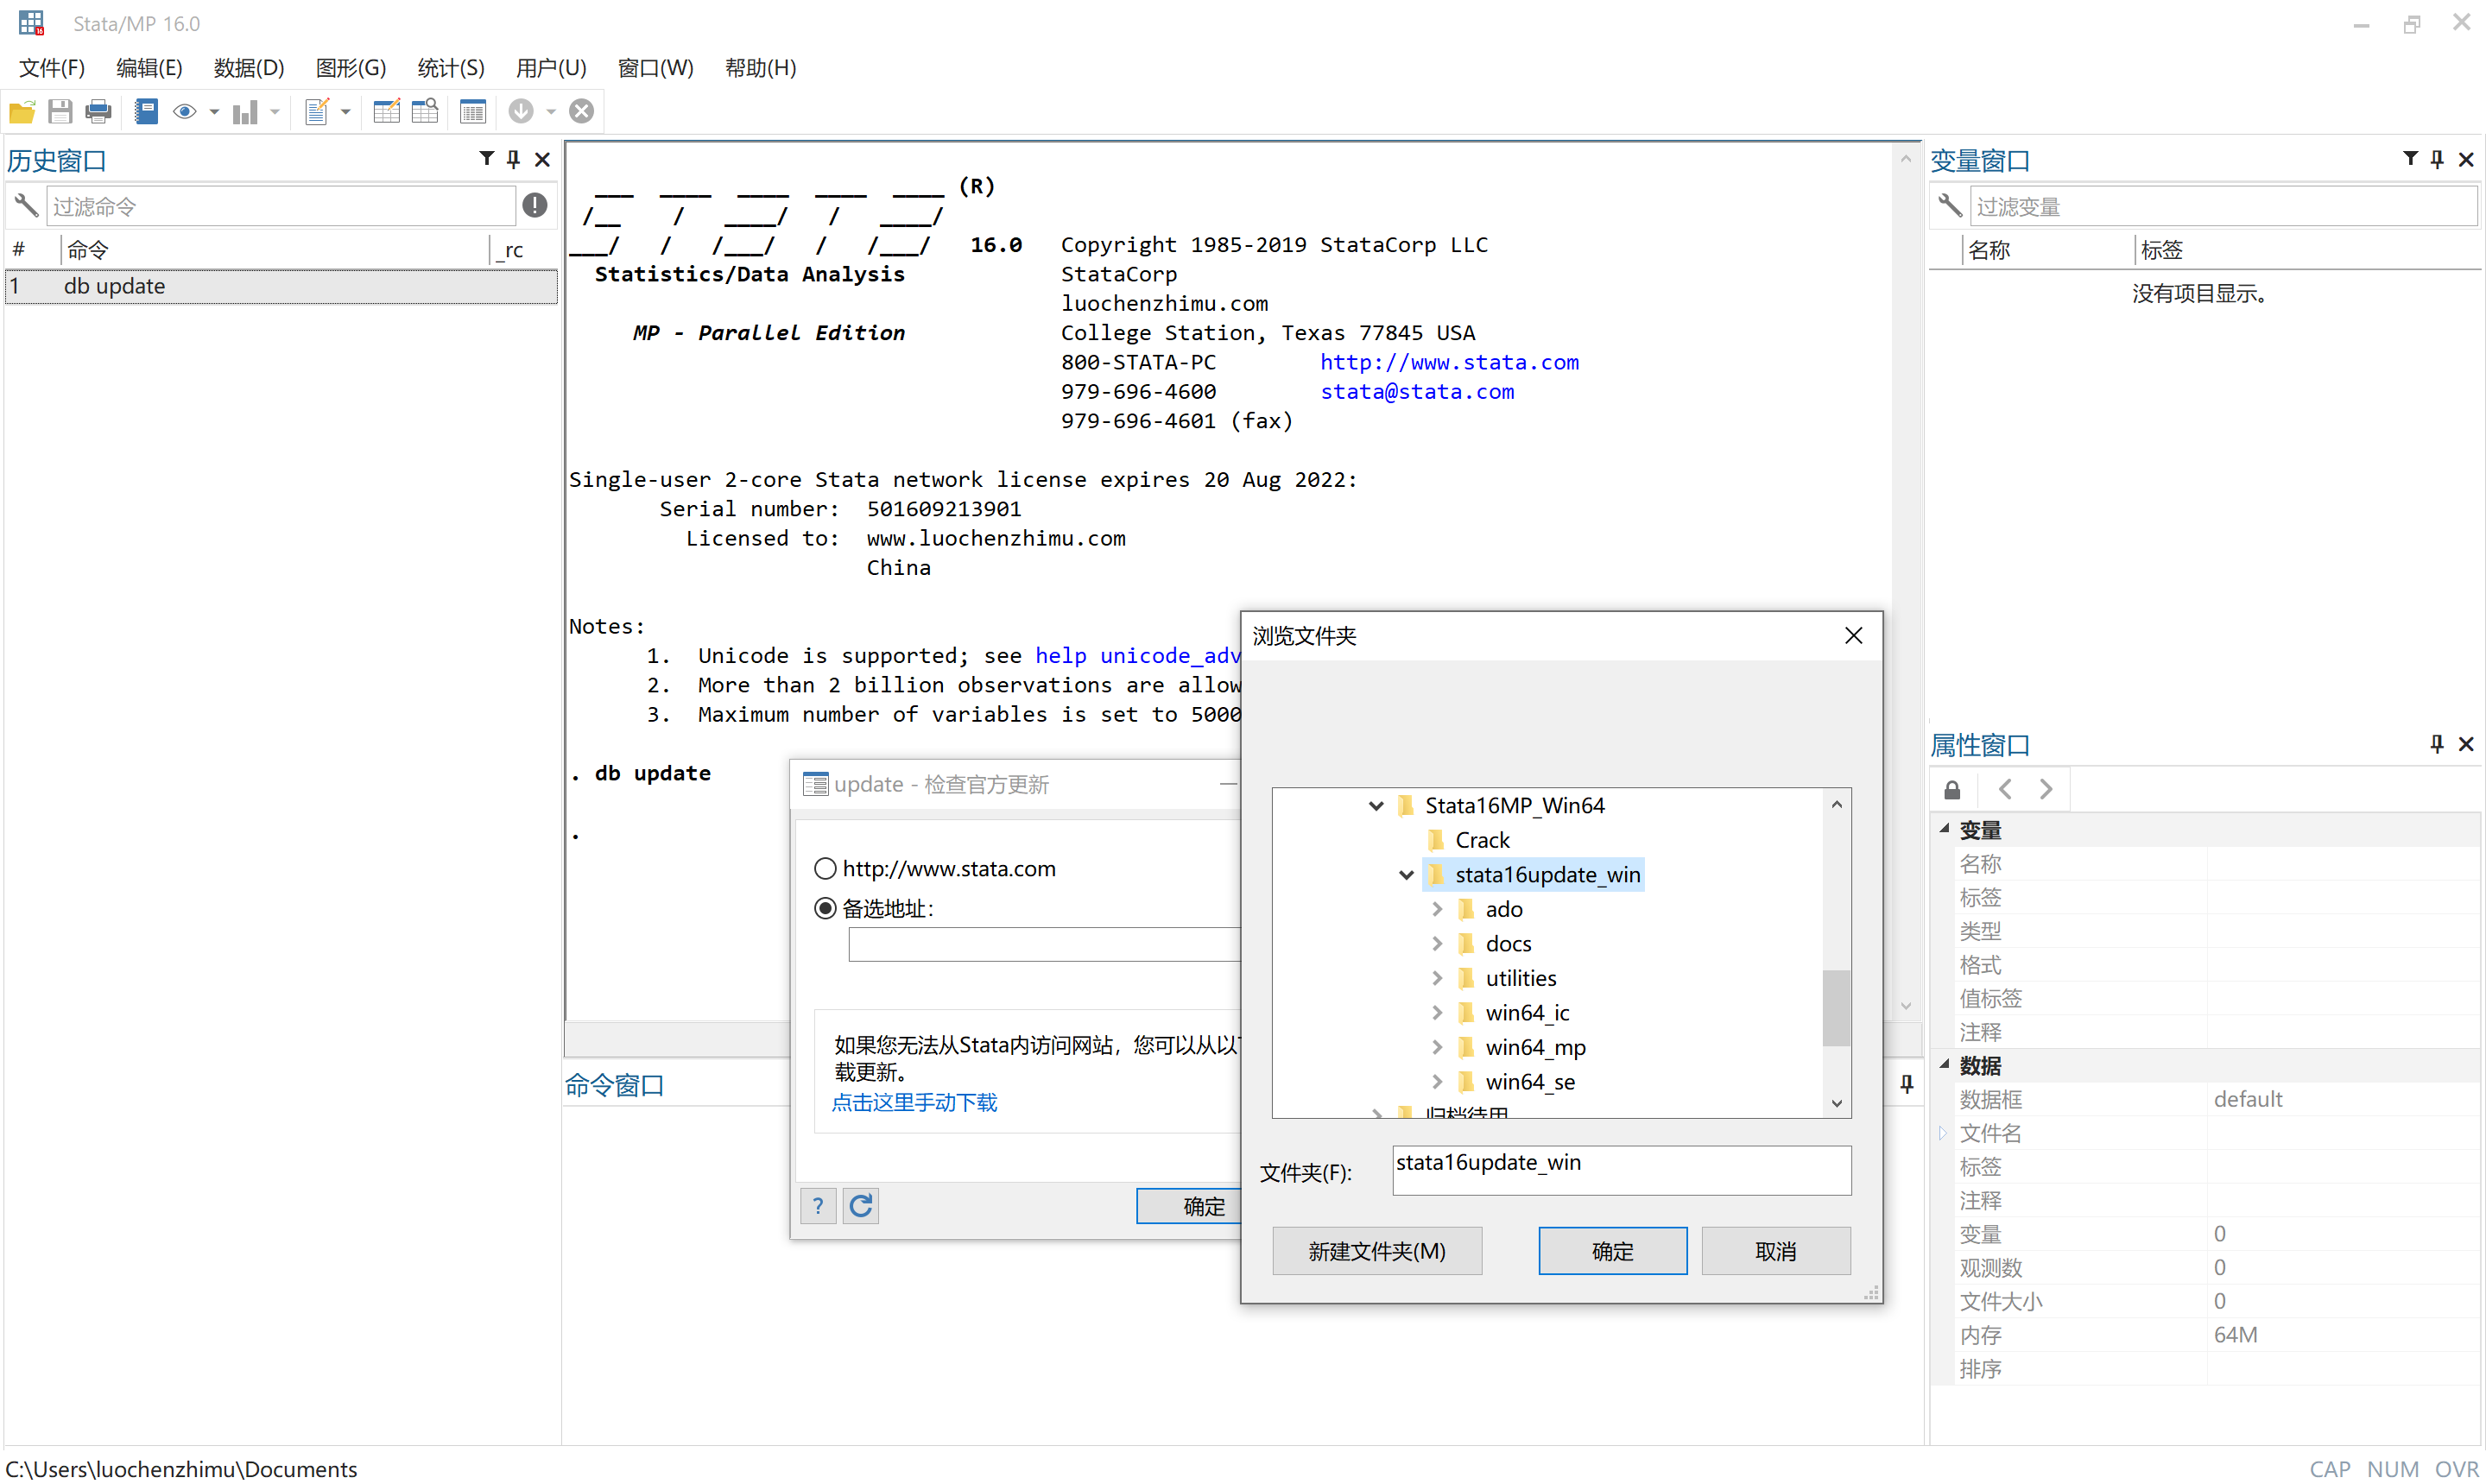
Local update method:
Open Stata, execute the command db update, and select the folder stata16update_win


![Wancai Animation Master | 0 Basic Animation Video [Software Recommendation] - Wood of Falling Dust](https://img.luochenzhimu.com/public/2024/05/2024051509.png)


![Official Windows 11 Release [Official MVS (MSDN)] [Windows 11 NI-23H2] February 2024 Image Update - Wood of Dust](https://img.luochenzhimu.com/public/2021/10/2021100515.jpg)