1、 Formula Disassembly
The so-called formula decomposition method is to decompose the influencing factors of an indicator layer by layer with a formula. Example: Analyze the reason for the low sales of a product, and decompose it by formula method

image.png
2、 Comparative analysis
The comparison method is to compare two or more groups of data, which is the most common method.
We know that isolated data is meaningless, and only when there is comparison can there be difference. For example, in the time dimension, year-on-year and month on month, growth rate, fixed base ratio, comparison with competitors, comparison between categories, comparison of characteristics and attributes, etc. The comparison method can find the data change rule, which is frequently used and often used in combination with other methods.
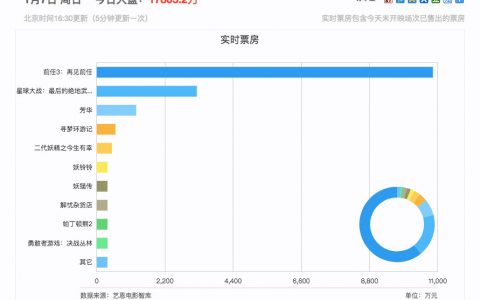
The following figure shows the comparison of sales of AB company. Although the sales of A company generally rose and was higher than that of B company, the growth rate of B company was rapid and higher than that of A company. Even though the growth rate declined in the later period, the final sales still caught up with and surpassed that of A.

Picture.png
III A/Btest
A/Btest, Two or more versions of the Web or App interface or process are respectively accessed by similar visitor groups in the same time dimension to collect User experience Data and business data, and finally analyze and evaluate the best version for formal adoption. The process of A/Btest is as follows:
(1) Status analysis and hypothesis building: analyze business data, determine the most critical improvement points at present, make assumptions for optimization and improvement, and put forward optimization suggestions; For example, we find that the conversion rate of users is not high. Let's assume that the conversion rate of the promoted landing page is too low, and we will find ways to improve it
(2) Set goals and plan: set main goals to measure the advantages and disadvantages of each optimized version; Set auxiliary targets to evaluate the impact of the optimized version on other aspects.
(3) Design and development: make 2 or more optimized design prototypes and complete the technical implementation.
(4) Allocate traffic: determine the diversion ratio of each online test version. At the initial stage, the traffic setting of the optimization scheme can be smaller, and the traffic can be gradually increased according to the situation.
(5) Collect and analyze data: collect experimental data and judge the validity and effect: if the statistical significance reaches 95% or more and maintains for a period of time, the experiment can be ended; If it is below 95%, the test time may need to be extended; If the statistical significance cannot reach 95% or even 90% for a long time, it is necessary to decide whether to stop the test.
(6) Finally: according to the test results, determine to release a new version, adjust the diversion ratio and continue the test, or continue to optimize the iteration scheme and re develop the online test if the test effect is not achieved. The flow chart is as follows:

image.png
4、 Quadrant analysis
Through the division of two or more dimensions, the desired value is expressed in the form of coordinates. Direct transformation from value to strategy, so as to carry out some landing promotion. Quadrant method is a strategy driven thinking, often associated with product analysis, market analysis, customer management, commodity management, etc. For example, the following figure shows the four quadrant distribution of an advertisement click. The X-axis from left to right represents from low to high, and the Y-axis from bottom to top represents from low to high.

image.png
The advertisement with high click rate and high conversion shows that the population is relatively accurate and it is an efficient advertisement. The advertisements with high click rate and low conversion rate indicate that most of the people who click in are attracted by the advertisements, while the low conversion indicates that the people targeted by the advertisement content are somewhat inconsistent with the actual audience of the product. The advertisements with high conversion and low click indicate that the target audience and the actual audience of the product are highly consistent, but the advertisement content needs to be optimized to attract more people to click. Advertisements with low click rate and low conversion can be abandoned. And classic RFM model The customer is divided into eight quadrants according to the three dimensions of the latest consumption, frequency and monetary amount.

image.png
Advantages of quadrant method: (1) find common causes of problems
Through quadrant analysis, we can analyze the causes of events with the same characteristics and summarize the common causes. For example, those advertised above case The events in the first quadrant can extract effective promotion channels and strategies, and the third and fourth quadrants can exclude some ineffective promotion channels;
(2) Set up a grouping optimization strategy The quadrant analysis method for launching can set up optimization strategies for different quadrants. For example, in the RFM customer management model, customers are divided into different types according to the quadrants, such as key development customers, key retention customers, general development customers, and general retention customers. Give more resources to key development customers, such as VIP service, personalized service, additional sales, etc. Sell more valuable products to potential customers, or some preferential measures to attract them back.
5、 Pareto analysis
Pareto's law originates from the classical two eight law. For example, in terms of personal wealth, 20% of the world's people hold 80% of the wealth. And in Data analysis In, it can be understood that 20% of the data has produced 80% of the effect and needs to be mined around the 20% of the data. It is often related to ranking when using the 28/20 rule, and the top 20% is considered as valid data. The two eight method is to focus on key analysis and is applicable to any industry. Find the key points, find the characteristics, and then think about how to transform the remaining 80% to the 20% to improve the effect.
Generally, it will be used in product classification to measure and build ABC model. For example, a retail enterprise has 500 SKUs and the corresponding sales volume of these SKUs. Which SKUs are important? This is the business operate To distinguish the primary and secondary issues.
A common practice is to take the product SKU as a dimension, use the corresponding sales volume as a basic measurement indicator, rank these sales volume indicators from large to small, and calculate the percentage of the cumulative total sales volume of the product SKU in the total sales volume up to the current time.
If the percentage is within 70% (inclusive), it is classified as Class A. The percentage is within 70~90% (inclusive), which is classified as Class B. The percentage is within 90~100% (inclusive), which is classified as Class C. The above percentages can also be adjusted according to the actual situation.
ABC analysis model can be used not only to divide products and sales, but also customers and customer transaction volume. For example, which customers contribute 80% of the profits to the enterprise, and how much they account for. If there are 20% customers, we should focus on maintaining these 20% customers when resources are limited.

image.png
6、 Funnel analysis
The funnel method is a funnel chart, a bit like an inverted pyramid, which is a process based way of thinking. It is often used in the analysis of changes and certain processes, such as the development of new users and the conversion rate of shopping.

image.png
The picture above is classic Marketing Funnel, which vividly shows a sub link in the whole process from acquiring users to eventually converting to purchasing. The conversion rate of adjacent links refers to the use of data indicators to quantify the performance of each step. So the whole funnel model is to first split the whole purchase process into steps, then measure the performance of each step with the conversion rate, and finally find out the problematic link through the abnormal data indicators, so as to solve the problem, optimize the step, and finally achieve the goal of improving the conversion rate of the whole purchase.
The core idea of the overall funnel model can actually be classified as decomposition and quantification. For example, when analyzing the transformation of e-commerce, what we need to do is to monitor the transformation of users at each level and find the optimization points at each level. For users who do not follow the process, their transformation model is specially drawn to shorten the path and improve the user experience.
There is also the classic hacker growth model, the AARRR model, which refers to Acquisition, Activation, Retention, Revenue, Referral, namely user acquisition, user activation, user retention, user revenue, and user communication. This is a common model in product operation. Combining the characteristics of the product itself and the life cycle position of the product, we focus on different data indicators and ultimately develop different operation strategies.
From the following figure of the AARRR model, it can be seen clearly that the entire user's life cycle is gradually decreasing. By disassembling and quantifying each link of the entire user life cycle, you can compare the data horizontally and vertically to find the corresponding problems, and finally carry out continuous optimization iterations.

image.png
7、 Path analysis
User path analysis tracks the user's behavior path from a start event to an end event, that is, it monitors the user flow direction, which can be used to measure Website optimization The ultimate goal is to achieve business goals, guide users to complete the optimal path of products more efficiently, and ultimately urge users to pay. How to analyze user behavior path?
(1) Calculate each first step when users use the website or APP, and then calculate the flow direction and transformation of each step in turn. Through the data, the whole process of users from opening the APP to leaving is truly reproduced. (2) View the path distribution when users use the product. For example, after visiting the home page of an e-commerce product, what percentage of users searched, what percentage of users visited the category page, and what percentage of users directly visited the product details page. (3) Conduct path optimization analysis. For example, which path is accessed most by users; At which step, users are most likely to be lost. (4) Identify user behavior characteristics through paths. For example, analyze whether users are goal oriented or aimless. (5) Subdivide users. Users are usually classified according to the purpose of APP. For example, auto APP users can be subdivided into focused, intentional, and purchasing users, and each type of user can be analyzed for the path of different access tasks. For example, intentional users, what are their paths and problems when comparing different models. Another method is to use algorithms to cluster users based on all access paths, classify users based on the similarity of access paths, and then analyze each type of users.
Taking e-commerce as an example, the process of buyers from logging in to the website/APP to paying successfully involves home page browsing, searching for goods, adding shopping cart, submitting orders, paying orders, etc. However, the real purchase process of users is an intertwined process. For example, after submitting an order, users may return to the home page to continue searching for goods or cancel the order. Each path has different motivations. After in-depth analysis in cooperation with other analysis models, it can find the motivation of fast users and lead users to the optimal path or expected path. Example of user behavior path diagram:

image.png
8、 Retention analysis
User retention means that new members/users still have specific attributes and behaviors such as access, login, use or conversion after a certain period of time. The proportion of retained users in new users at that time is the retention rate. The retention rate is divided into three categories according to different periods, taking the retention identified by the login behavior as an example: the first type of daily retention, which can be subdivided into the following categories: (1) the retention rate of the next day: (among the new users on the same day, the number of users who log in on the second day)/the total number of new users on the first day (2) the retention rate of the third day: (among the new users on the first day, the number of users who log in on the third day) /Total number of new users on the first day (3) Retention rate on the seventh day: (among the new users on the first day, there are also logged in users on the seventh day)/Total number of new users on the first day (4) Retention rate on the fourteenth day: (among the new users on the first day, there are also logged in users on the fourteenth day)/Total number of new users on the first day (5) Retention rate on the 30th day: (among the new users on the first day, the number of users logged in on the 30th day)/the total number of new users on the first day
The second type of weekly retention, the retention rate in weekly units, refers to the number of new users that still have login users in each week for the first week.
The third type is monthly retention. The monthly retention rate refers to the number of new users that still log in each month compared with the first week. The retention rate is for new users. The result is a matrix half face report (only half of which has data). Each data record line is a date and listed as the retention rate in different time periods. Under normal circumstances, the retention rate will gradually decrease over time. The following is a monthly user retention curve generated by taking monthly retention as an example:

image.png
9、 Cluster analysis
Cluster analysis is exploratory Data analysis method. Usually, we use cluster analysis to group and classify seemingly disordered objects to better understand the research objects. The clustering results require a high similarity of objects within the group and a low similarity of objects between groups. In user research, many problems can be solved by cluster analysis, such as the information classification of websites, the relevance of click behavior of web pages, and user classification. Among them, user classification is the most common case.
There are many common clustering methods, such as K-Means, Spectral Clustering, and Hierarchical Clustering. Take the most common K-means as an example, as shown below:

image.png
It can be seen that data can be divided into three different clusters (red, blue and green), and each cluster should have its own unique properties. Obviously, cluster analysis is an unsupervised learning and a classification model without labels. When we cluster the data and get clusters, we usually analyze each cluster separately to get more detailed results.
Author: Data Cicada


![[Dry goods] Basic ideas and techniques of data analysis](https://www.iyunying.org/wp-content/uploads/2014/10/09533155K-0-480x300.jpg)