Previously, the charging head network introduced in detailPOWER-ZKM002CTesterWith the detailed analysis of charging data recorded by upper computer, the new ChargerLABPOWER-ZKM003CPD3.1TesterIt is still the same. In addition to recording data independently, it can also record data with the upper computer.
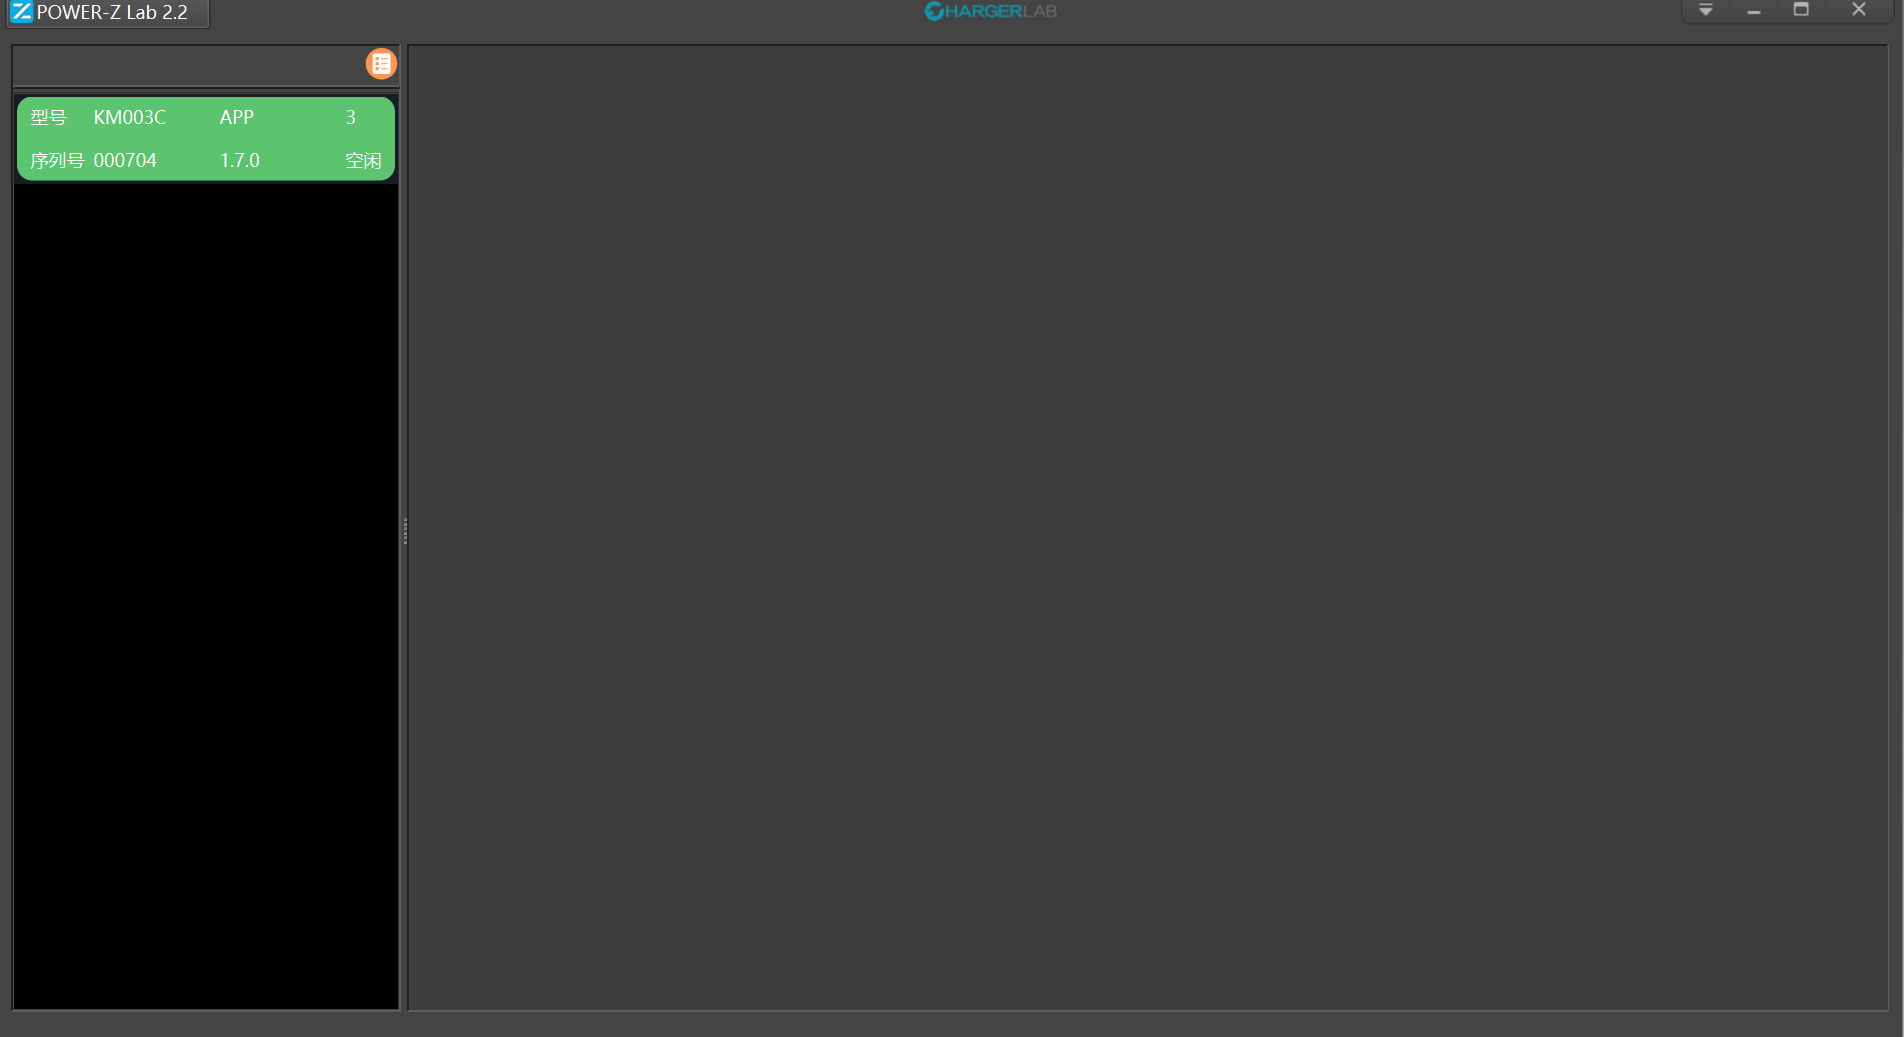
After downloading the upper computer APP at the computer end,POWER-ZKM003CTesterConnect to the computer through the HID USB-C port and the USB-C cable. Open the APP and you will see the same interface as the one shown above;At the same time, you can see the left sideKM003CThe option box of is displayed in green, indicating that theTester。
The dark black area on the left shows the number of testers connected to the computer, and the light gray area on the right shows the specific data changes detected by each tester.
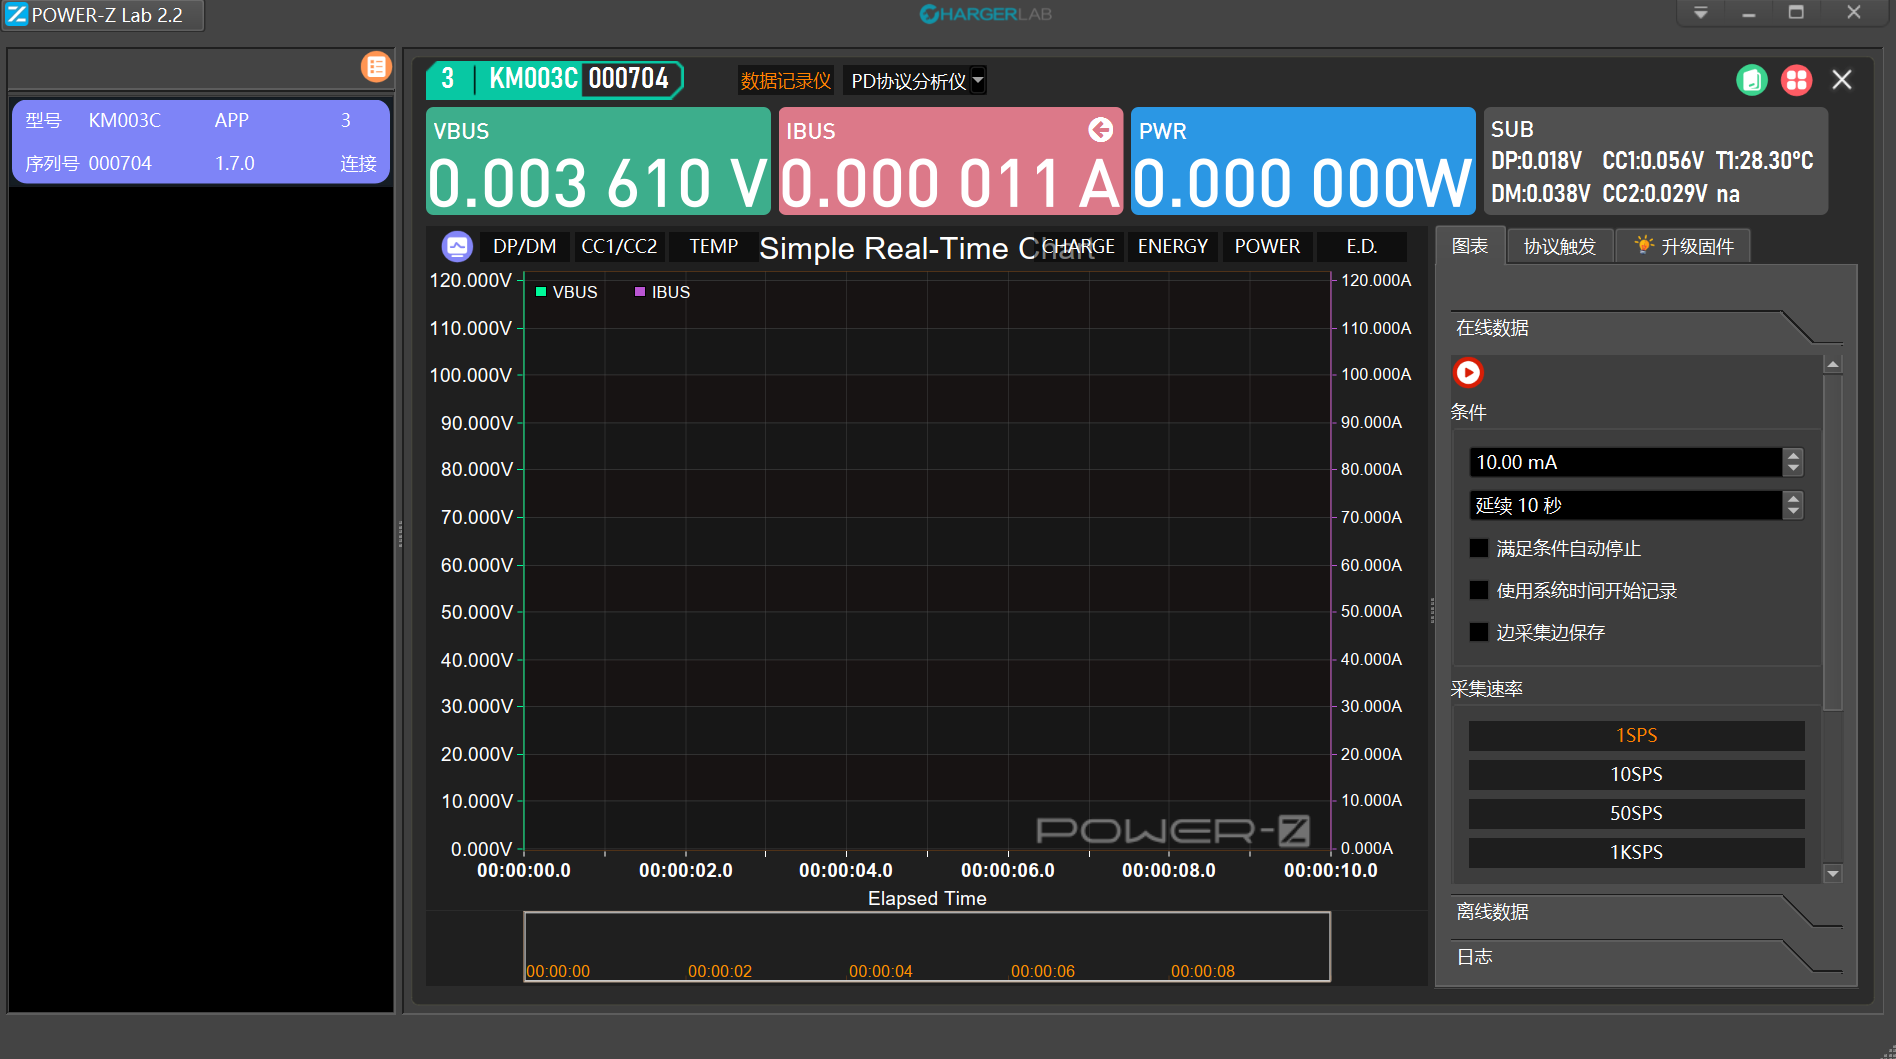
After double clicking the green option box, the option box turns purple, and the right area displays the specific monitoring screen, where you can clearly understand the data changes during the device charging.
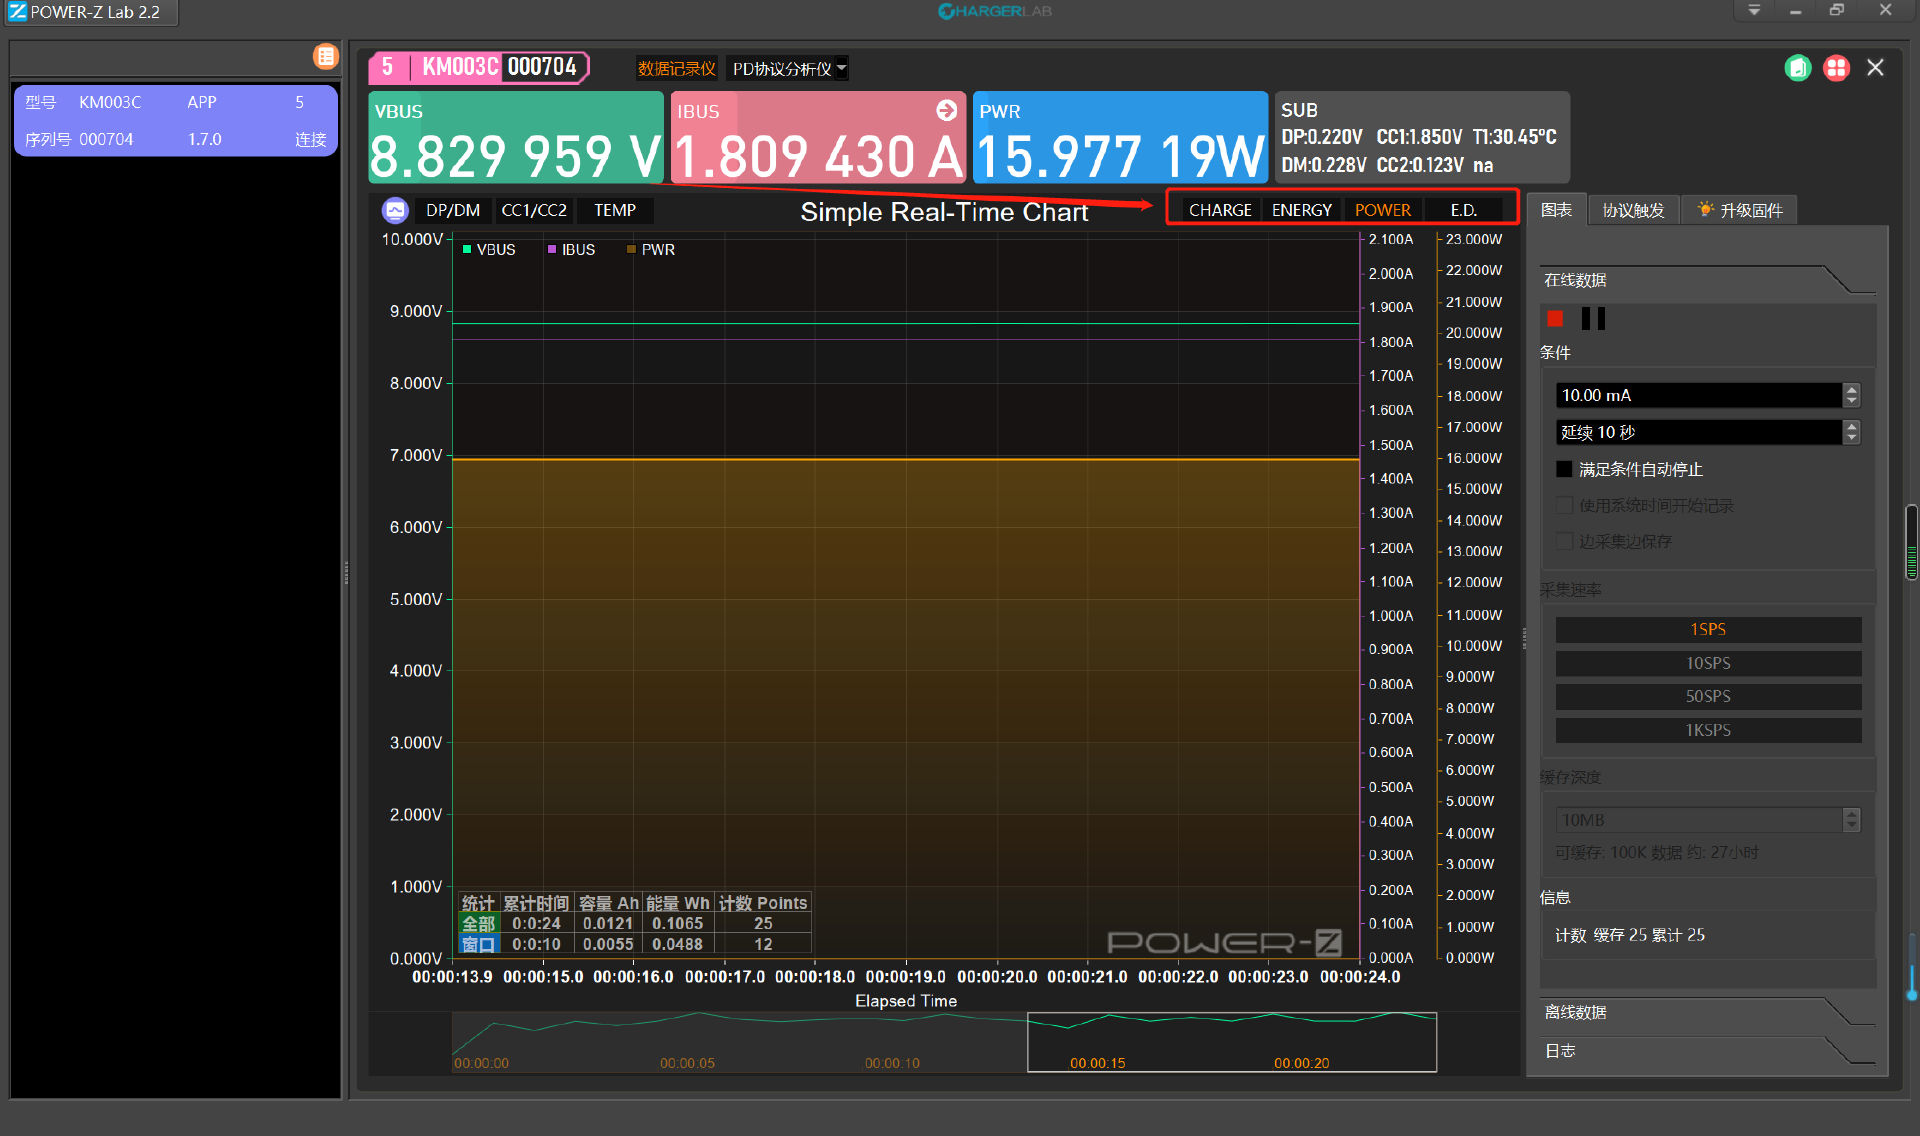
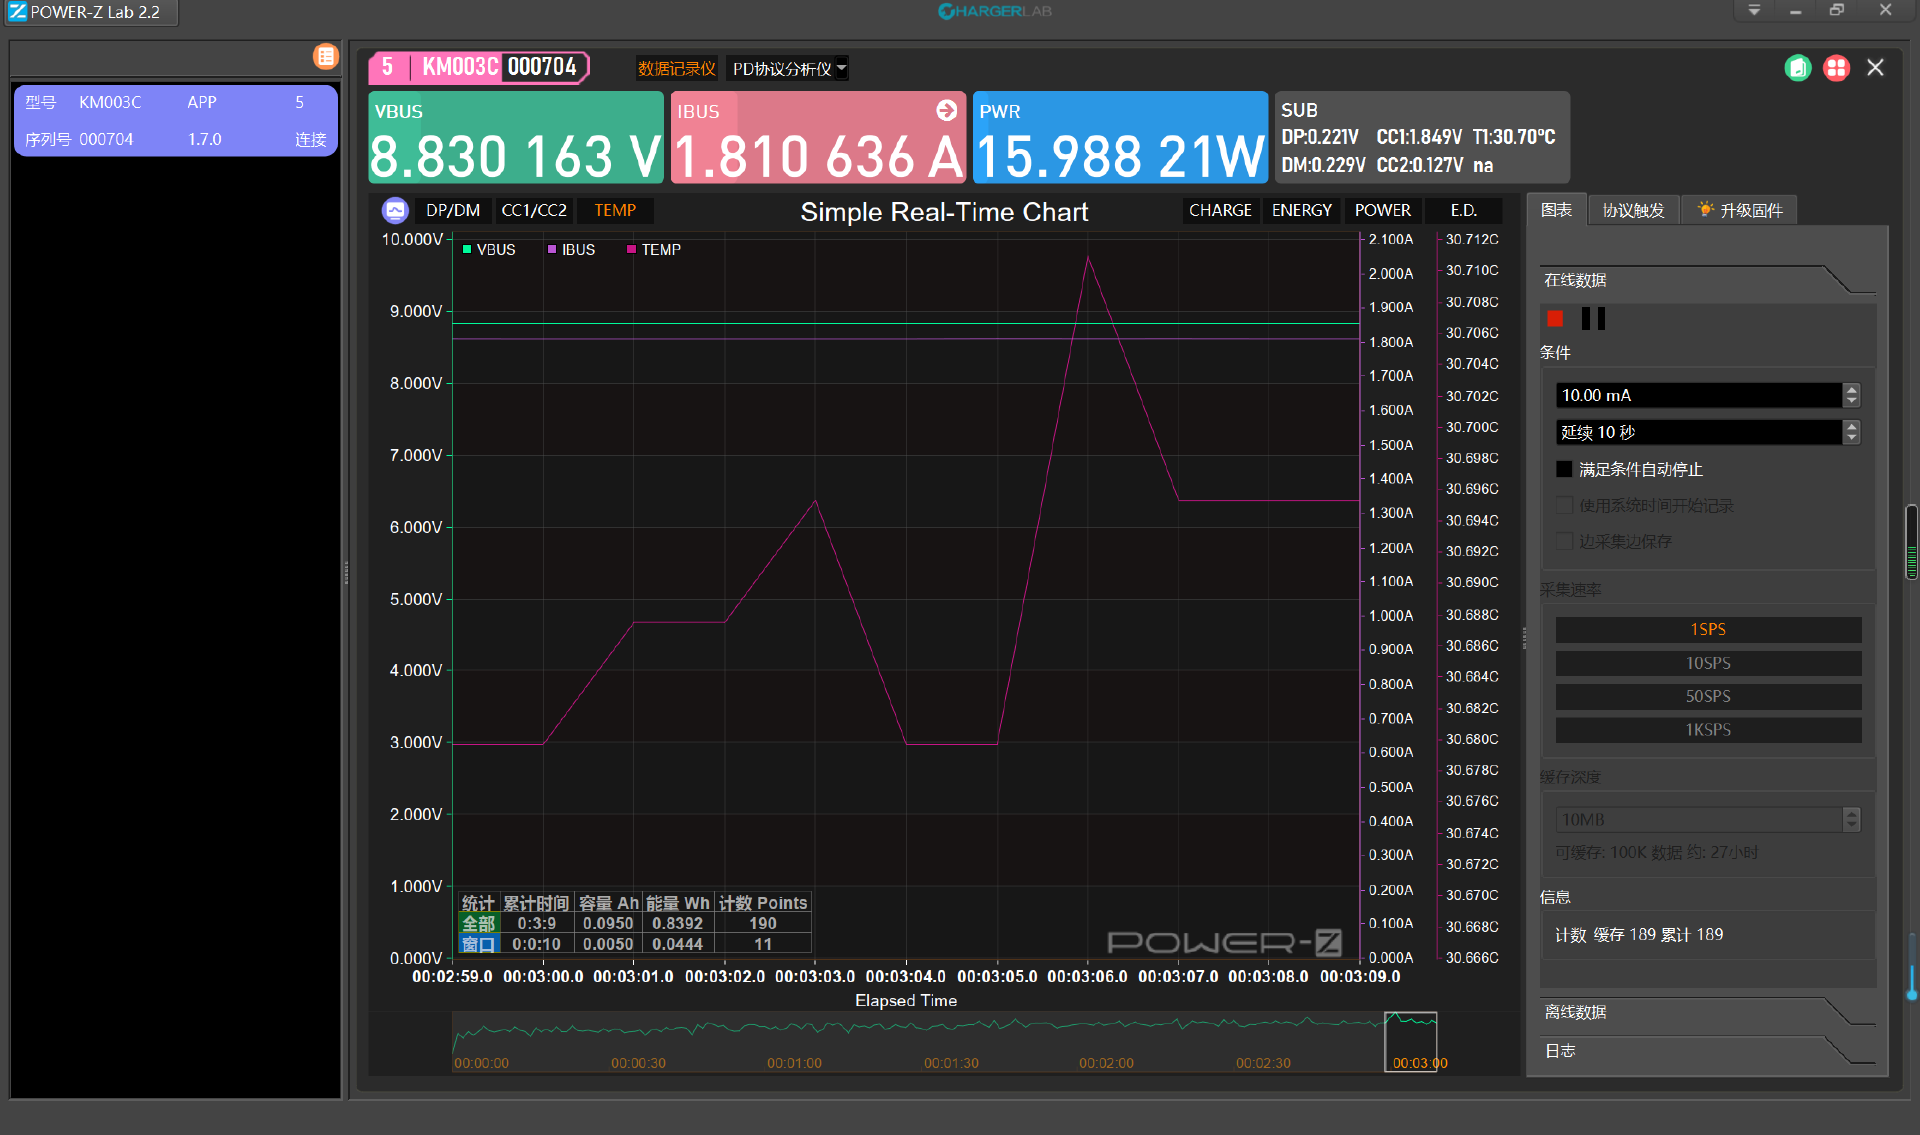
takePOWER-ZKM003CAfter the PD3.1 tester is connected to the charging equipment, the display interface is shown in the figure above;In the upper computer APP, you can monitor the data changes in real time, as well as the specific values of voltage, current and power.
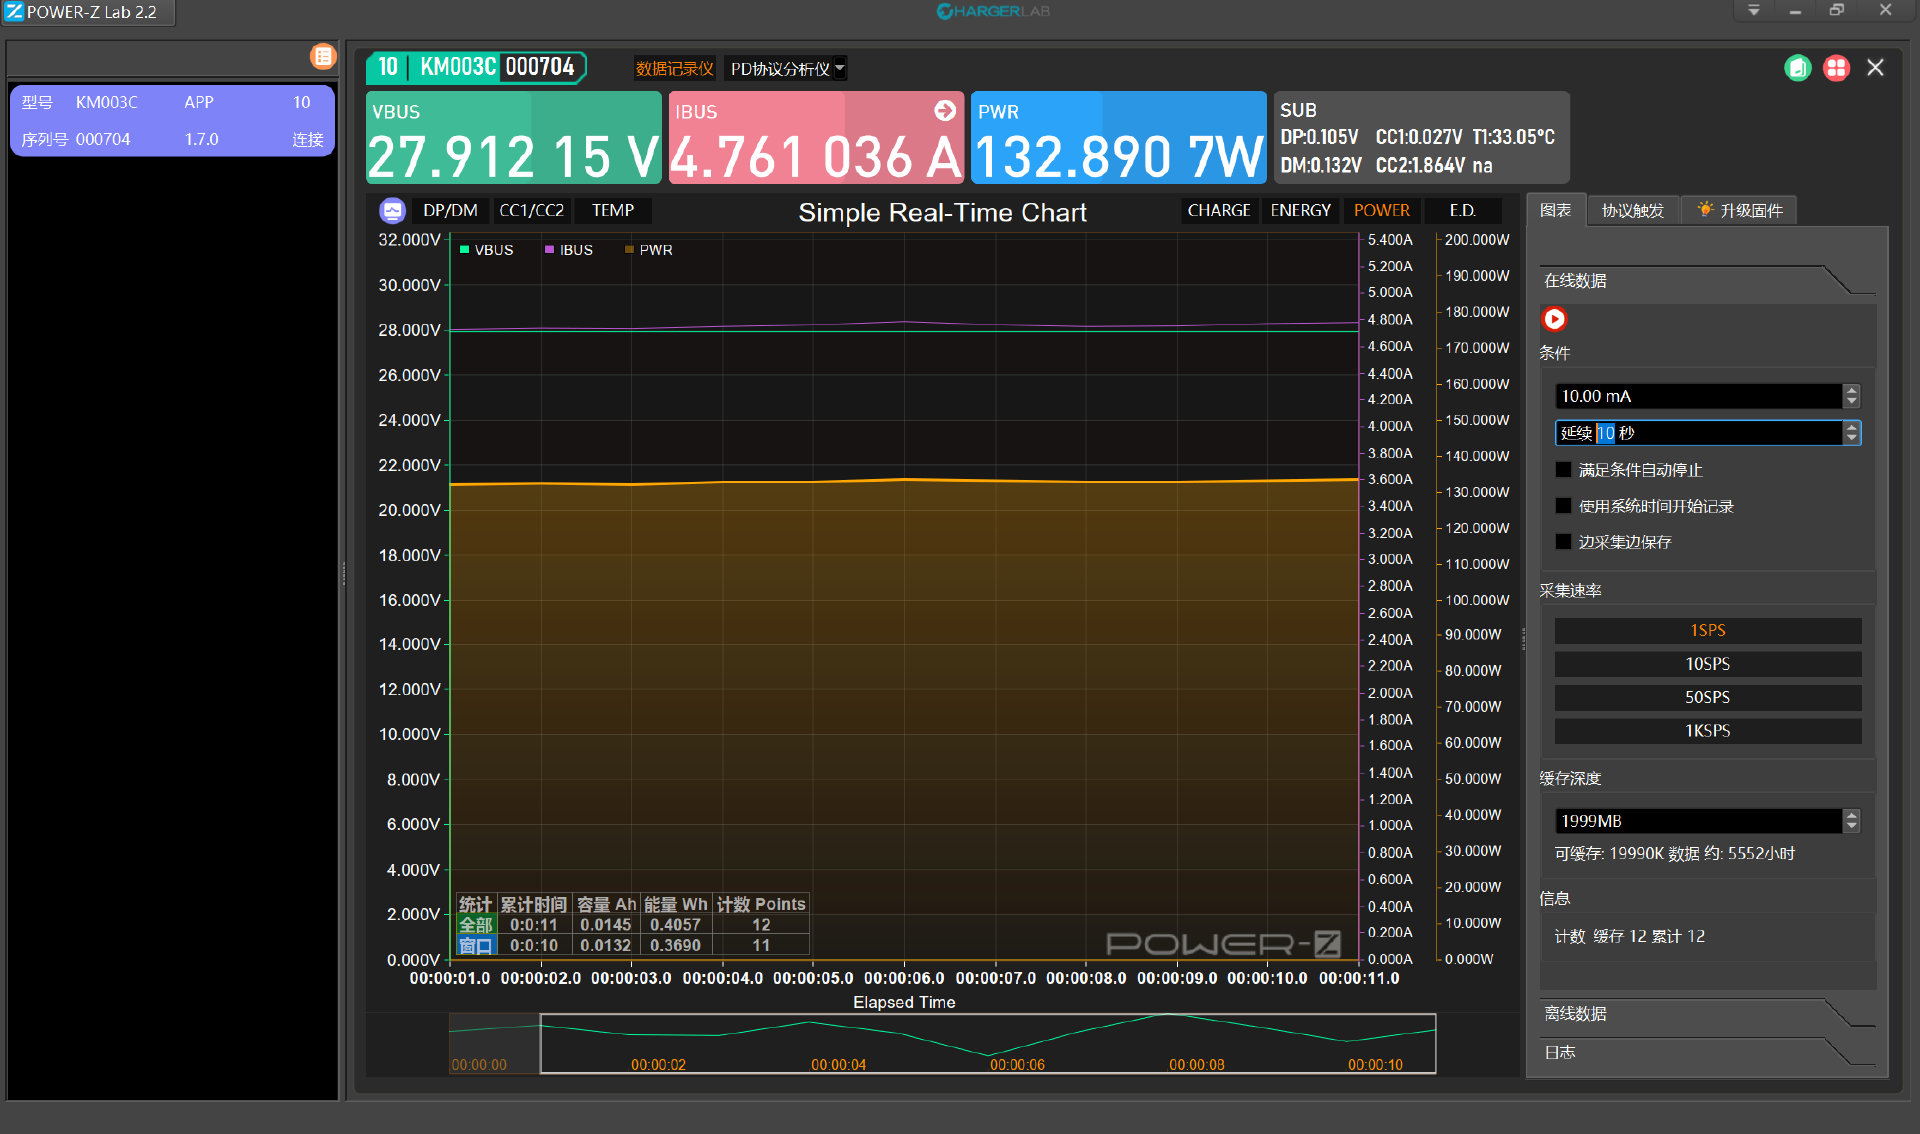
At the same time, the curve of data changes can be monitored in real time, such asPOWER-ZThe KM003C PD3.1 tester is connected to the upper computer of the computer and monitors the image of Apple 140W GaN charger charging the MacBook Pro 16 M1 Max 2021 notebook. At this time, the charging voltage is about 27.91V and the power is about 132.89W.
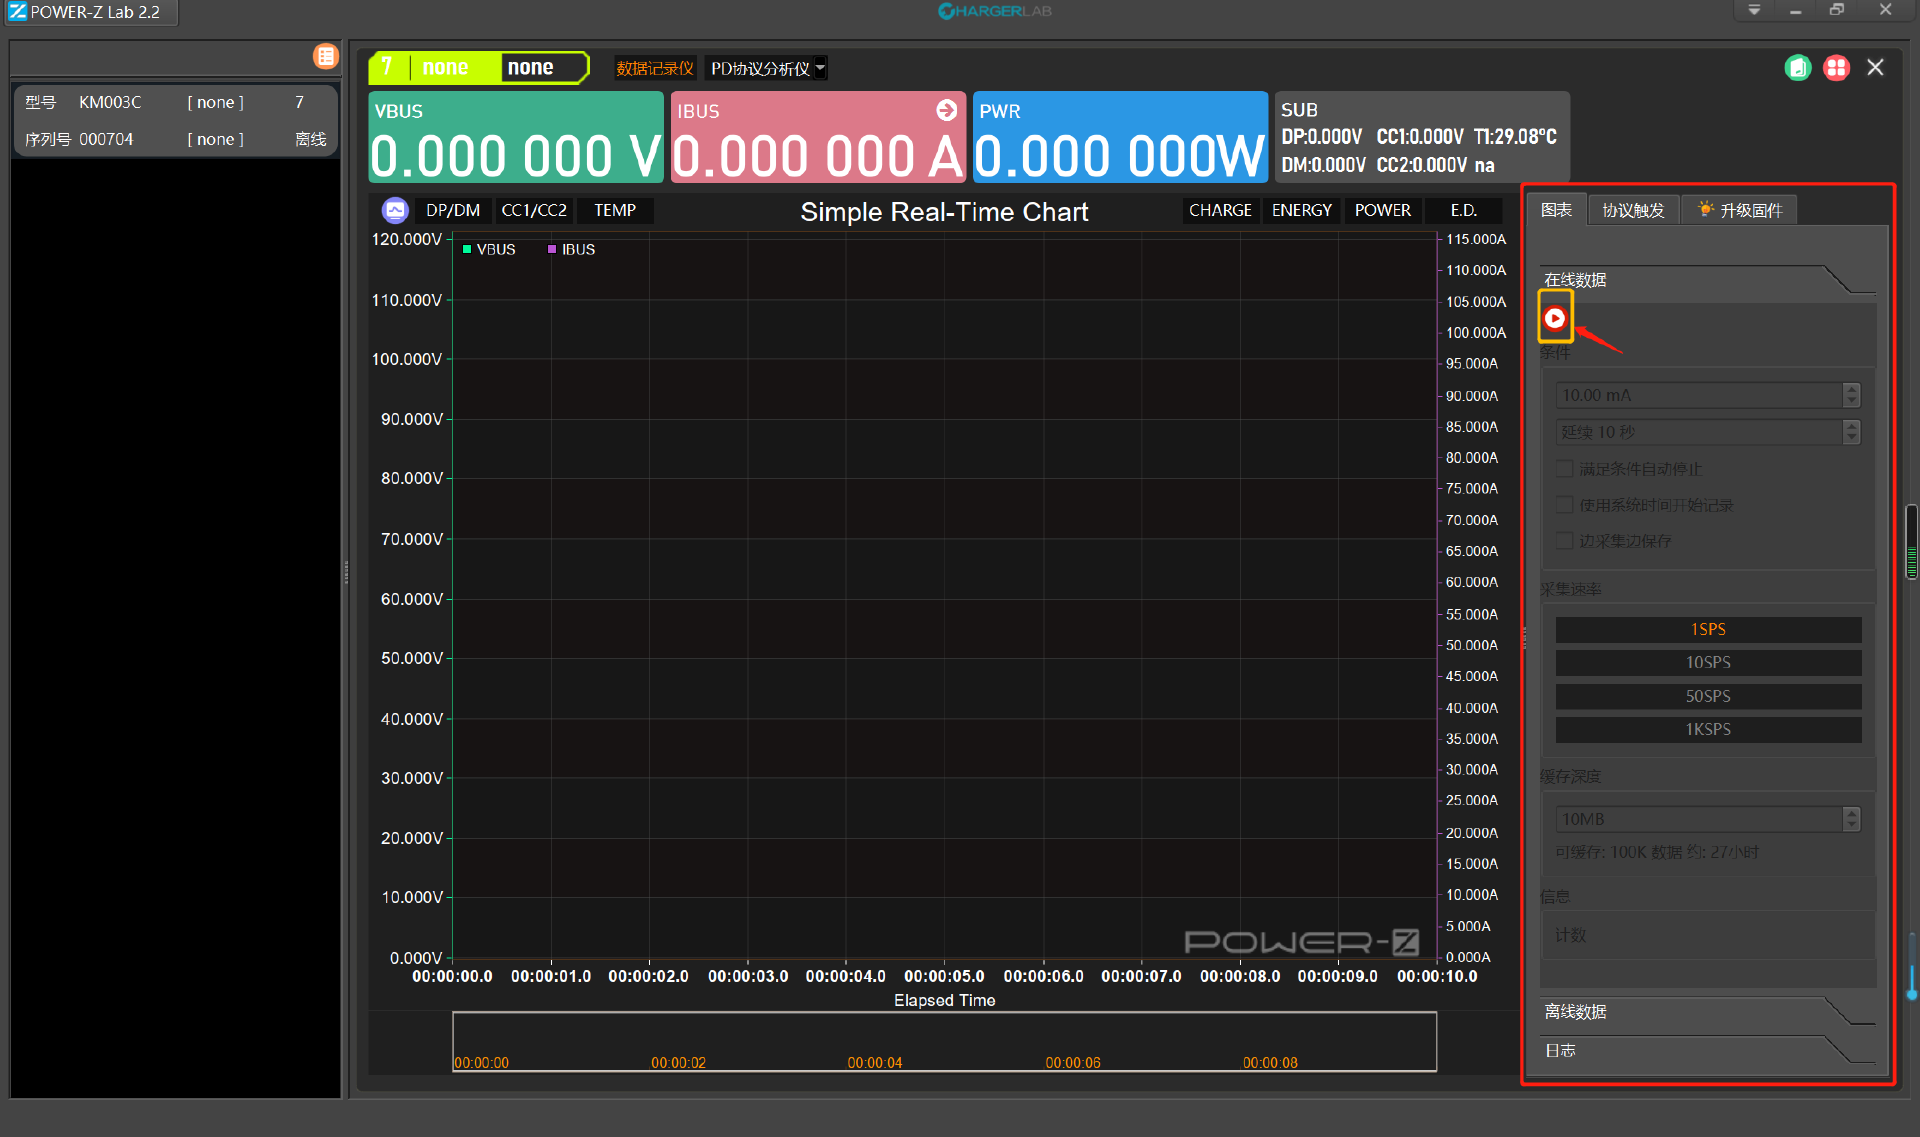
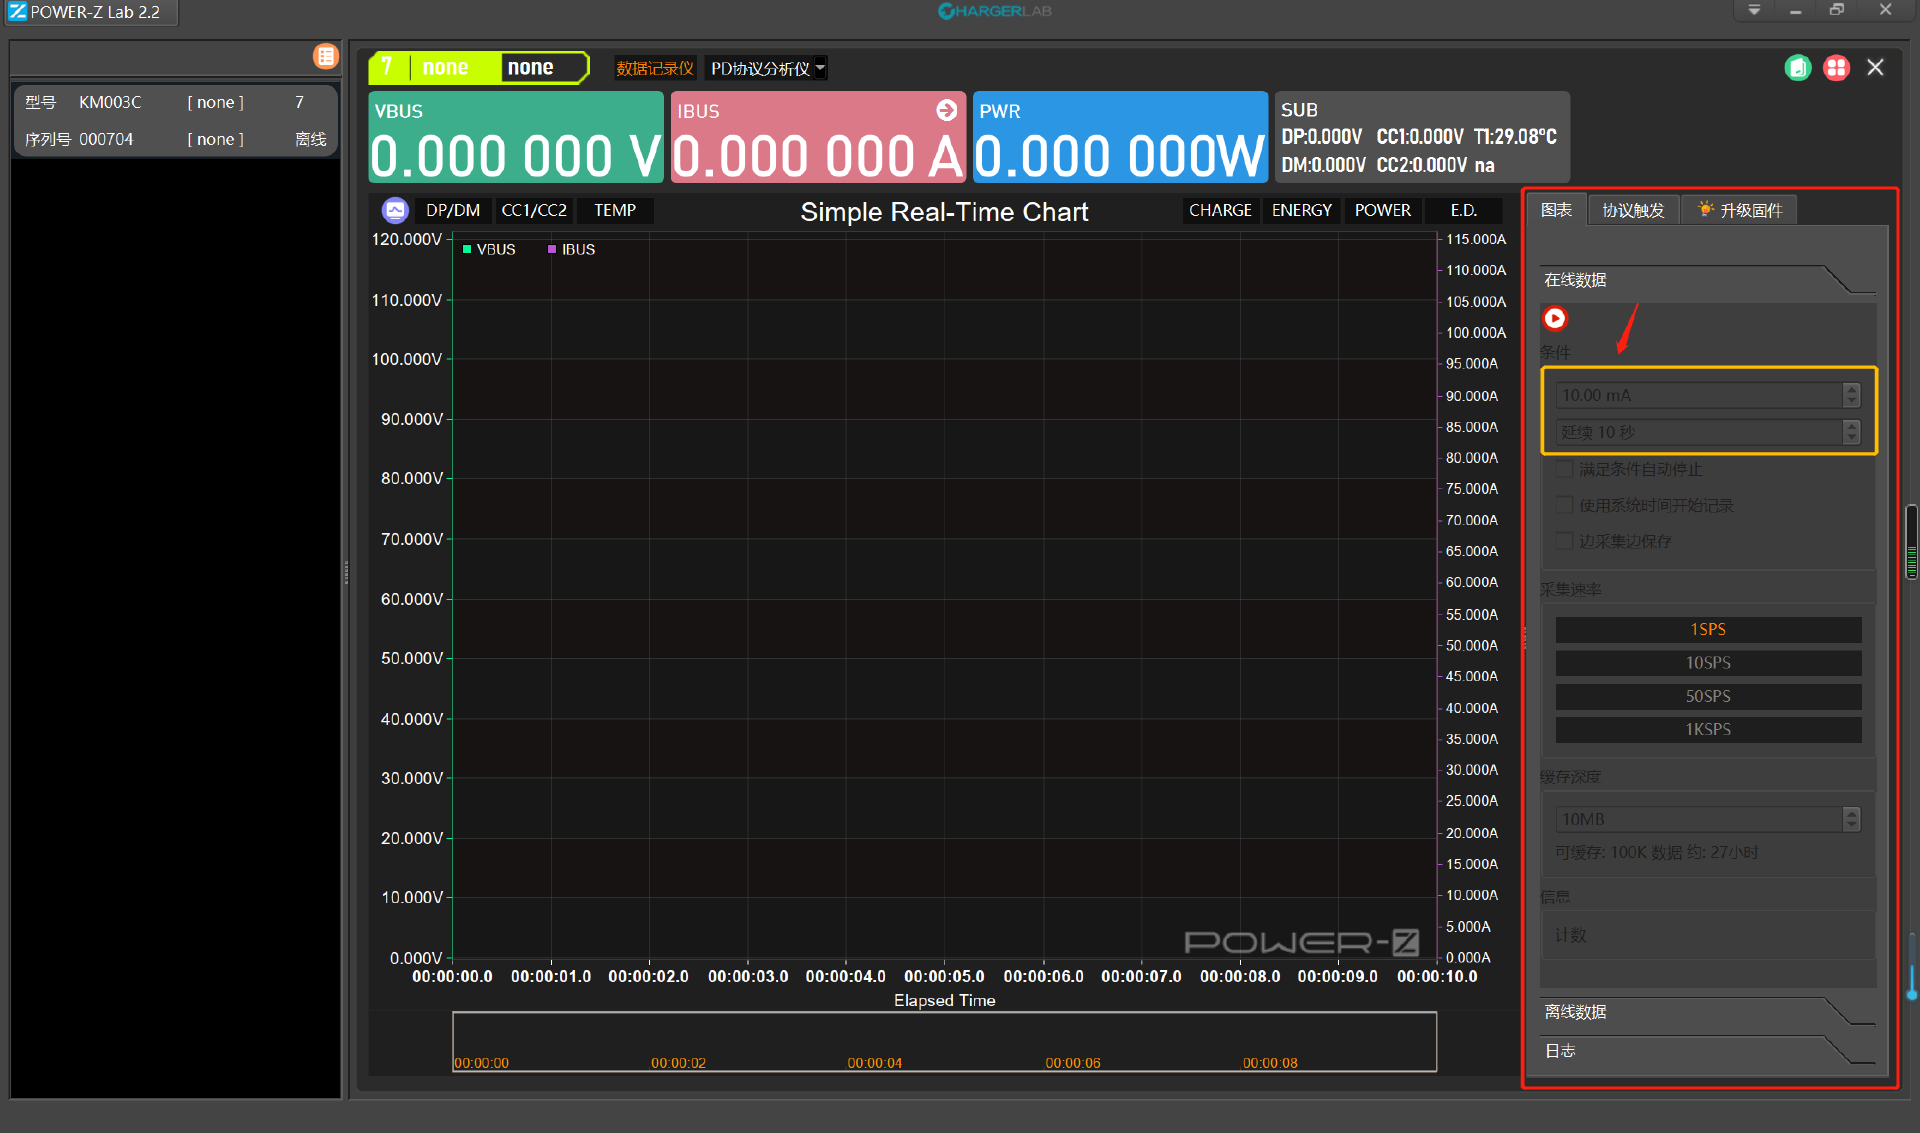
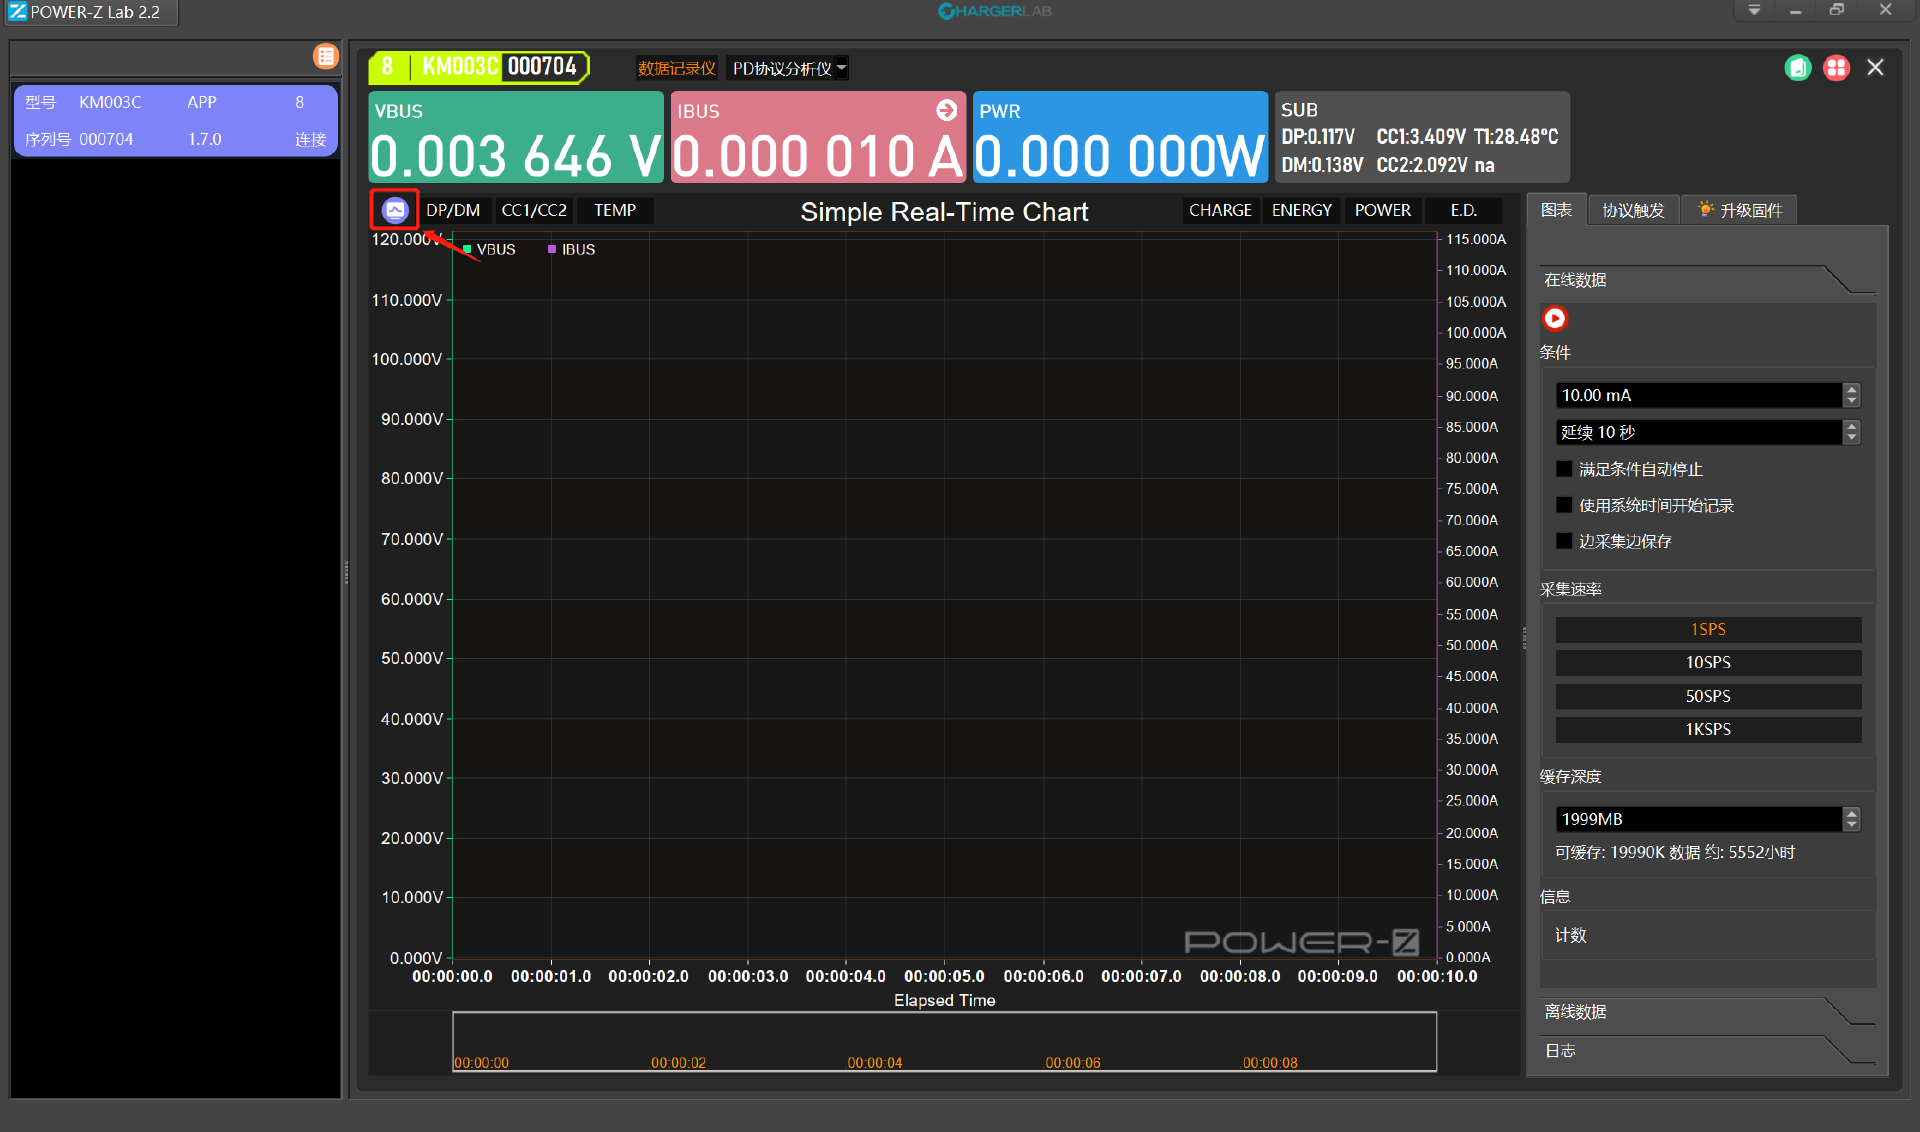
In the operation interface of the upper computer, the function area can set and adjust more parameter information. In the red box, click the identification in the yellow box, and the upper computer will start recording charging data.
The minimum value of current can be set in the yellow box of this interface, that is, when the current during charging reaches the set minimum value, the recording will stop;In addition, the lower part can also set that when the current reaches the set minimum value and lasts for a certain set time, the automatic stop and save while collecting will be triggered only when the conditions are met, which can avoid that the large capacity equipment such as outdoor power supply will spend too long in charging/discharging, and the tester cannot monitor in real time, resulting in redundant and useless data.
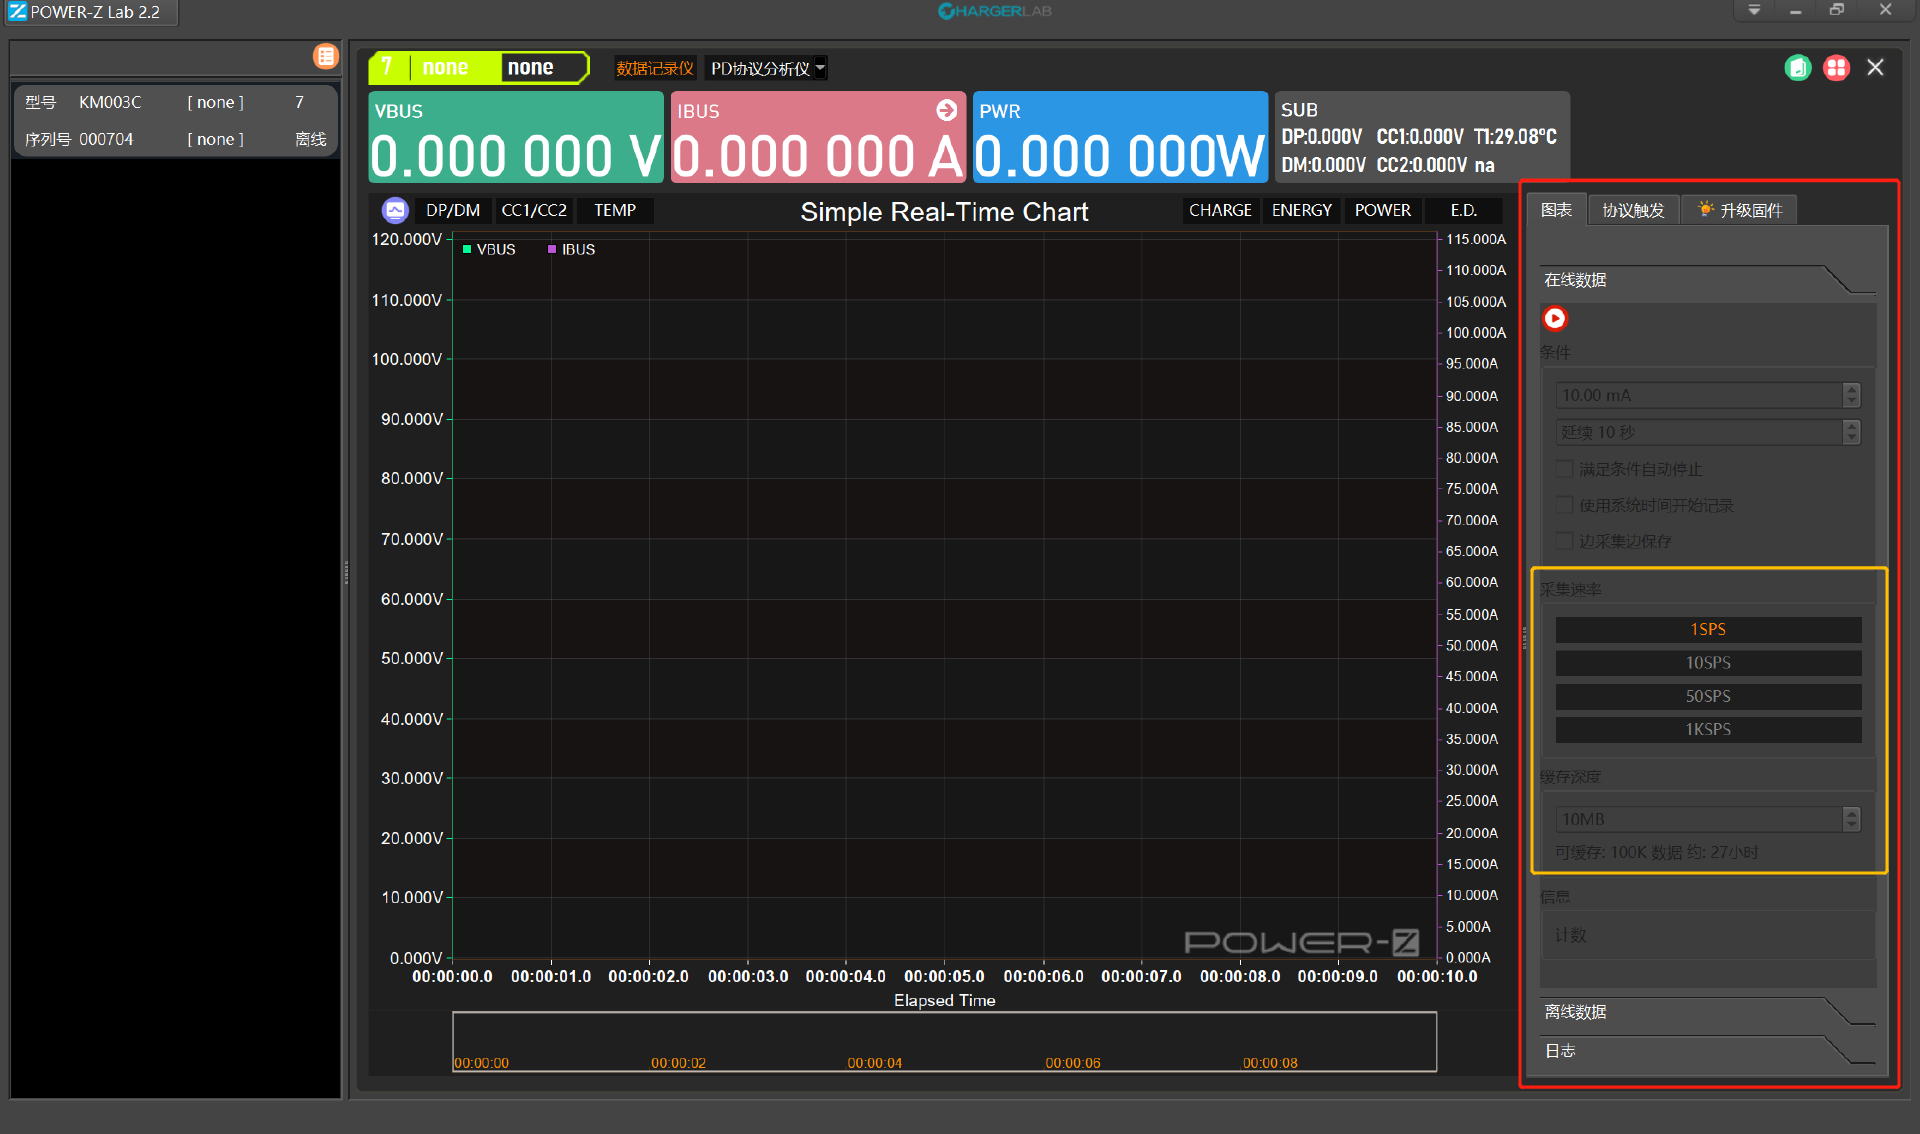
Acquisition rate: here you can set the number of data collected by the upper computer in one second, with four options: 1 time/s, 10 times/s, 50 times/s and 1000 times/s.
Cache depth: You can set the size of the upper computer's storage space. More storage capacity means more test data can be stored. The amount of data that can be recorded is also different when you set different storage depths.The cache depth determines the size and duration of cacheable data, and the collection rate determines the duration.
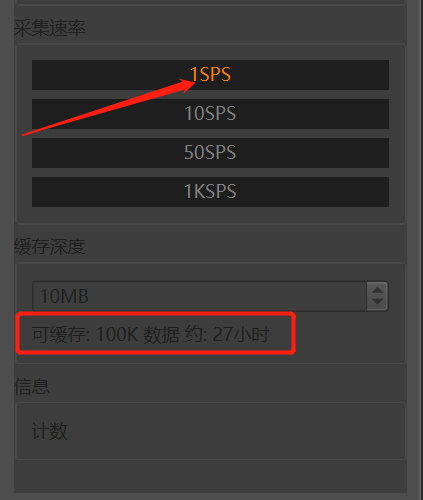
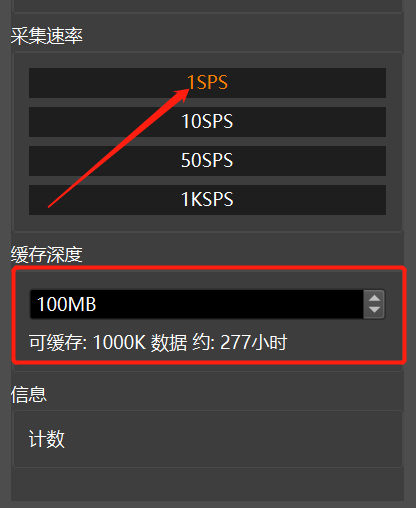
For example, if the collection rate is selected once/s, the number of data that can be cached is 100000, and the time can be recorded for about 27 hours.
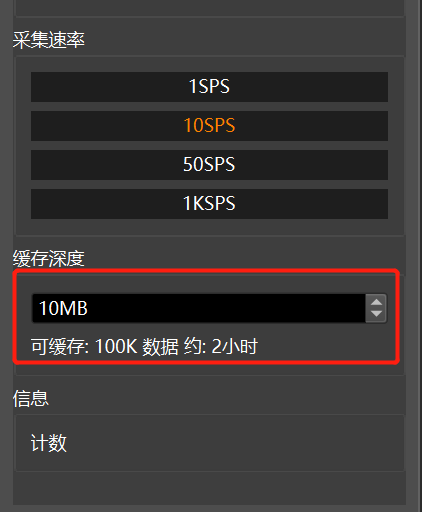
The collection rate is selected as 10 times/s. Although the amount of data tested per second is increased and the recording time is shortened to 2 hours, the amount of data that can be cached is still 100000.
Maintain the acquisition rate of 1 time/s, and adjust the cache depth to 100MB. At this time, the amount of data that can be cached increases to 1 million, and about 2777 hours of test time can be recorded.
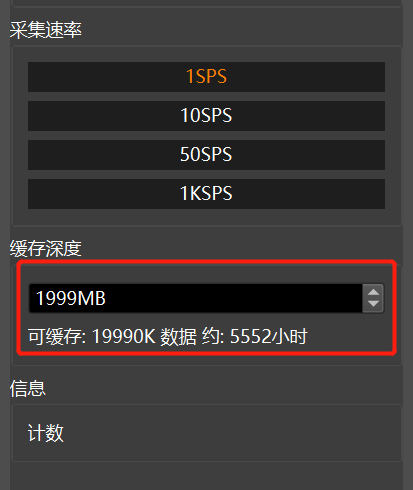
At present, the maximum cache depth of the upper computer can reach 1999MB, which can cache 19990000 pieces of data and record 5552 hours of time.
Click the "POWER" option in the red box, and the power display will be increased at the position of the middle curve.
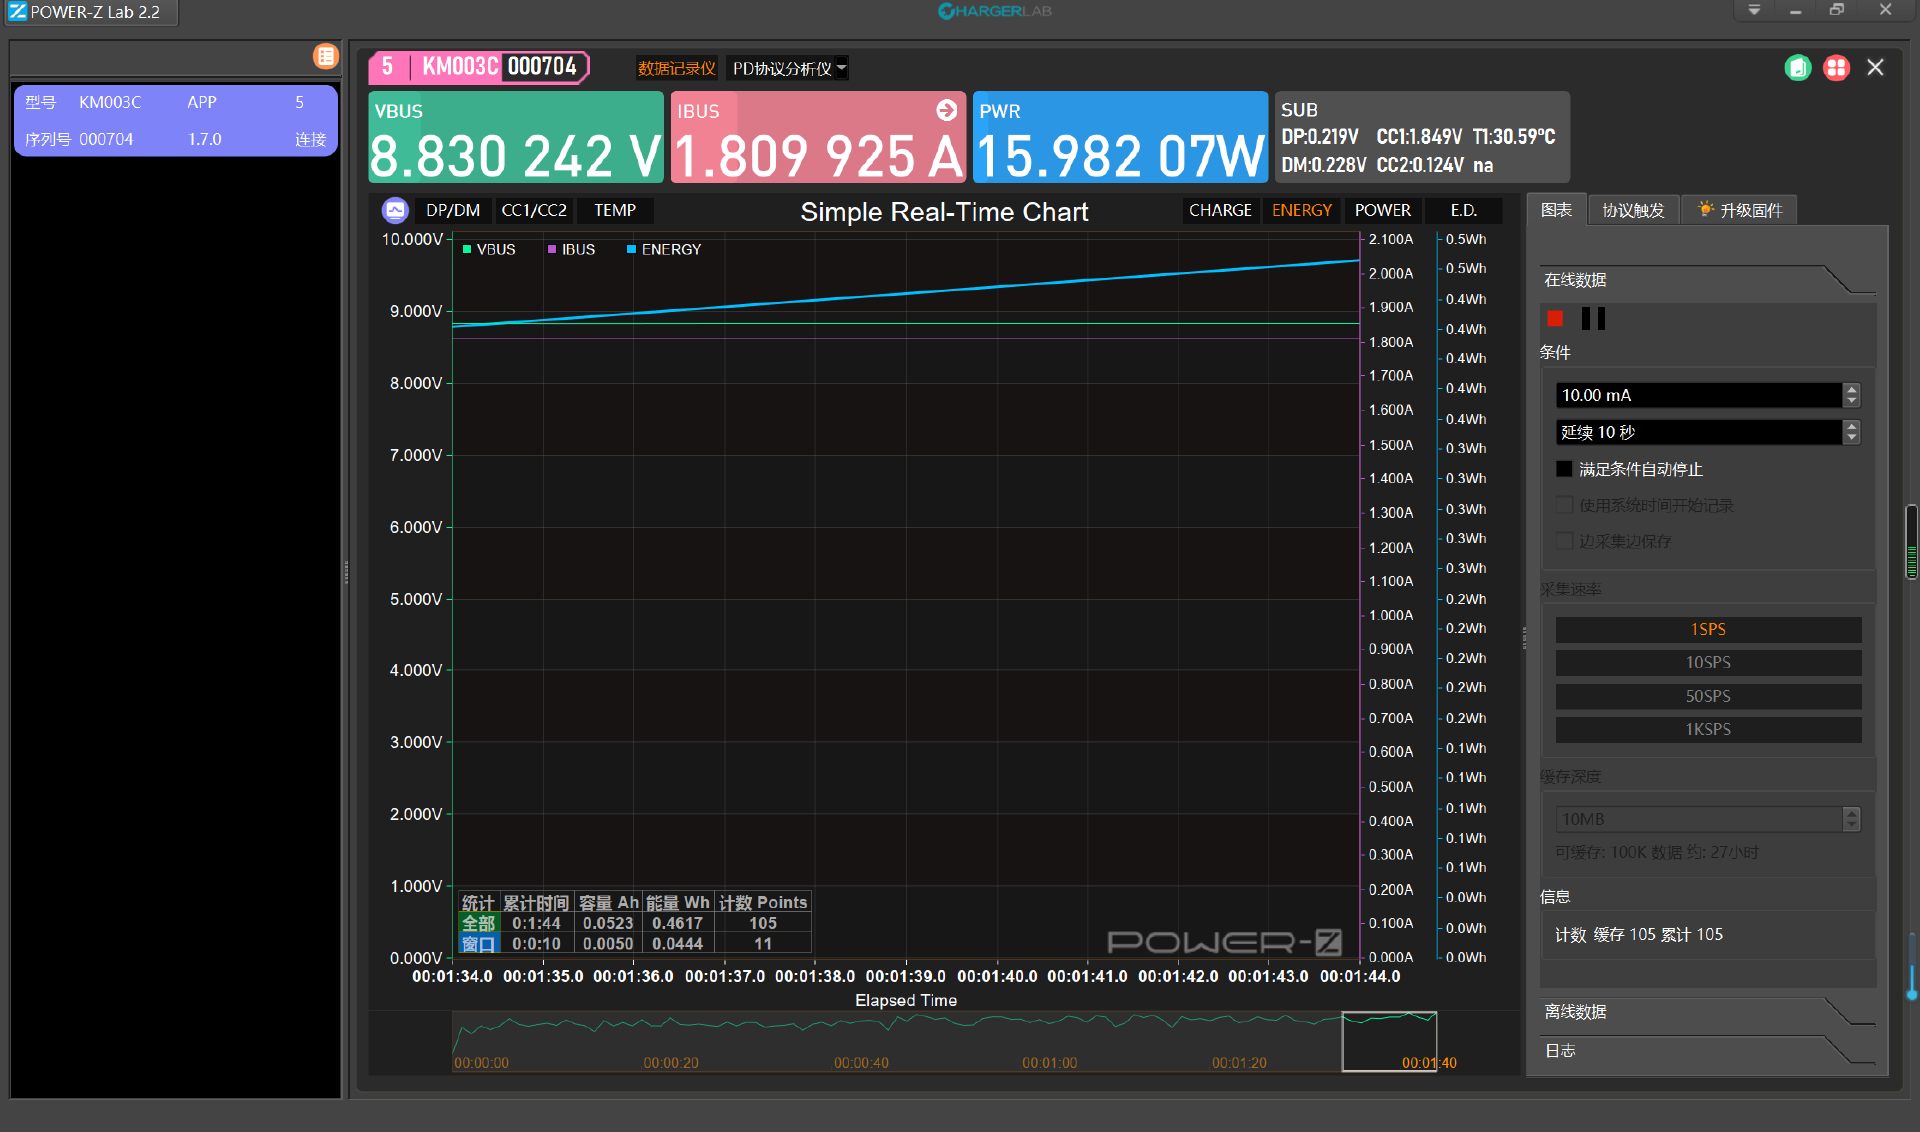
Click "ENERGY" at the same position, and you can also see the energy value charged by the device on the right side.
And the temperature information of the tester can be called out.
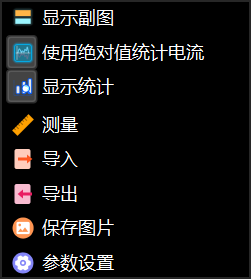
After recording, click the icon below the voltage value box (red box identification) to perform more operations.
The recorded data after the test can be saved in different forms, including various parameter settings.
Export to Excel
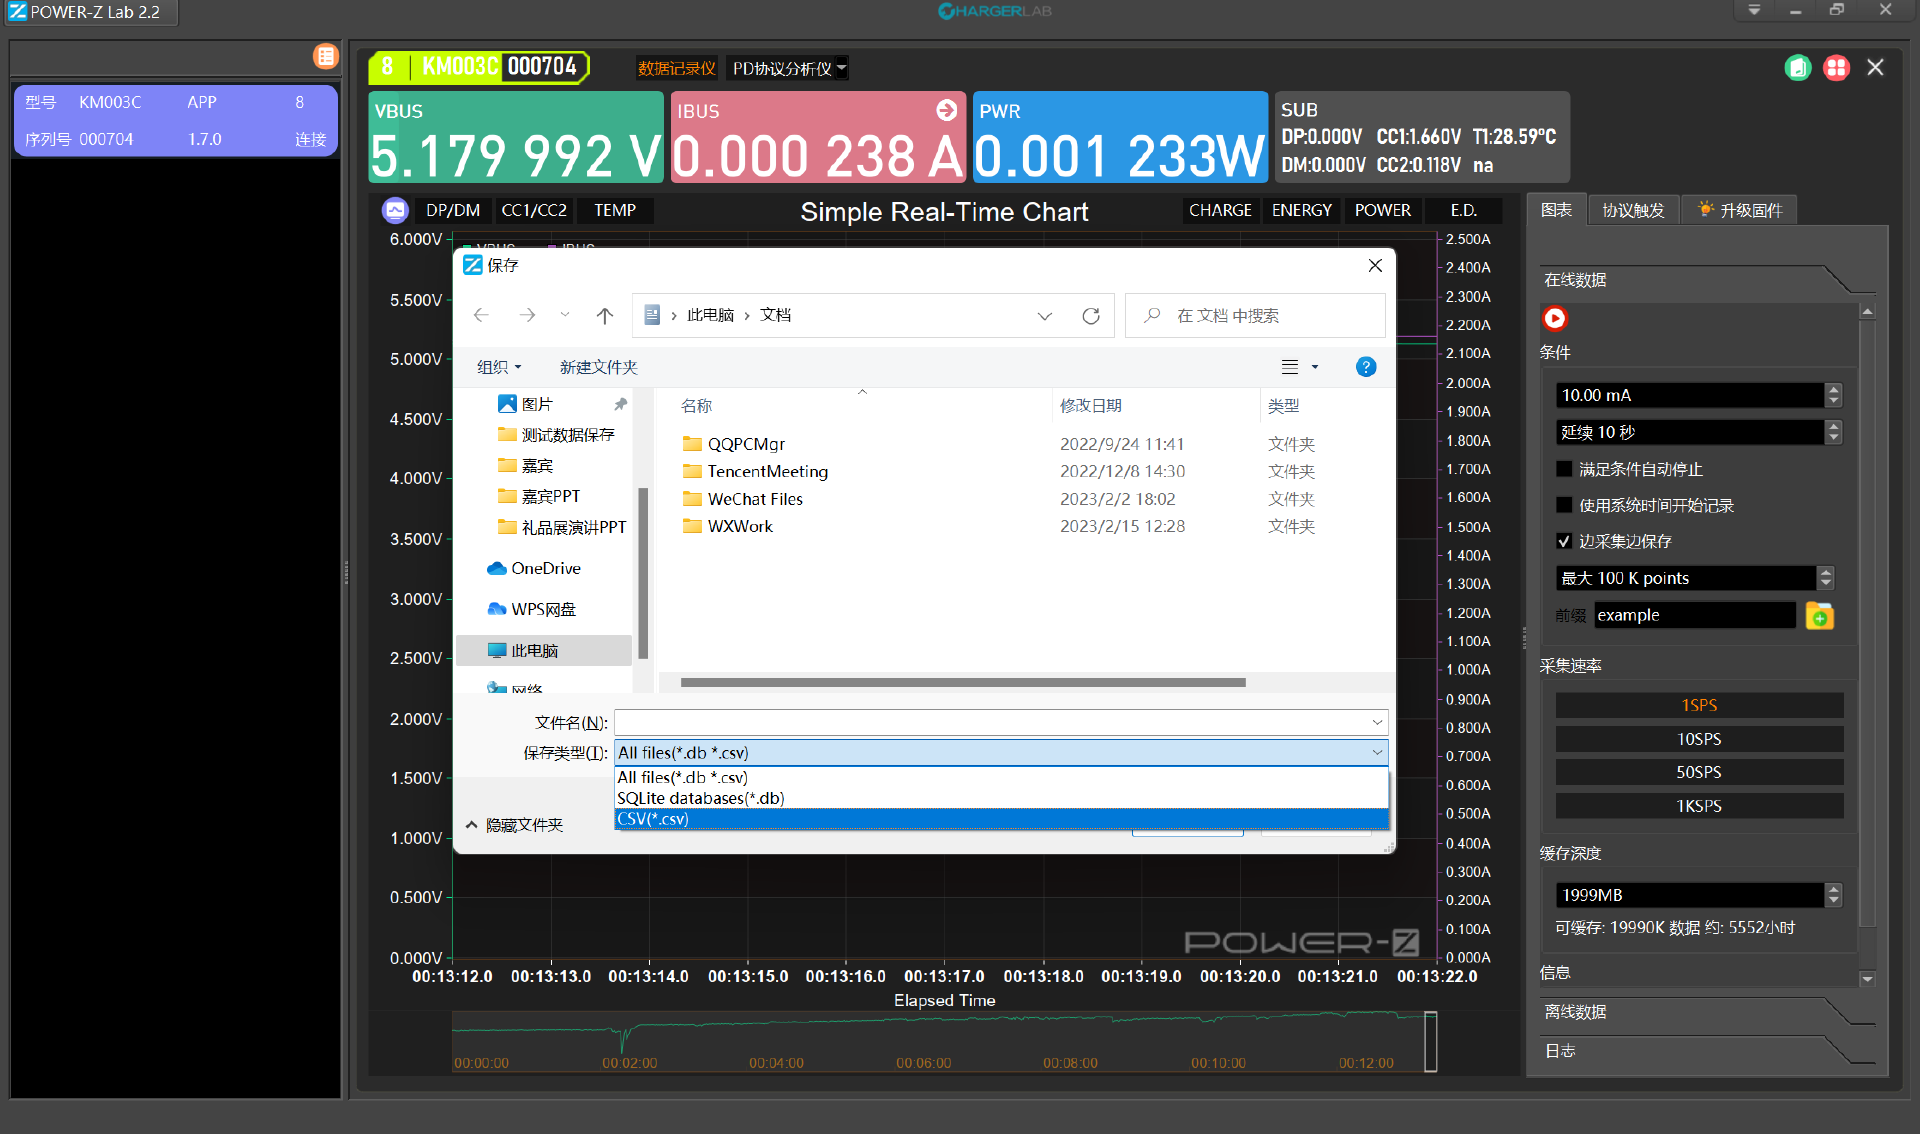
After clicking Export, the system will provide two file selection types, but most Excel table files are easy to decode and view.
As shown in the figure, you can select a file with SQLite suffix or a file with CSV format suffix in the save type. Select a file with CSV format first, and then click Save;But it should be noted that,In the computer of Windows system, please select a drive letter address other than the system disk (C disk), or it will not be saved.
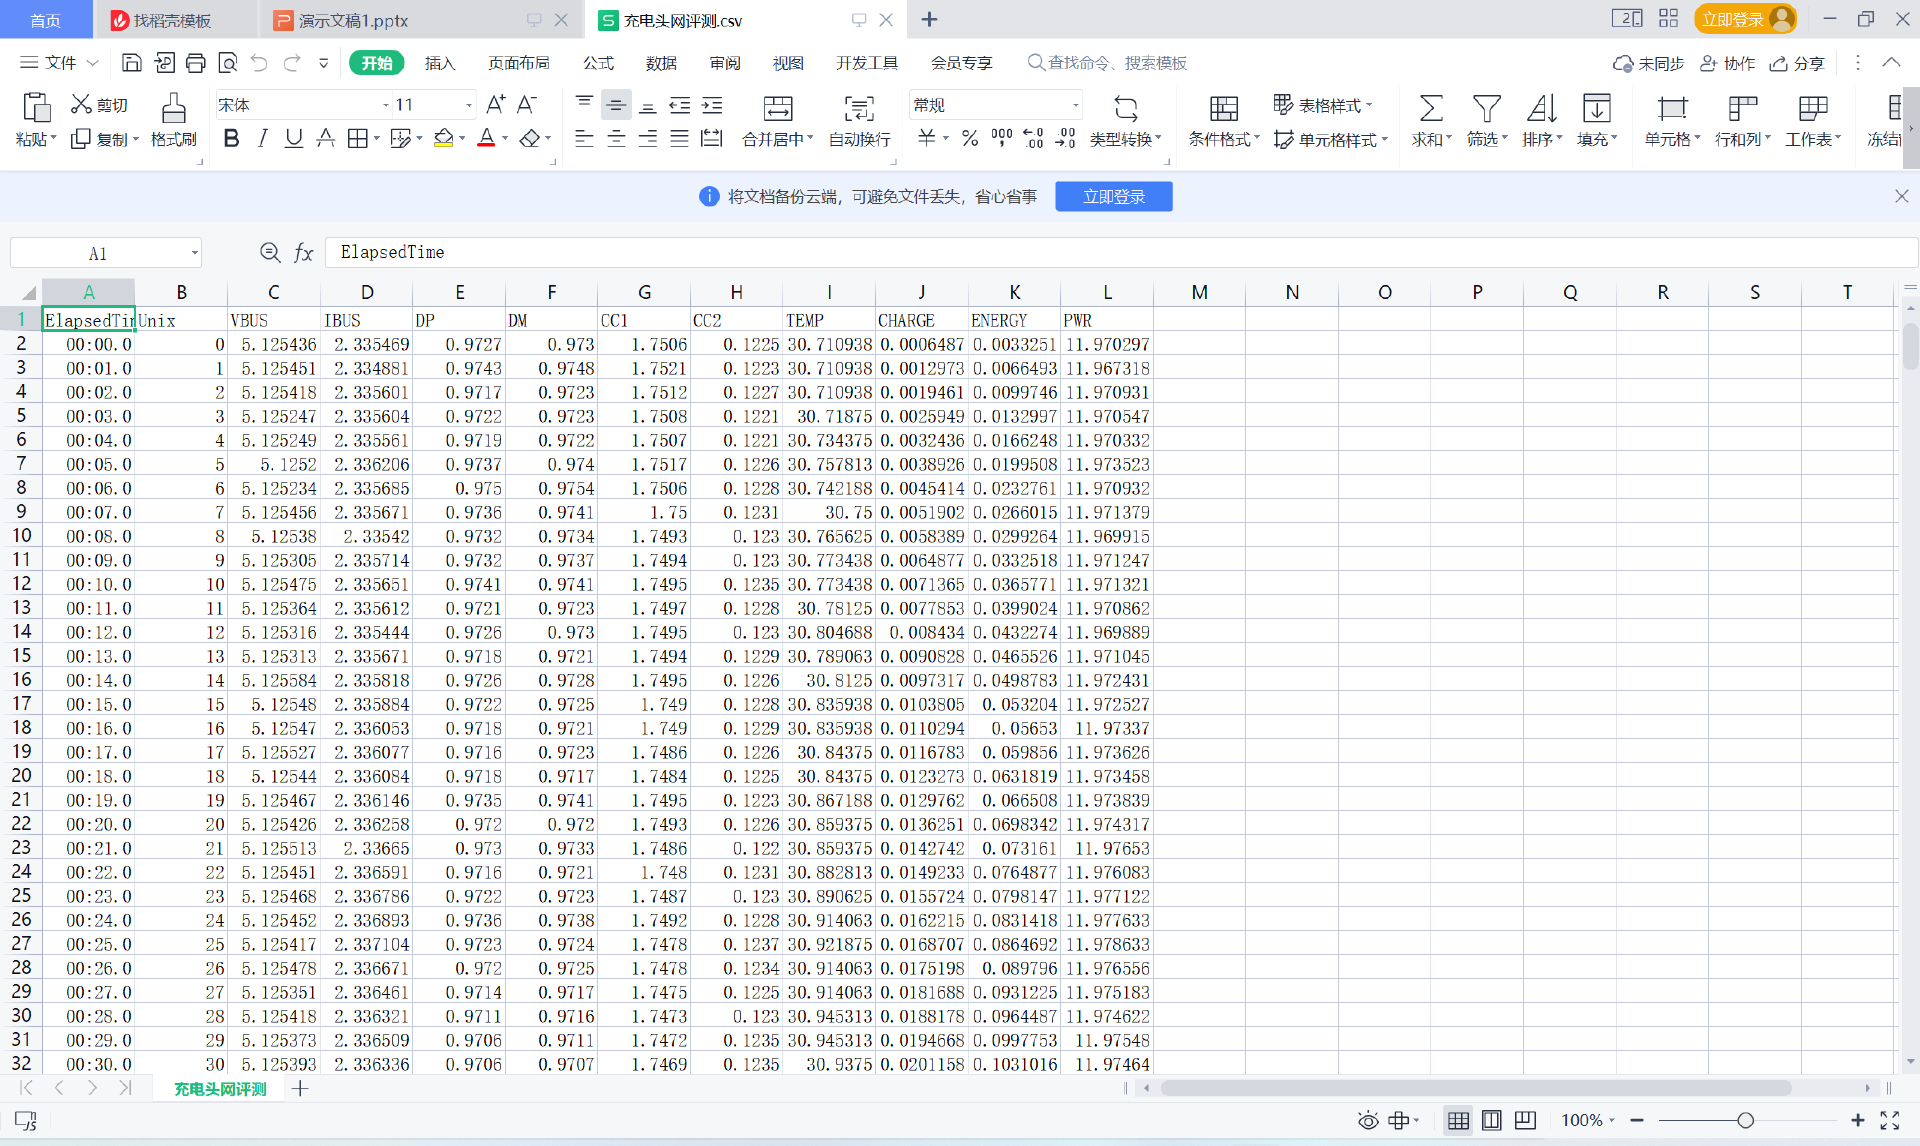
After opening the save path, you can see the successfully saved Excel file.
After opening the Excel table, you can view the specific charging data. With these source data, it is convenient to carry out subsequent work.
Summary of charging head network
For users who have mastered the recording steps on the POWER-Z KM002C tester of ChargeLAB, they must be familiar with the operating steps of the KM003C PD3.1 tester. There is no obvious difference in the operating interface and setting options between the two.
The user can adjust the frequency of data recording according to the equipment to be tested. For large capacity equipment such as outdoor power supply, the user can also place the test. After setting the threshold, there is no need to observe in real time. At the same time, invalid data can be avoided and the test efficiency can be improved.