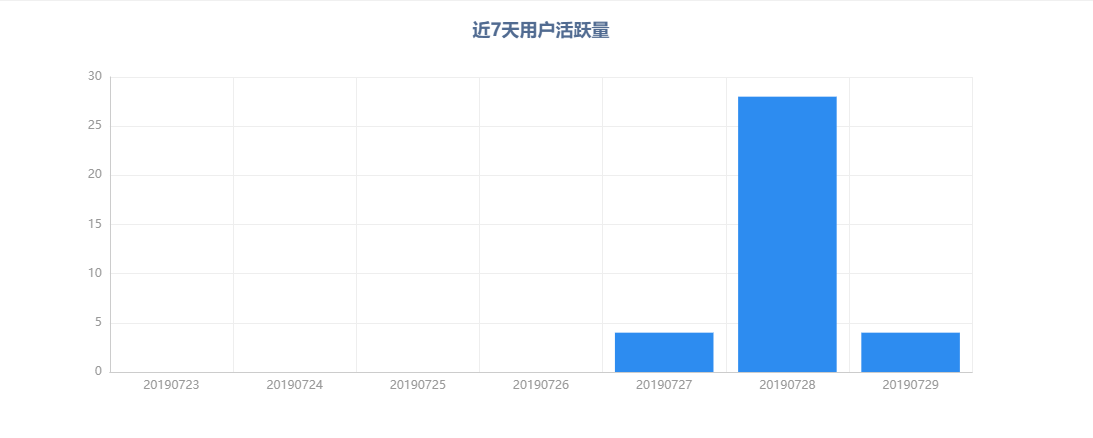
This problem was involved for 5 hours yesterday!!! The main reason is that I am not familiar with the front-end Vue, and I directly set the template. The data is transmitted, but the statistics function of the iview admin home page is in the form of components. I don't know how to render it. I got up today and worked on it for several hours. Finally, I found the problem. First, I put up the renderings~~

 IView admin cannot render drain pit using statistical chart data

Yesterday, I wrote the SQL for this statistical table.

 <script> import { ChartPie,  ChartBar } from '_c/charts' export default { name: 'home', components: { ChartPie, ChartBar, }, data () { return { barData: { } } }, mounted () { //Request data, and return successful copy to barData object ... this.barData=res.result; .... } } </script>

After this operation, I thought it was OK! But Echart also needs to monitor data changes in VUE, so it needs to operate on the sub component side, using iview admin

Bar.vue adds the method of monitoring data change:

 watch:{ 'value': function (newVal) { this.gengxinshuju(); } },

Gengxinshuju() is actually the default mounted method. Write it again~

 this.$nextTick(() => { let xAxisData = Object.keys(this.value) let seriesData = Object.values(this.value) let option = { title: { text: this.text, subtext: this.subtext, x: 'center' }, xAxis: { type: 'category', data: xAxisData }, yAxis: { type: 'value' }, series: [{ data: seriesData, type: 'bar' }] } this.dom = echarts.init(this.$ refs.dom, 'tdTheme') this.dom.setOption(option) on(window, 'resize', this.resize) })
Reference link:
https://www.jianshu.com/p/974297461e91
https://segmentfault.com/a/1190000012861862