


CPU load viewing method
-
Use vmstat to view the CPU load of the system latitude -
Use top to view the CPU load of the process latitude
Use vmstat to view the CPU load of the system latitude
Format: vmstat - n one
- n one Indicates that the result is refreshed once a second. Sample output: $ vmstat - n 1procs —————- memory ————— —- swap — ——- io —— - system — ——— cpu ——- r b swpd free buff cache si so bi bo in cs us sy id wa st zero zero zero seventy thousand three hundred and fifty-two one hundred and sixty-nine thousand four hundred and forty-eight four hundred and forty-eight thousand four hundred and fifty-two zero zero zero four ten eleven zero zero ninety-nine zero zero zero zero zero seventy thousand three hundred and seventy-six one hundred and sixty-nine thousand four hundred and forty-eight four hundred and forty-eight thousand four hundred and eighty-four zero zero zero zero one hundred and seventy-five four hundred and six zero zero one hundred zero zero zero zero zero seventy thousand three hundred and seventy-six one hundred and sixty-nine thousand four hundred and forty-eight four hundred and forty-eight thousand four hundred and eighty-four zero zero zero zero one hundred and seventy-three four hundred and fourteen zero one ninety-nine zero zero zero zero zero seventy thousand three hundred and seventy-six one hundred and sixty-nine thousand four hundred and forty-eight four hundred and forty-eight thousand four hundred and eighty-four zero zero zero one hundred and twenty-eight two hundred and twelve four hundred and twenty-nine three zero ninety-six one zero ^ C
-
r: Indicates the thread that the CPU in the system is waiting for processing. Since the CPU can only process one thread at a time, the higher the value, the slower the system usually runs. -
Us: The percentage of CPU time consumed by user mode. When the value is high, it indicates that the user process consumes more CPU time. For example, if the value exceeds 50% for a long time, the program algorithm or code needs to be optimized. -
Sy: The percentage of CPU time consumed by kernel mode. -
Wa: The percentage of CPU time consumed by IO waiting. When the value is high, it indicates that the IO wait is serious. This may be caused by a large number of random accesses to the disk, or the disk performance may be a bottleneck. -
Id: The percentage of CPU time in idle state. If the value continues to be 0 and sy is twice that of us, it usually indicates that the system is facing a shortage of CPU resources.
Use top to view the CPU load of the process latitude
Format: top Sample output: top - seventeen : twenty-seven : thirteen up twenty-seven days , three : thirteen , one user , load average : zero point zero two , zero point zero three , 0.05Tasks : ninety-four total , one running , ninety-three sleeping , zero stopped , zero zombie % Cpu ( s ): zero point three us , zero point one sy , zero ni , ninety-nine point five id , zero wa , zero hi , zero si , zero point one stKiB Mem : one million sixteen thousand six hundred and fifty-six total , nine hundred and forty-six thousand six hundred and twenty-eight used , seventy thousand and twenty-eight free , one hundred and sixty-nine thousand five hundred and thirty-six buffersKiB Swap : zero total , zero used , zero free . four hundred and forty-eight thousand six hundred and forty-four cached Mem PID USER PR NI VIRT RES SHR S % CPU % MEM TIME + COMMAND one root twenty zero forty-one thousand four hundred and twelve three thousand eight hundred and twenty-four two thousand three hundred and eight S zero zero point four zero : nineteen point zero one systemd two root twenty zero zero zero zero S zero zero zero : zero point zero four kthreadd
Operation case
Use top to directly terminate processes with high CPU consumption
-
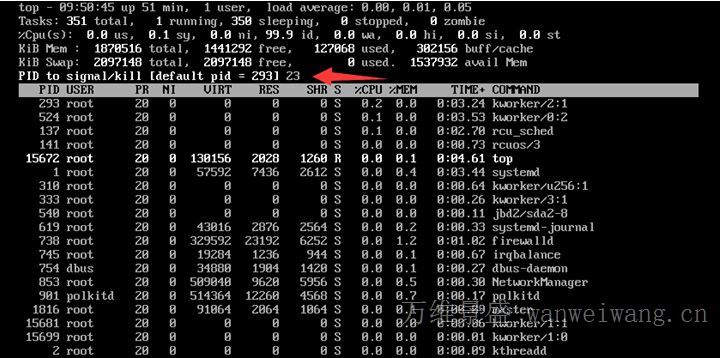
To terminate a process, just press the lowercase k key. -
Enter the PID of the process you want to terminate (the first column of top output results). For example, as shown in the figure below, if you want to terminate the process with PID 23, enter 23 and press Enter.
-
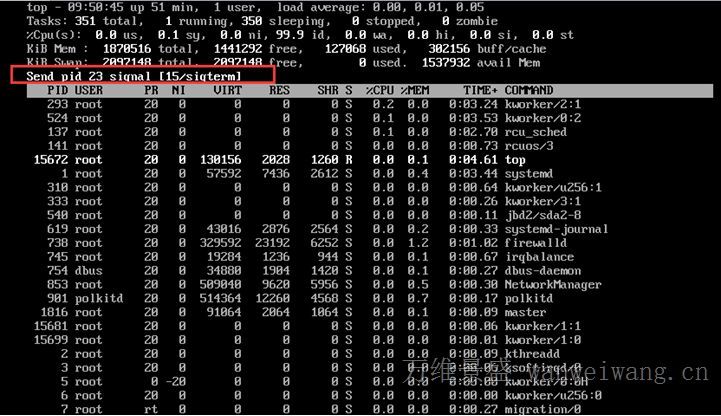
As shown in the figure below, after the operation is successful, a prompt message similar to "Send pid 23 signal [15/symbol]" will appear on the interface for the user to confirm. Press Enter to confirm.
Low CPU usage but high load
-
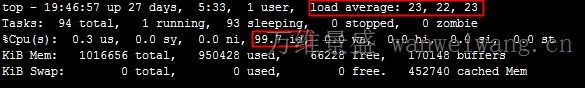
Problem description:
There is no business program running in the Linux system. Through top observation, as shown in the figure below, the CPU is idle, but the load average is very high:
-
Treatment:
Load average is an evaluation of CPU load. The higher the value, the longer the task queue, and the more tasks waiting to be executed.
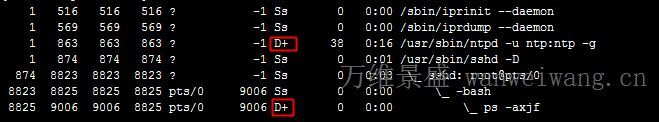
When this happens, it may be caused by a rigid process. Can be commanded ps -axjf Check whether the D status process exists.
D state refers to the uninterruptible sleep state. A process in this state cannot be killed or exited by itself. It can only be solved by restoring the resources it depends on or restarting the system.
The kswapd0 process occupies a high CPU
-
Problem description:
The kswapd0 process consumes a lot of CPU resources of the system. -
Treatment:
Linux system uses paging mechanism to manage memory, and at the same time, part of the disk is marked out as virtual memory. And kswapd0 is the process responsible for page changing in the virtual memory management of Linux system. When the system memory is insufficient, kswapd0 will frequently perform page changing operations. Because the paging operation consumes CPU resources very much, it will cause the process to continue to consume high CPU resources.
If top and other monitors find that the kswapd0 process is continuously in a non sleep state, runs for a long time, and continues to use high CPU resources, it is usually because the system is constantly performing page changing operations. Then you can further query the memory occupation of the system and the processes in the system through free, ps and other instructions for further troubleshooting and analysis.

