In Go language, it supports writing unit test code for function modules, and continues to useThe first tutorialFor example, in thesimplemathIn the package, we can write corresponding unit test code for each calculation module.
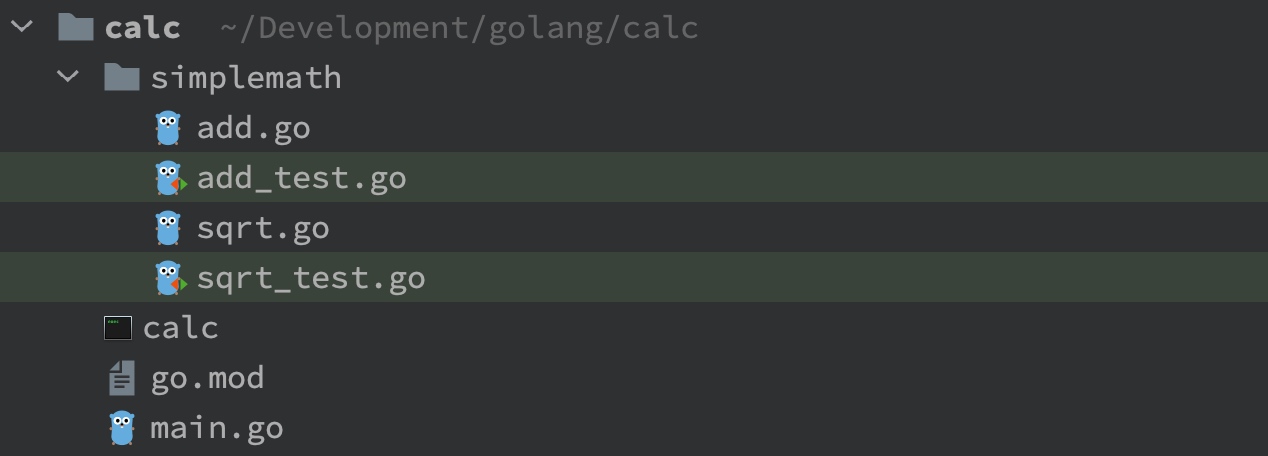
Unit test files are suffixed by the file name in the same directory by default_testAs a sign, for example, wesimplemathNew under directoryadd_test.goandsqrt_test.goFiles, respectivelyadd.goandsqrt.goWrite unit tests. The corresponding directory structure is as follows:
When writing unit tests, you need to introducetestingPackage. You can compare it to PHP unit in PHP or JUnit in Java. We can implement automated testing based on the methods provided by the package. The format of the test method is as follows:
func TestXXX(t *testing.T) {//Test logic}
Run unit tests
Next, how to run these unit tests?This is also very simple.
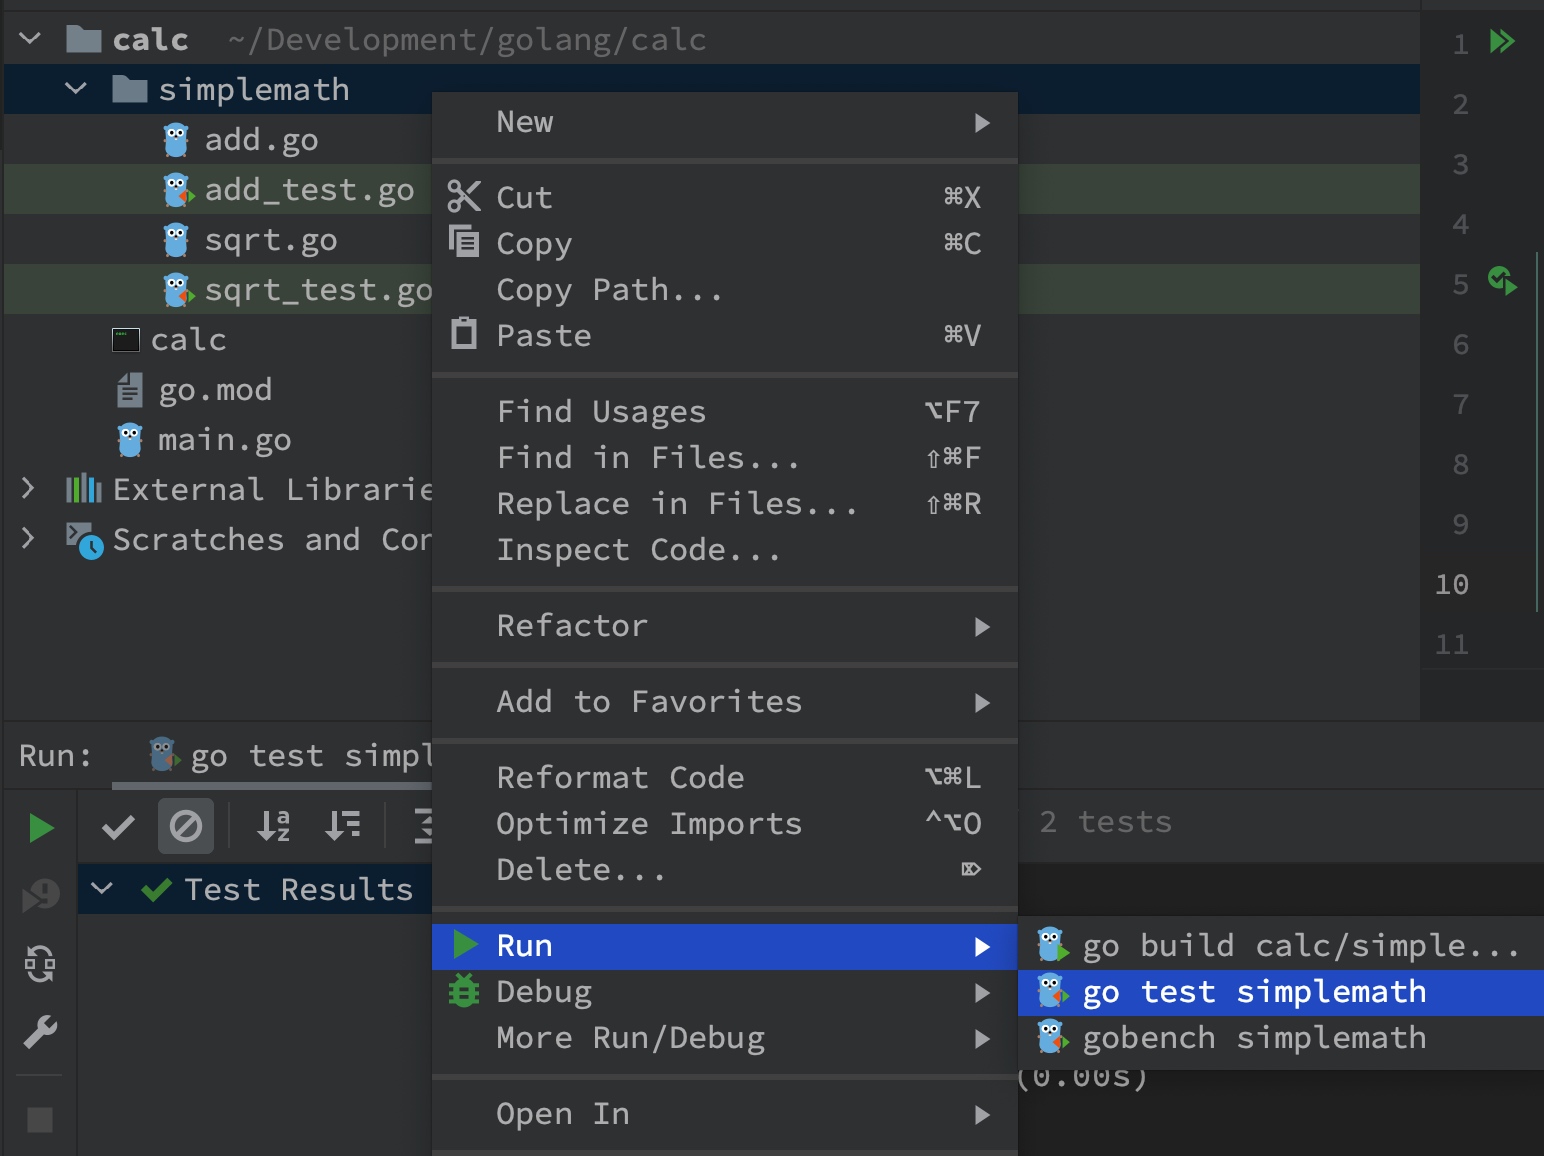
In GoLand, you can select the package to execute unit tests, such assimplemath, and then select Run ->go test simplicity through the right-click shortcut menu:
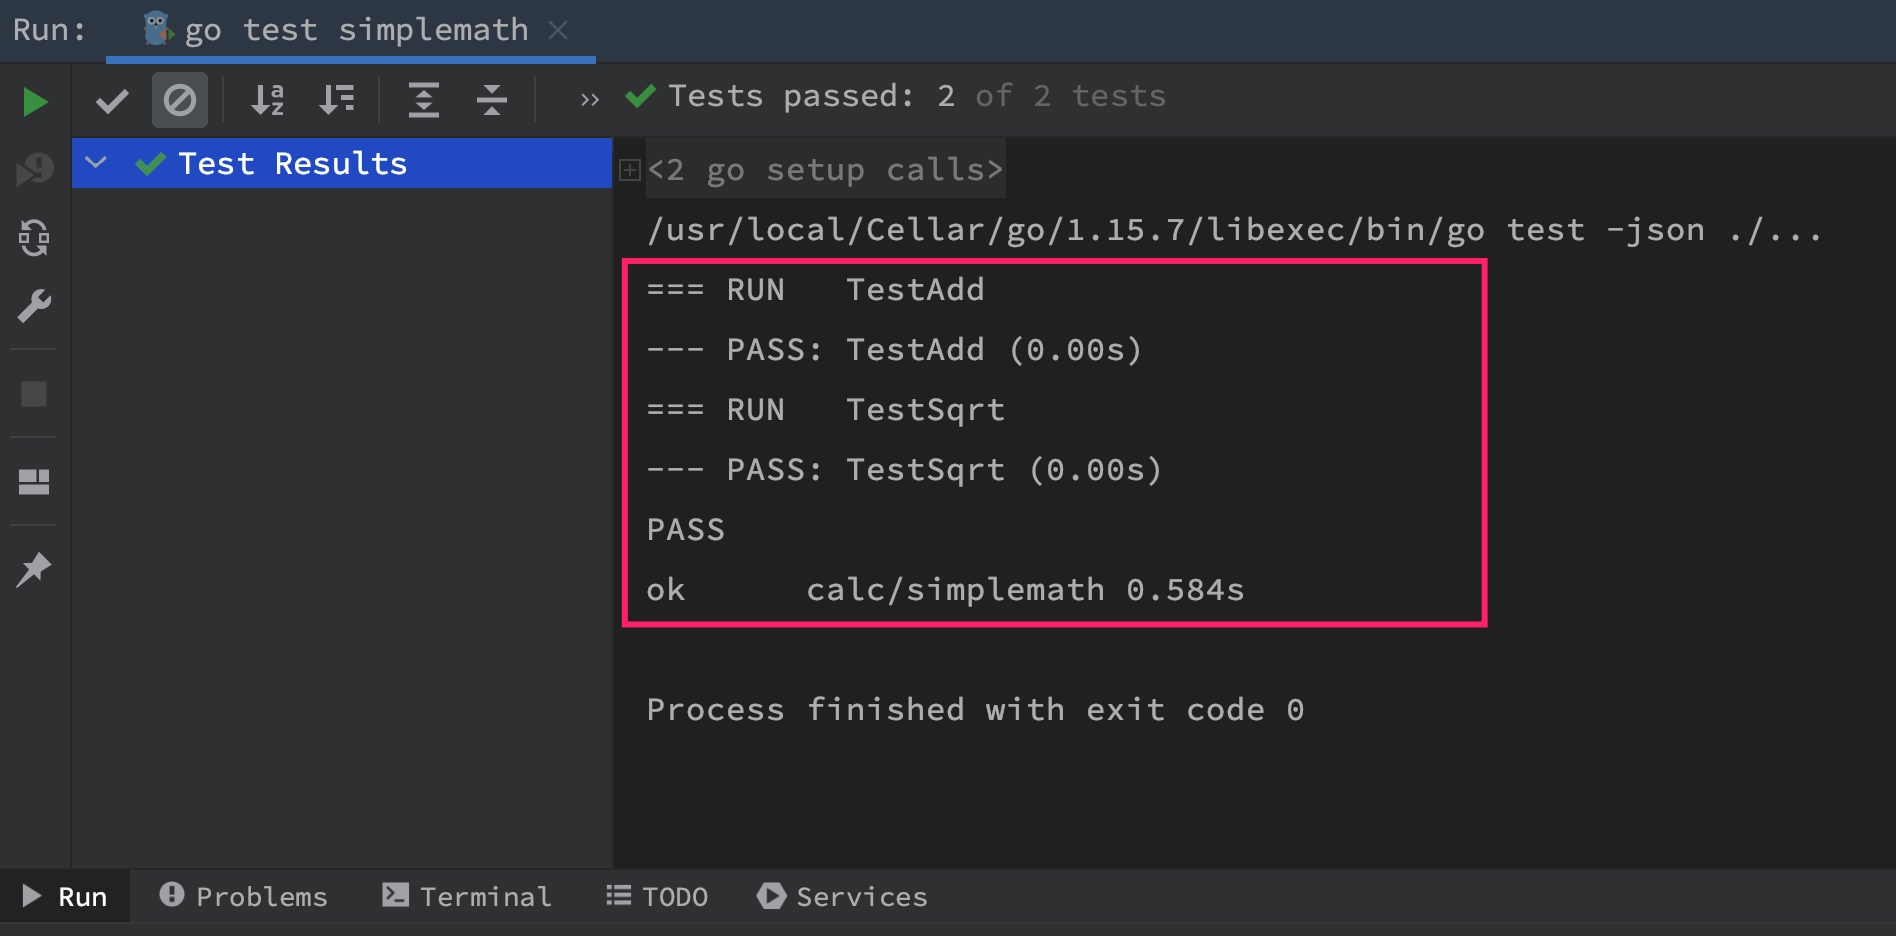
You can see the test run results in the Run window at the bottom of GoLand:
As you can see, the running results list the test content, test results and test time.If I deliberatelyadd_test.goThe error scenario is changed to:
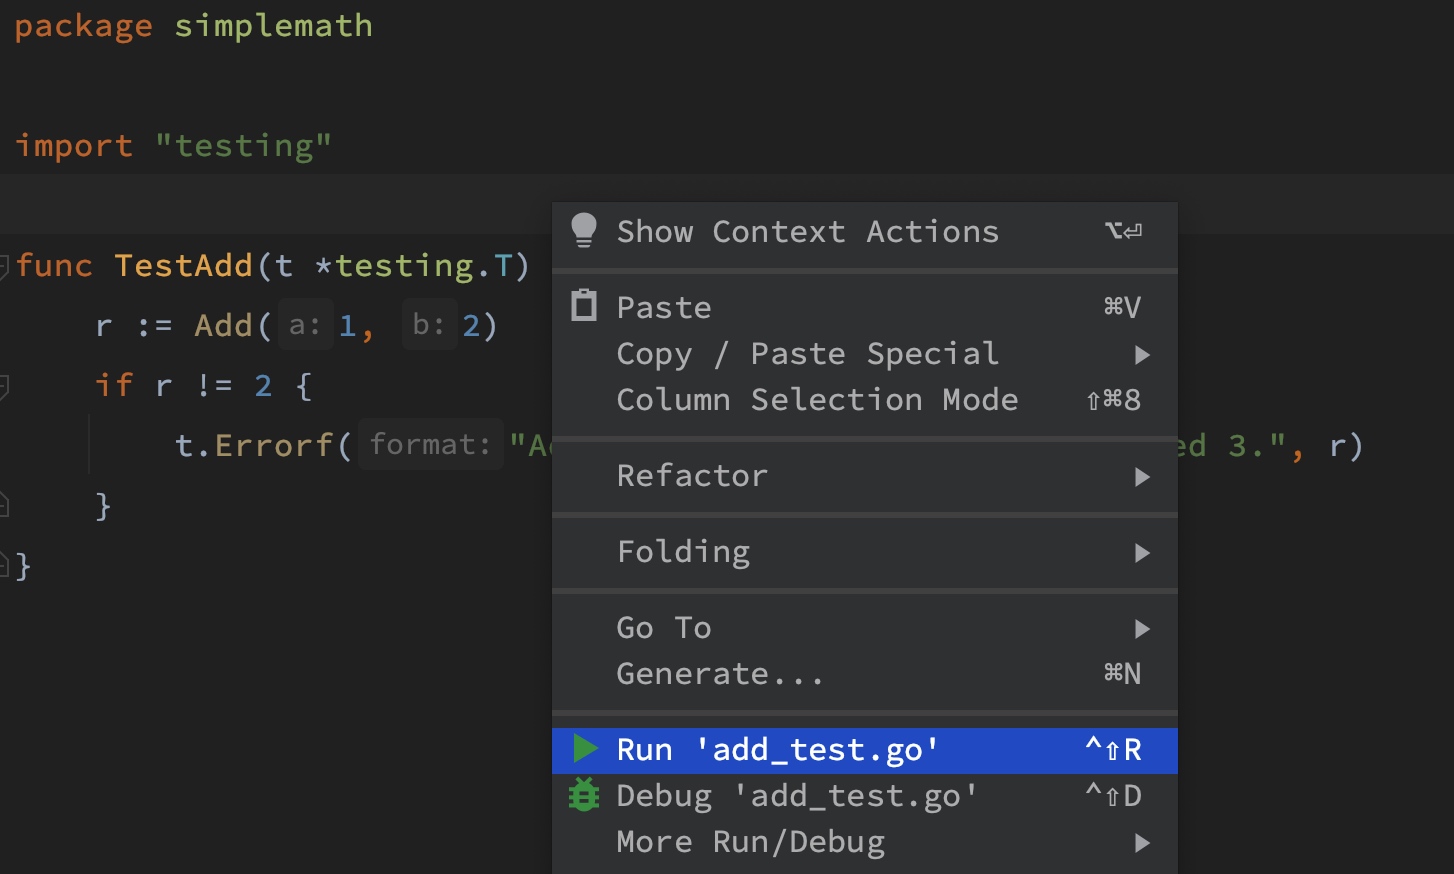
Then we execute the unit test again. This time, we can directly selectadd_test.goExecute the unit test in the openedadd_test.goIn the file code editing area, right-click the shortcut menu and select Run 'add_test. go'
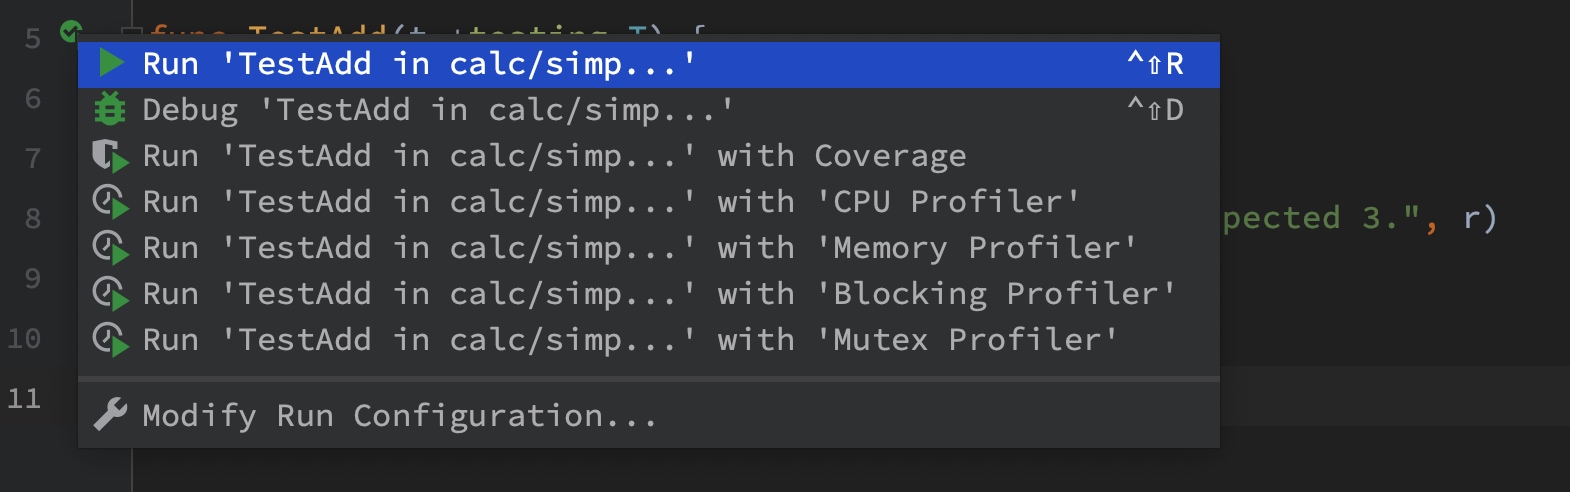
Of course, you can specifically test a method by clicking the small green test icon that GoLand renders for the test method on the right of the line number, and selecting Run 'TestAdd in calc/simplepath':
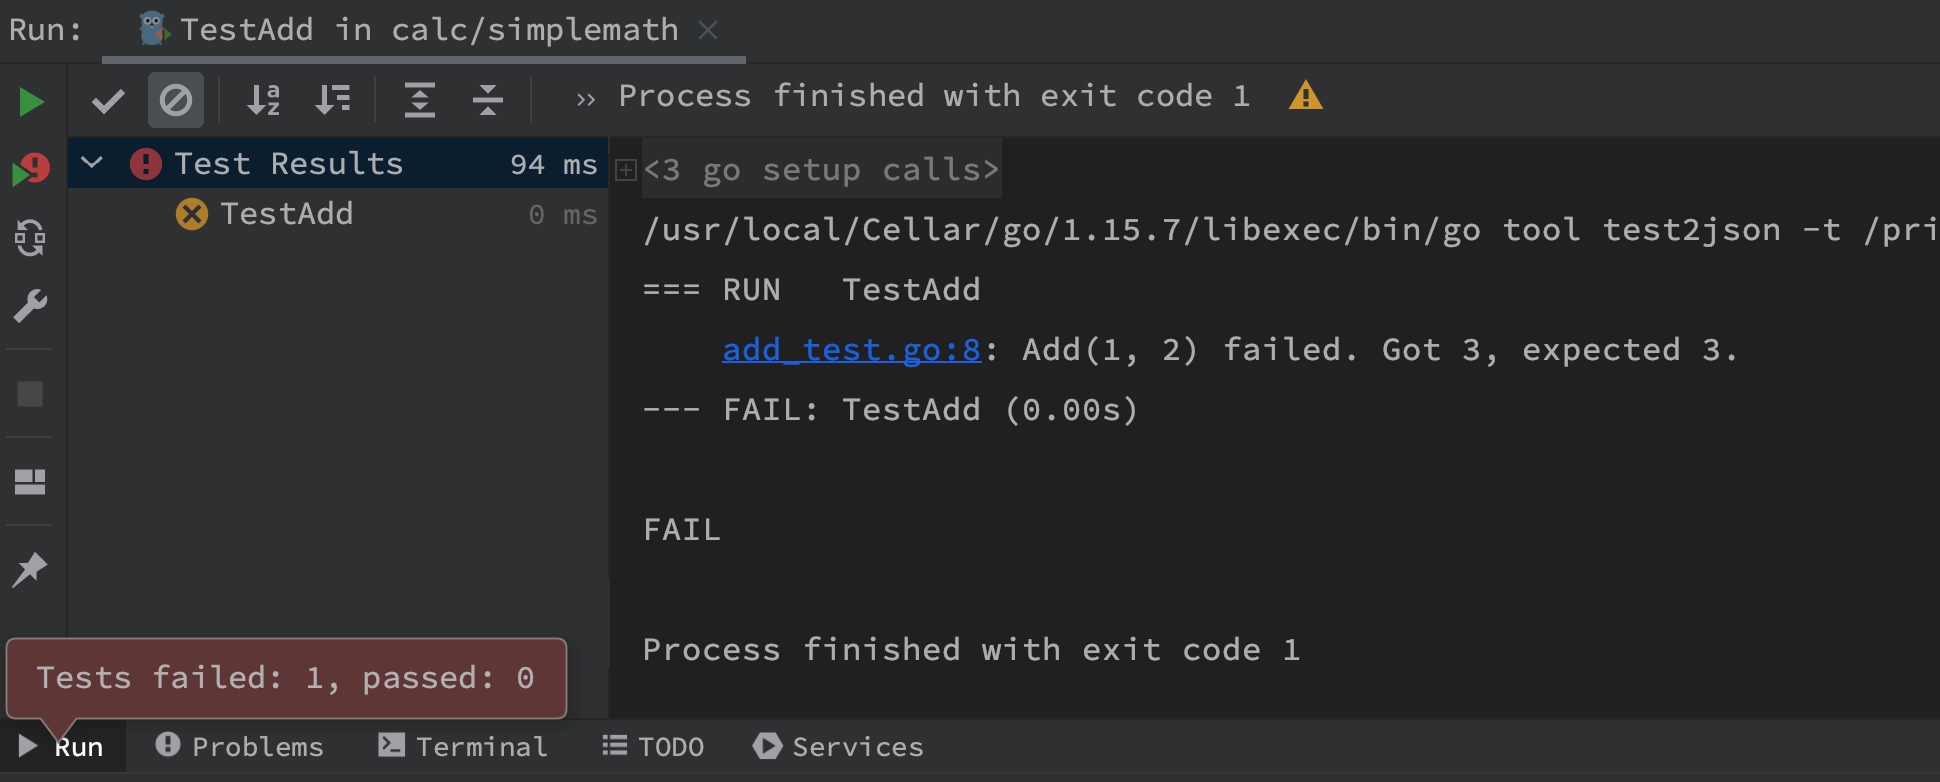
No matter how the test is run, the following test failure results will be obtained in the end:
The printed error message is very concise, but it is enough for developers to quickly locate the file and line number of the problem code, so as to confirm whether it is a unit test problem or a program problem in the shortest time.
Problem location and debugging
Print Variables
Of course, for some simple tests, you can also locate problems by printing variables. Usually, we do this in PHP, for example, byvar_dump、printf、echoSuch statements or functions can also print the returned results throughddordumpMethod to perform simple and efficient variable printing debugging. In the Go language, the corresponding printing function is introduced previouslyPrintforPrintlnMethod, used to format the output of variables (analogous to theprintfFunctions andprintFunction. PHP does not provide similar functionsPrintlnThis method, but you can add\nTo implement line break), both methods are located infmtIn the format package, we can print variables as follows:
fval := 110.48 ival := 200 sval := "This is a string. " fmt.Println("The value of fval is", fval) fmt.Printf("fval=%f, ival=%d, sval=%s\n", fval, ival, sval) fmt.Printf("fval=%v, ival=%v, sval=%v\n", fval, ival, sval)
The corresponding output result is:
The value of fval is 110.48fval=110.480000, ival=200, sval=This is a string. fval=110.48, ival=200, sval=This is a string.
Output Log
If the code is executed in the online production environment, printing variables is not suitable for locating problems. At this time, we can uselogThe method provided by the package is to print key information or error information logs to facilitate tracking online problems. We will introduce the log function in detail later in the advanced version of engineering management, so you can understand it here first.
IDE debugging
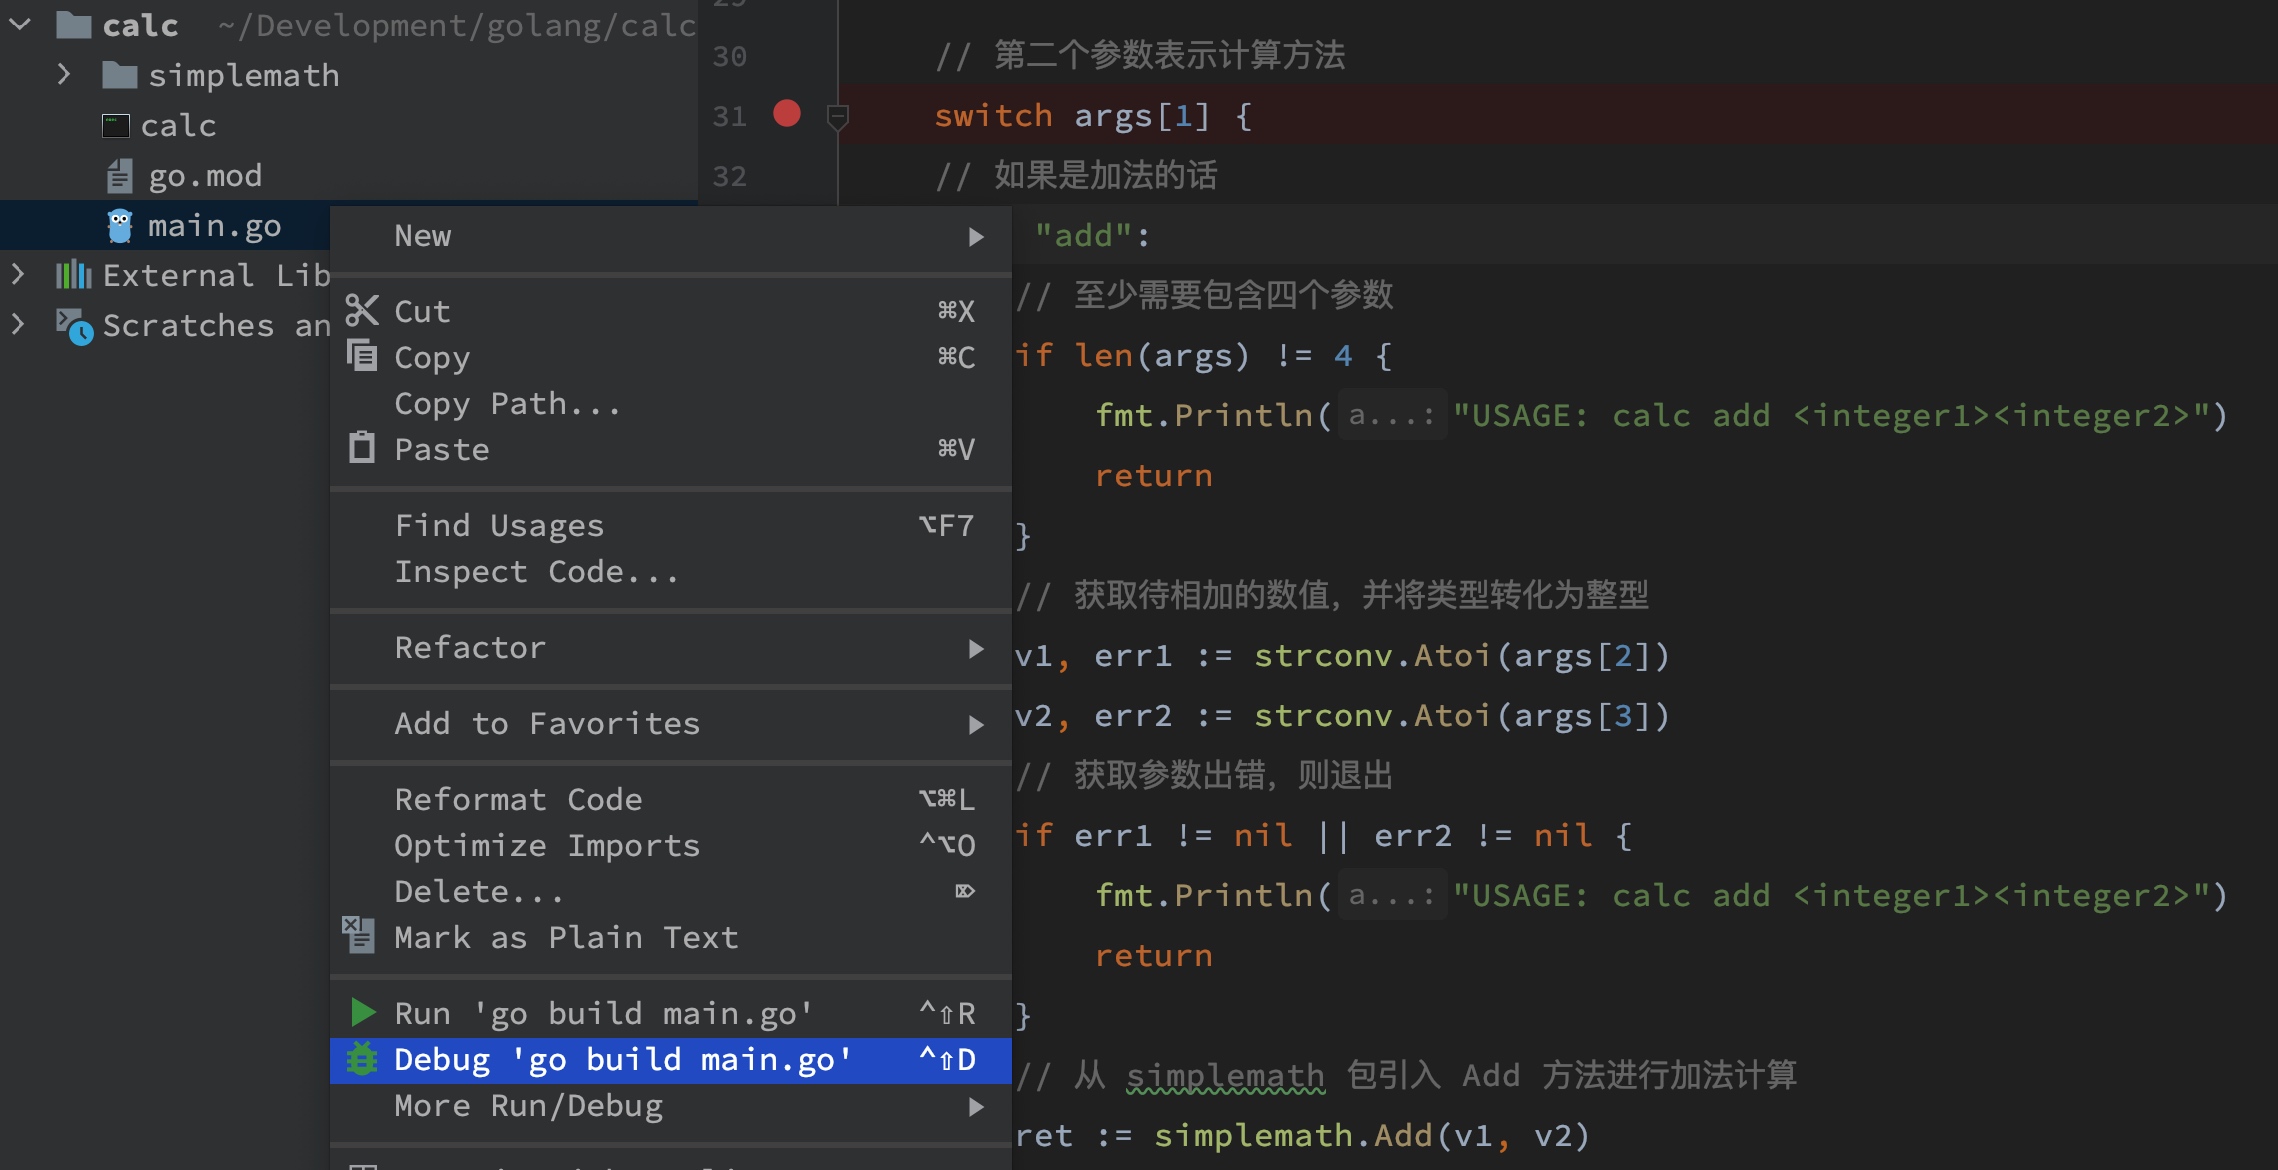
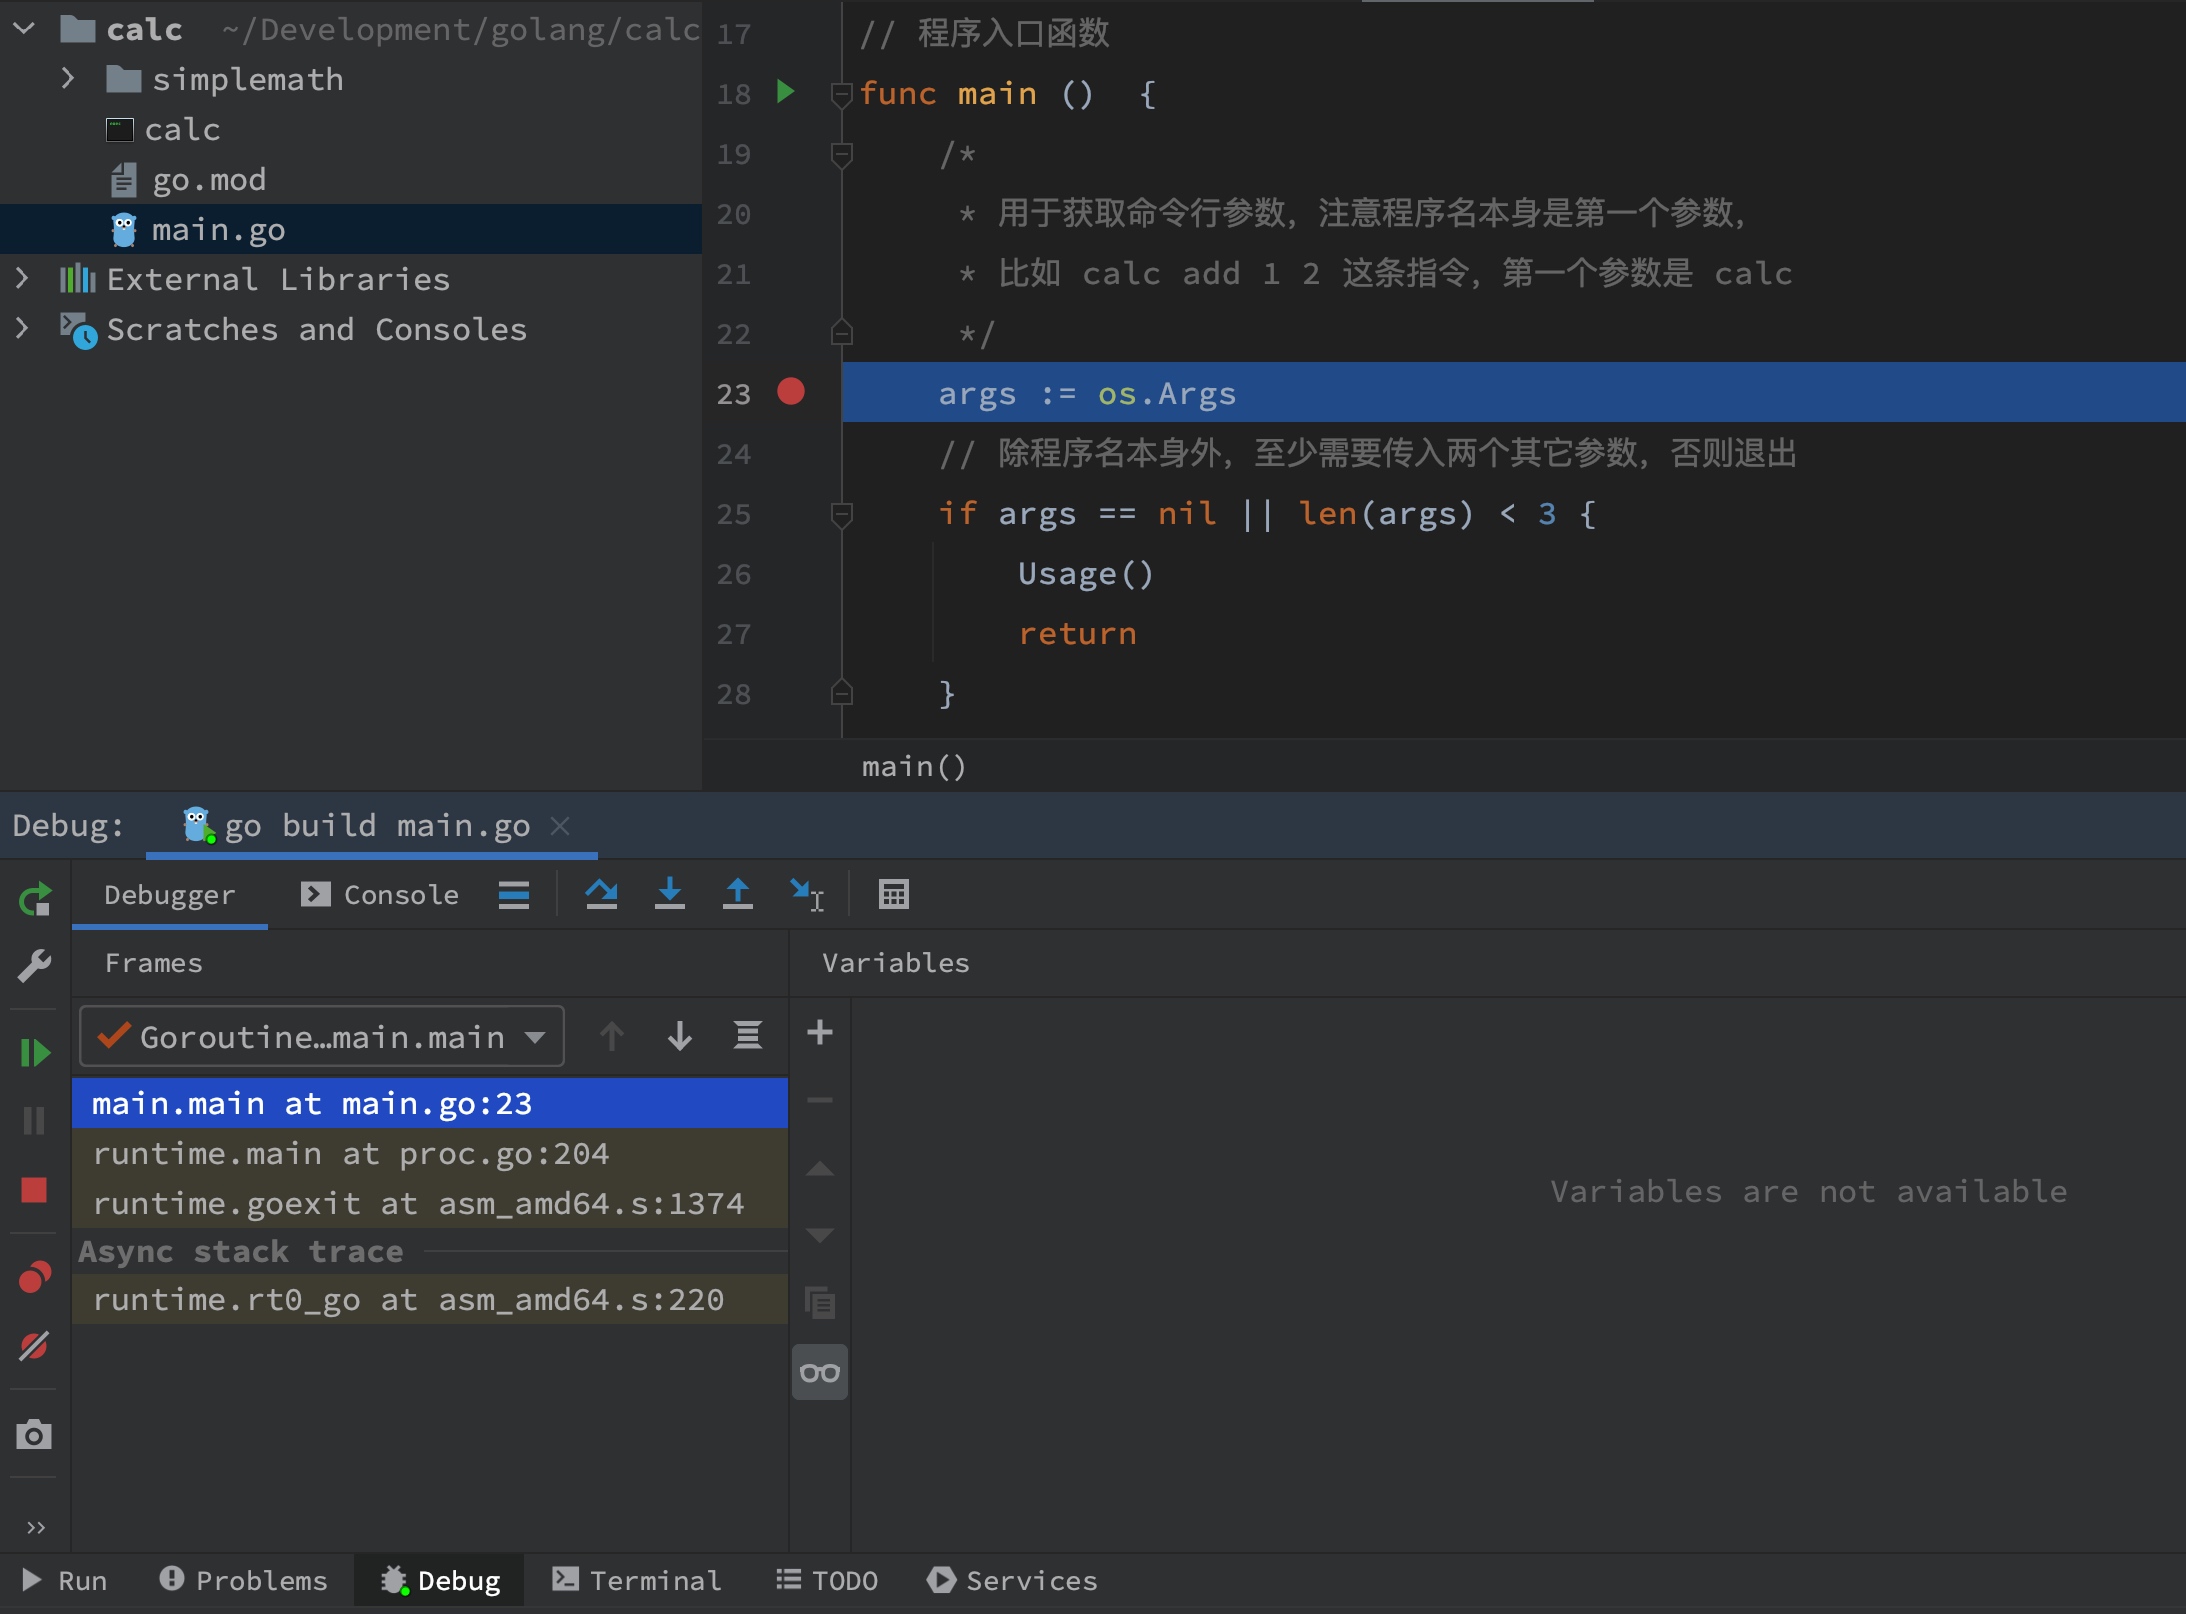
If you are developing through GoLand, set breakpoints directly in the code (click the corresponding code line), select the source code file to debug, and click the option corresponding to Debug in the right-click drop-down menu to start breakpoint debugging of the specified file code:
After entering debug mode, the code execution process will pause at the breakpoint.In the Debug window of the console below the GoLand interface, you can see the stack information of the current program. You can debug the code through manual control (jump in, jump out, enter the next line, terminate debugging, etc.). The specific operation mode andPhpStormItelliJ IDEA:
It is enough to use the code debugging function provided by GoLand for daily development. If you want to debug the code in a more hacker way, you can choose GDB.
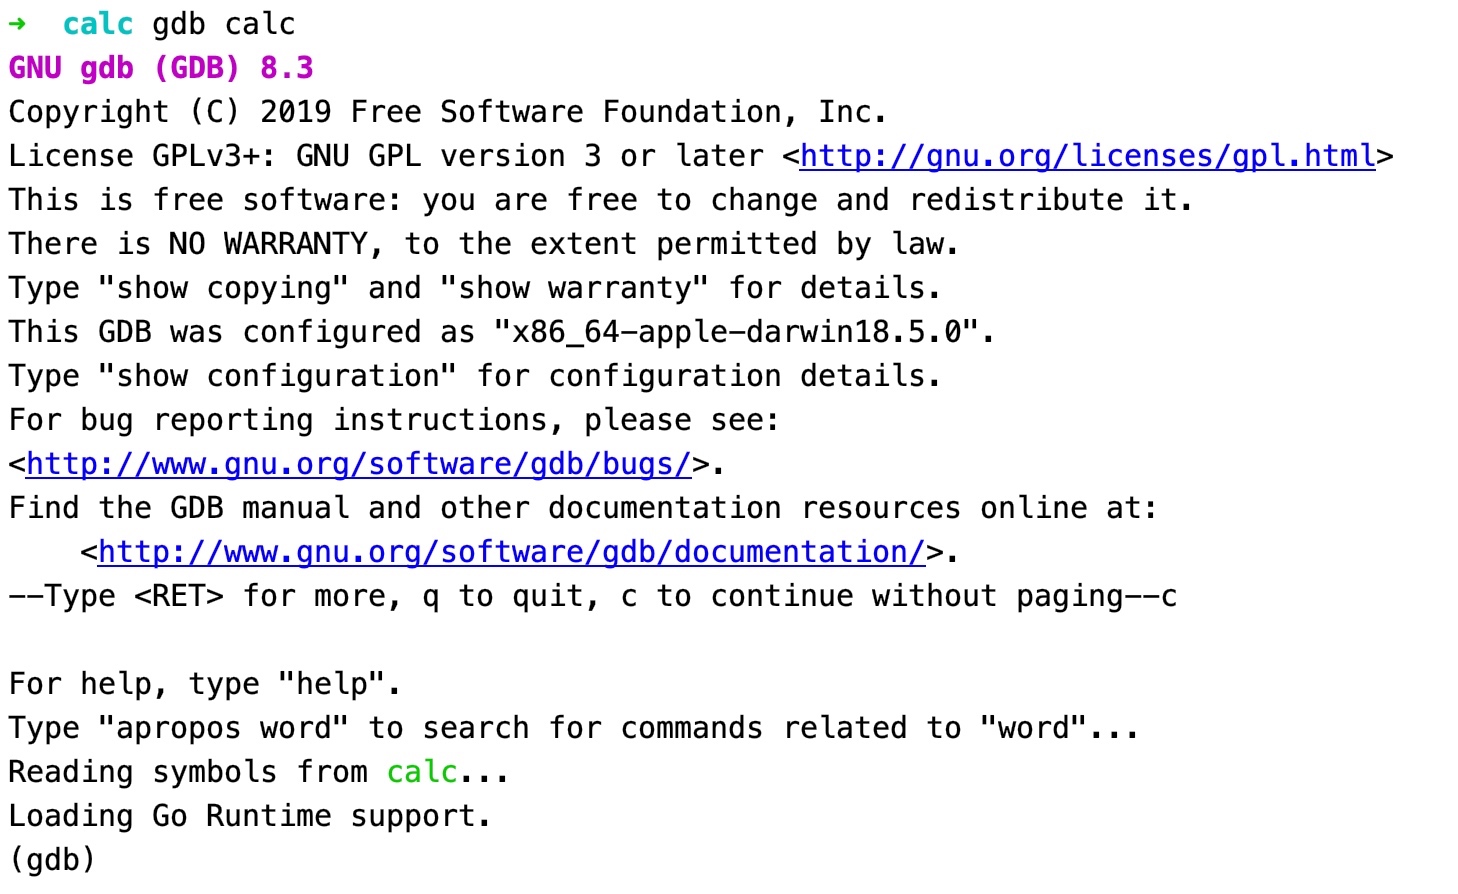
GDBIt is a powerful command line based program debugging tool under Unix/Linux operating system released by GNU Open Source Organization. Binary files compiled with Go language support debugging through GDB, such as the previous tutorial throughgo build calcCompiled executable filecalc, you can directly run in debug mode with the following commands:
gdb calc
Note: Windows system does not support this tool, Mac can usebrew install gdbCommand installation.
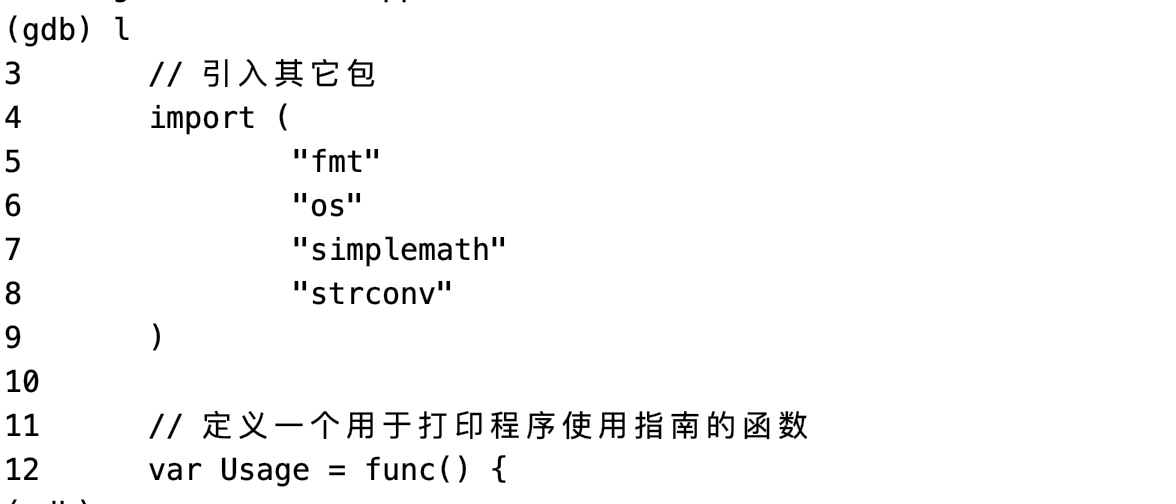
Then, you can debug the Go code in the command line way through the instructions supported by GDBlCommand View Code:
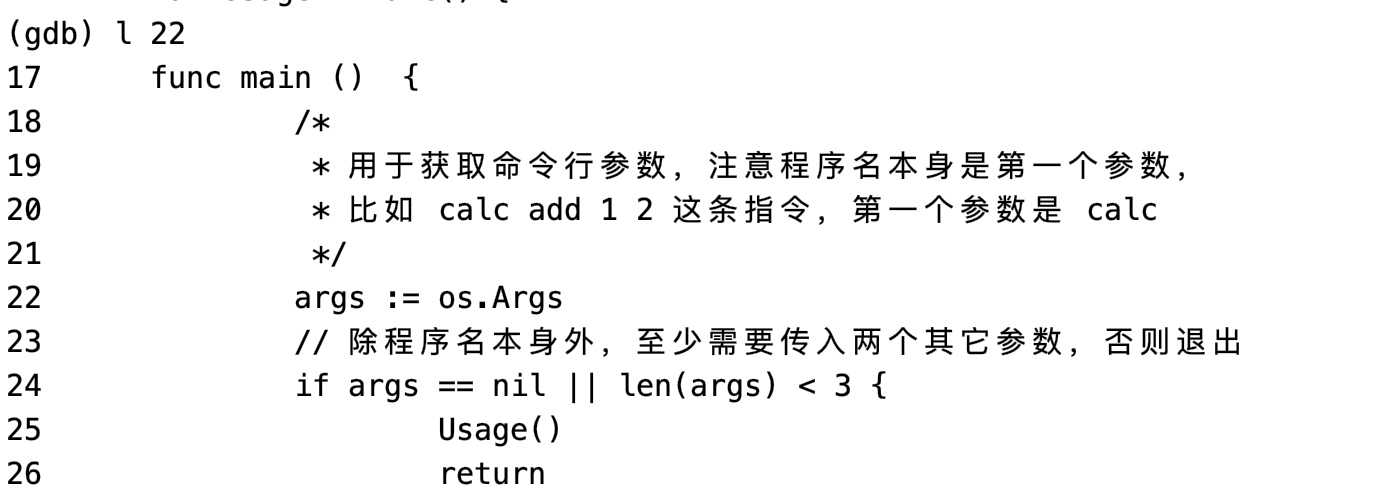
To jump to a line to view the passedl <line>Number of incoming lines:
To set a breakpoint for a line, you can use theb <line>To achieve:
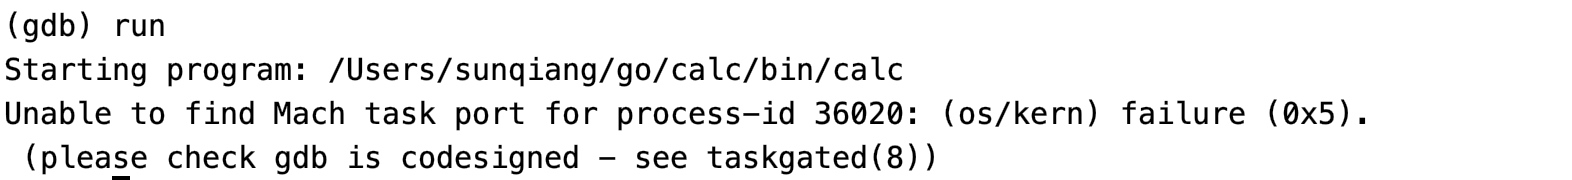
Then throughrunCommand to run the program. If it is on a Mac system, the following error may be reported:
This is because the Darwin kernel does not allow you to debug other processes without special permission.Debugging a process means that you have full control over the process, so it is prohibited by default to prevent malicious use.allowgdbThe best way to control other processes is to sign them with a certificate trusted by the system. For the corresponding solution, see here:https://opensource.apple.com/source/lldb/lldb-69/docs/code-signing.txt(Solutions corresponding to Chinese)。
Enter the next line and usenCommand, print variable can be usedp <var>The instruction passes in the variable name...I won't go further with more instructions, because for beginners, GDB is not recommended for code debugging. It's more friendly to use GoLand directly, isn't it?If you want to explore more uses of GDB debugging, please seeCorresponding official documents。
Summary
So far, the three steps of zero foundation introduction to Go language have been completed, which are the first Go program, simple project management, unit testing and code debugging. From the next chapter, we will formally introduce the language features, object-oriented programming, concurrent programming, network programming and other advanced use guides of Go languageWeChat official accountFollow the update of this series of tutorials. If you have any questions during the learning process, you can use the comments below the tutorials or add "Go Language Seminar"Discuss with Xuejun.