What is GSEA? Baidu is responsible for this. You should know what GSEA is before using it
Tools download link: http://gap.shengxin.ren/tool/4/
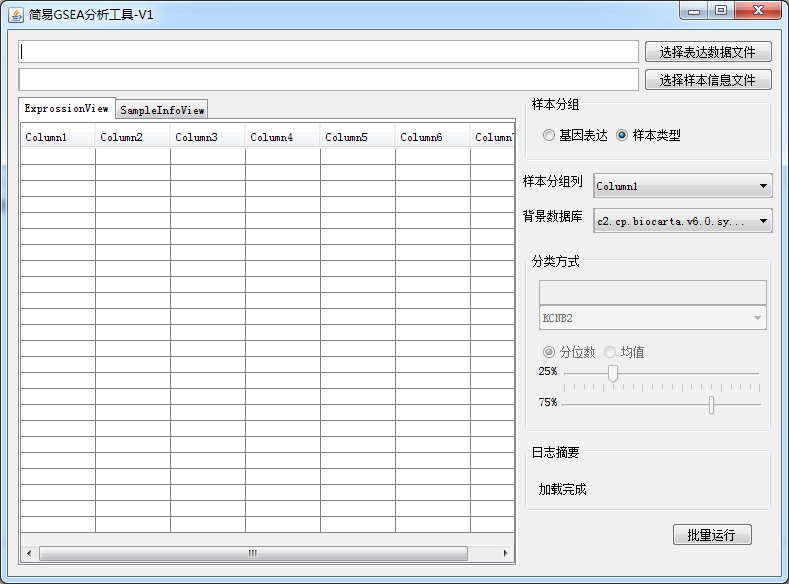
Then upload the tool screenshot:
 Generally, we need to prepare three documents for GSEA
1. Expression spectrum of gct format
2. Group Files
3. Enriched background files, i.e. files in gmt format
With these three files, GSEA enrichment analysis can be done
However, this is extremely inconvenient for many cases. For example, if you want to see the difference in the pathway between a gene with high expression and a gene with low expression in an expression profile, you need to program your own manual grouping before doing GSEA. If one gene is OK, how about multiple genes
This tool focuses on solving these complex problems
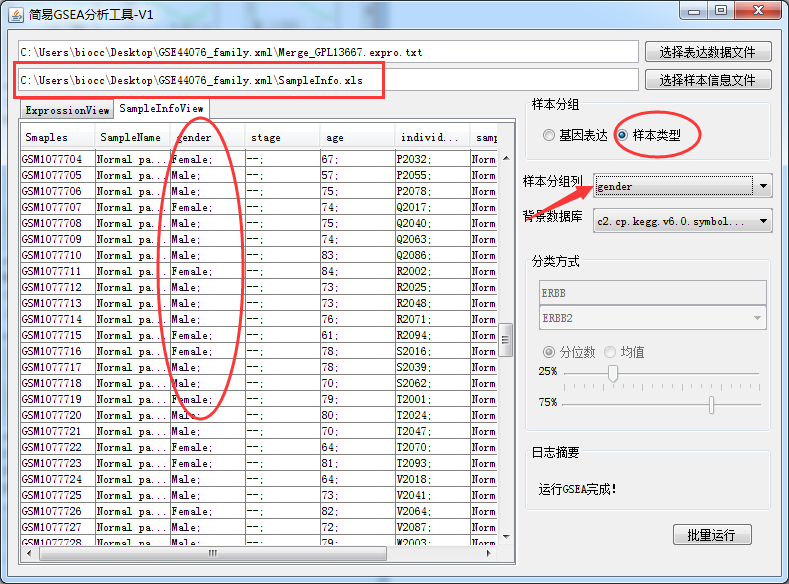
It can be seen from the software interface that the input file only has the expression spectrum and the sample information table, but the sample information table is not necessary. If you want to classify the samples according to the sample information and then do the GSEA, you can import the sample information table. Note here that the software will automatically match the sample information, without one-to-one correspondence, which is very user-friendly.
Let's play with an example,
Use the GSE44076 data set. The data download and pre-processing tutorial is shown here: https://www.shengxin.ren/article/135
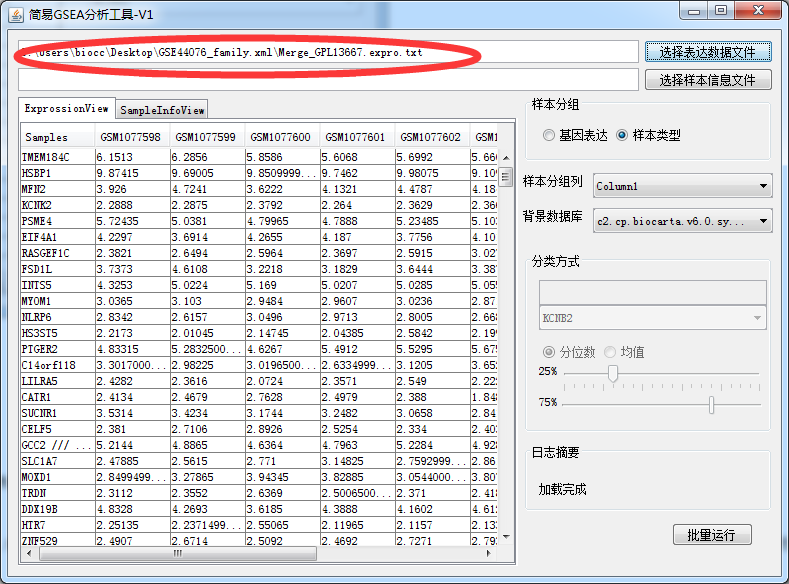
Now let's use the processed expression spectrum matrix and sample information, and import the expression spectrum matrix first
 Then let's look at the KEGG pathway enrichment differences between the top 25% and the bottom 25% samples with the highest expression of ERBB2, as shown in the figure:
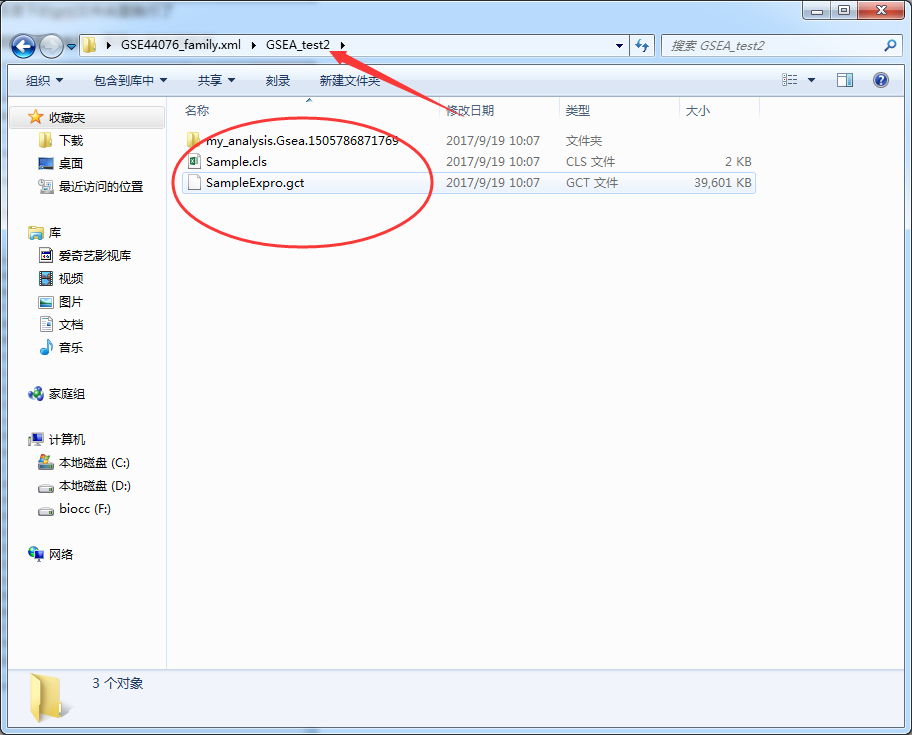
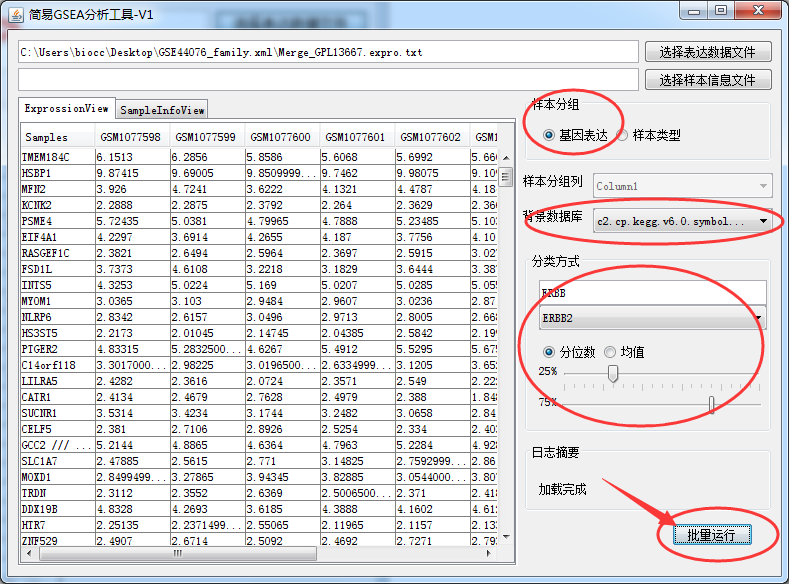 Click Batch Run, select the directory to save the results, and wait a little while. Finally, three files are generated in the directory to save the results. gct and cls can be used to repeat the results themselves
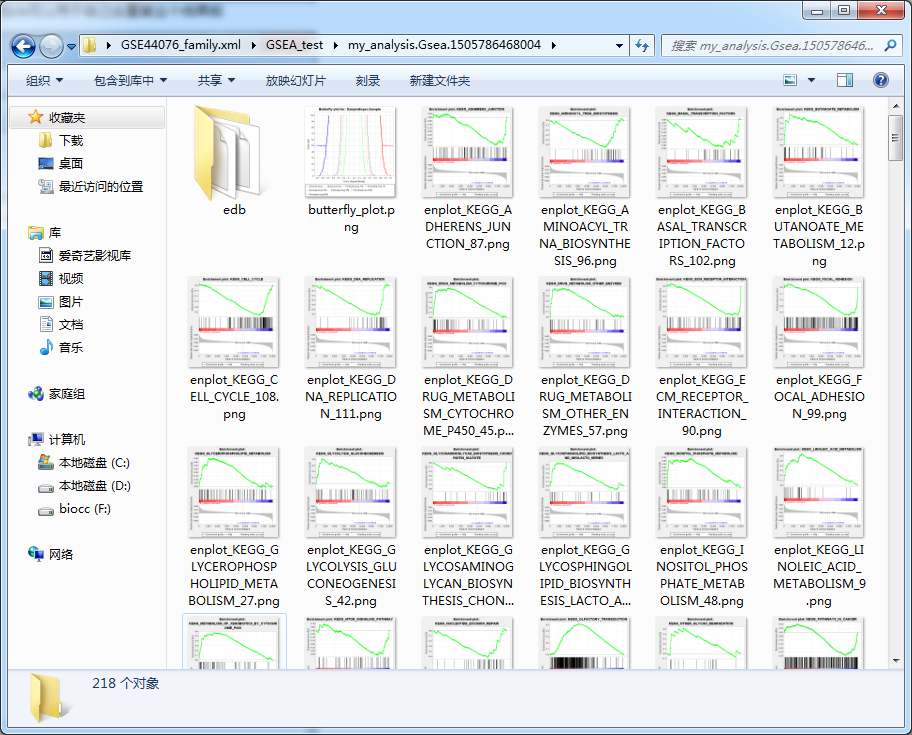
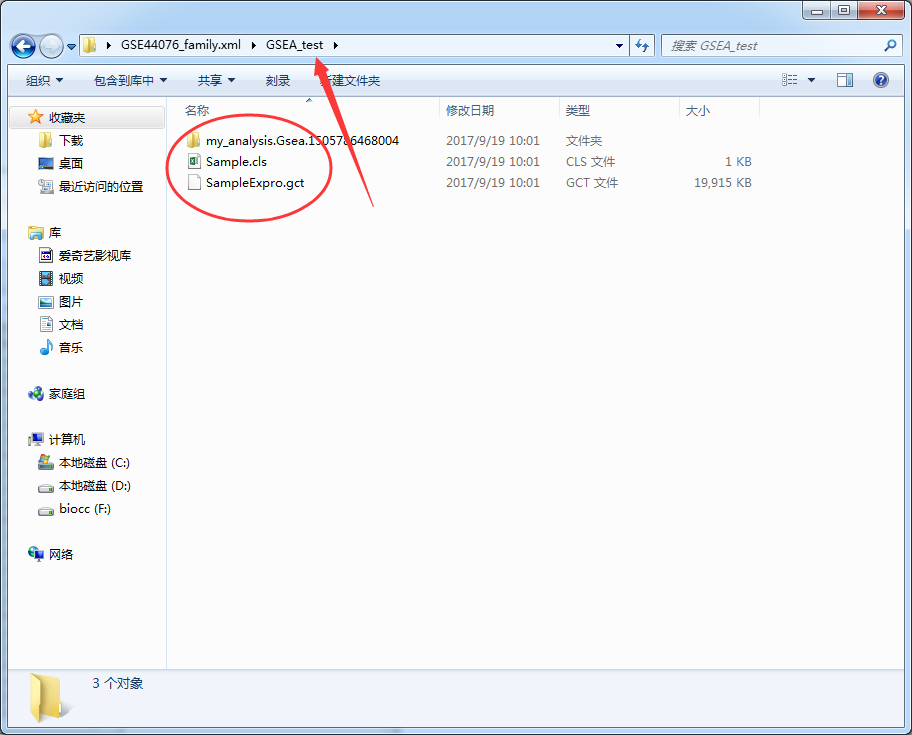 The folder at the beginning of my_analysis. Gsea. stores the results of GSEA enrichment analysis. Take a look
 Of course, the software provides six kinds of gmt data by default. If you need to customize it yourself, it is also very simple. You can only copy the gmt file to the gmt folder in the software directory
Then we just demonstrated how to do single gene. Now let's use sample information, for example, use gender classification to see the difference between men and women in KEGG pathway enrichment, and then import the sample information table
 Click Batch Run, select the directory to save the results, and wait for a while
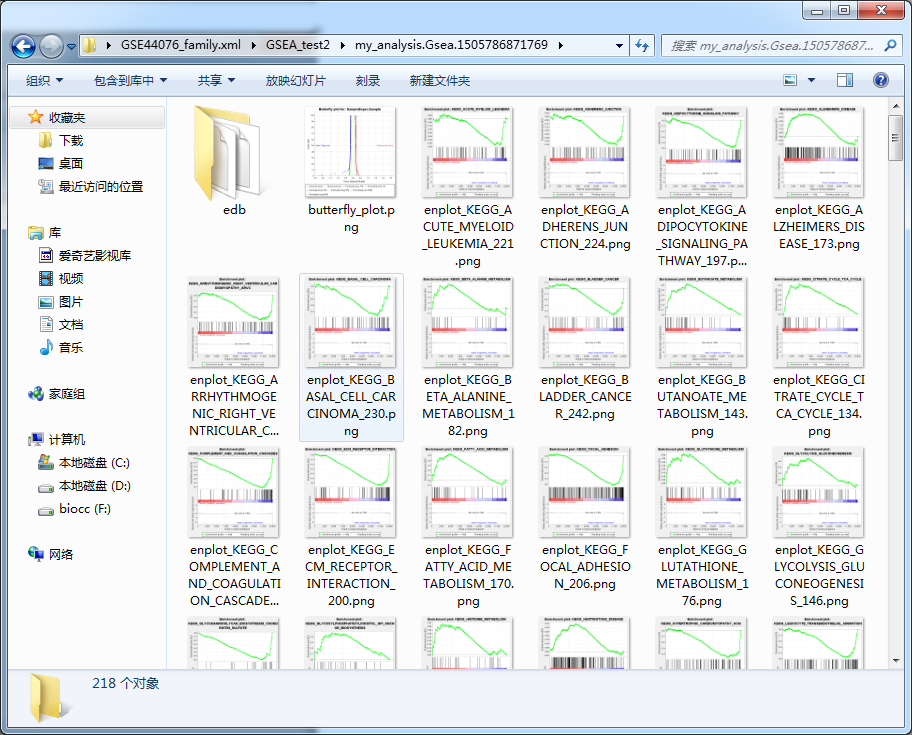
 Gorgeous results come out
 Another imperfection is the interpretation and beautification of the results. Let's wait for the editor to share with you~~