Article | Dai Qiang, Senior Development Engineer of Netease Yunxin Data Platform
Introduction: Data is crucial in many businesses. For Netease Yunxin, we use data to improve services and promote business growth. With the help of the service monitoring platform, we can intuitively feel the running status of online services. This article will analyze in detail how the service monitoring platform of Netease Yunxin is realized.
introduction
Usually, human fear comes from the unknown of the real world.
There are a lot of uncertainties in real life, and fear is because our current cognition cannot reasonably explain it. For example, the sudden outbreak of the epidemic has spread people's fear of death. There are many uncertainties in the world. What is uncertainty? Suppose we need to judge whether the stock index will rise or fall tomorrow. Without any data to support us, we can only toss a coin with a 50% probability. In this scenario, all the judgments we make are not credible, and we will feel uneasy about our decisions.
If people understand all the factors involved in an upcoming event, they can accurately predict the event; Or on the contrary, if an event occurs, it can be considered that its occurrence is inevitable, which is Laplace's creed (also known as determinism).
As the above theory expresses, data can help us guide the direction and verify whether our direction is correct. Similarly, data is also crucial to the development of NetEase Cloud Information. We need data to improve our services and promote continuous business growth.
Netease Yunxin is a PaaS service product integrating Netease's 20 years of IM and audio and video technology. We have been committed to providing Stable and reliable communication service How to ensure stability and reliability?
Service monitoring platform It is an important part of this, which is equivalent to the dashboard on Bugatti Veyron. What is the car's speed per hour, whether the fuel is enough, and what is the current speed? It is clear on the dashboard, which can help us judge whether we can still step on the accelerator, and whether we should brake when necessary. The goal and value of the service monitoring platform lies here. It is also equivalent to the dashboard of Netease Yunxin, a Bugatti Weilong, which can tell us how the current service quality is, whether we need to add more "oil", whether we need to step on the "accelerator" or "brake", to provide us and customers with more information and help us provide the best quality, most reliable The most stable service.

This article will analyze in detail how the service monitoring platform of Netease Yunxin is realized. Starting from the overall architecture, it will briefly introduce the framework of Netease Yunxin service monitoring platform, and then carefully analyze the implementation of four modules, including data collection, data pre-processing, monitoring alarm, and data application.
system architecture
Now the audio and video data of Netease Yunxin basically come from the logs of the client and server, so the entire data acquisition link is a very important part of it, which determines the validity and timeliness of the data.
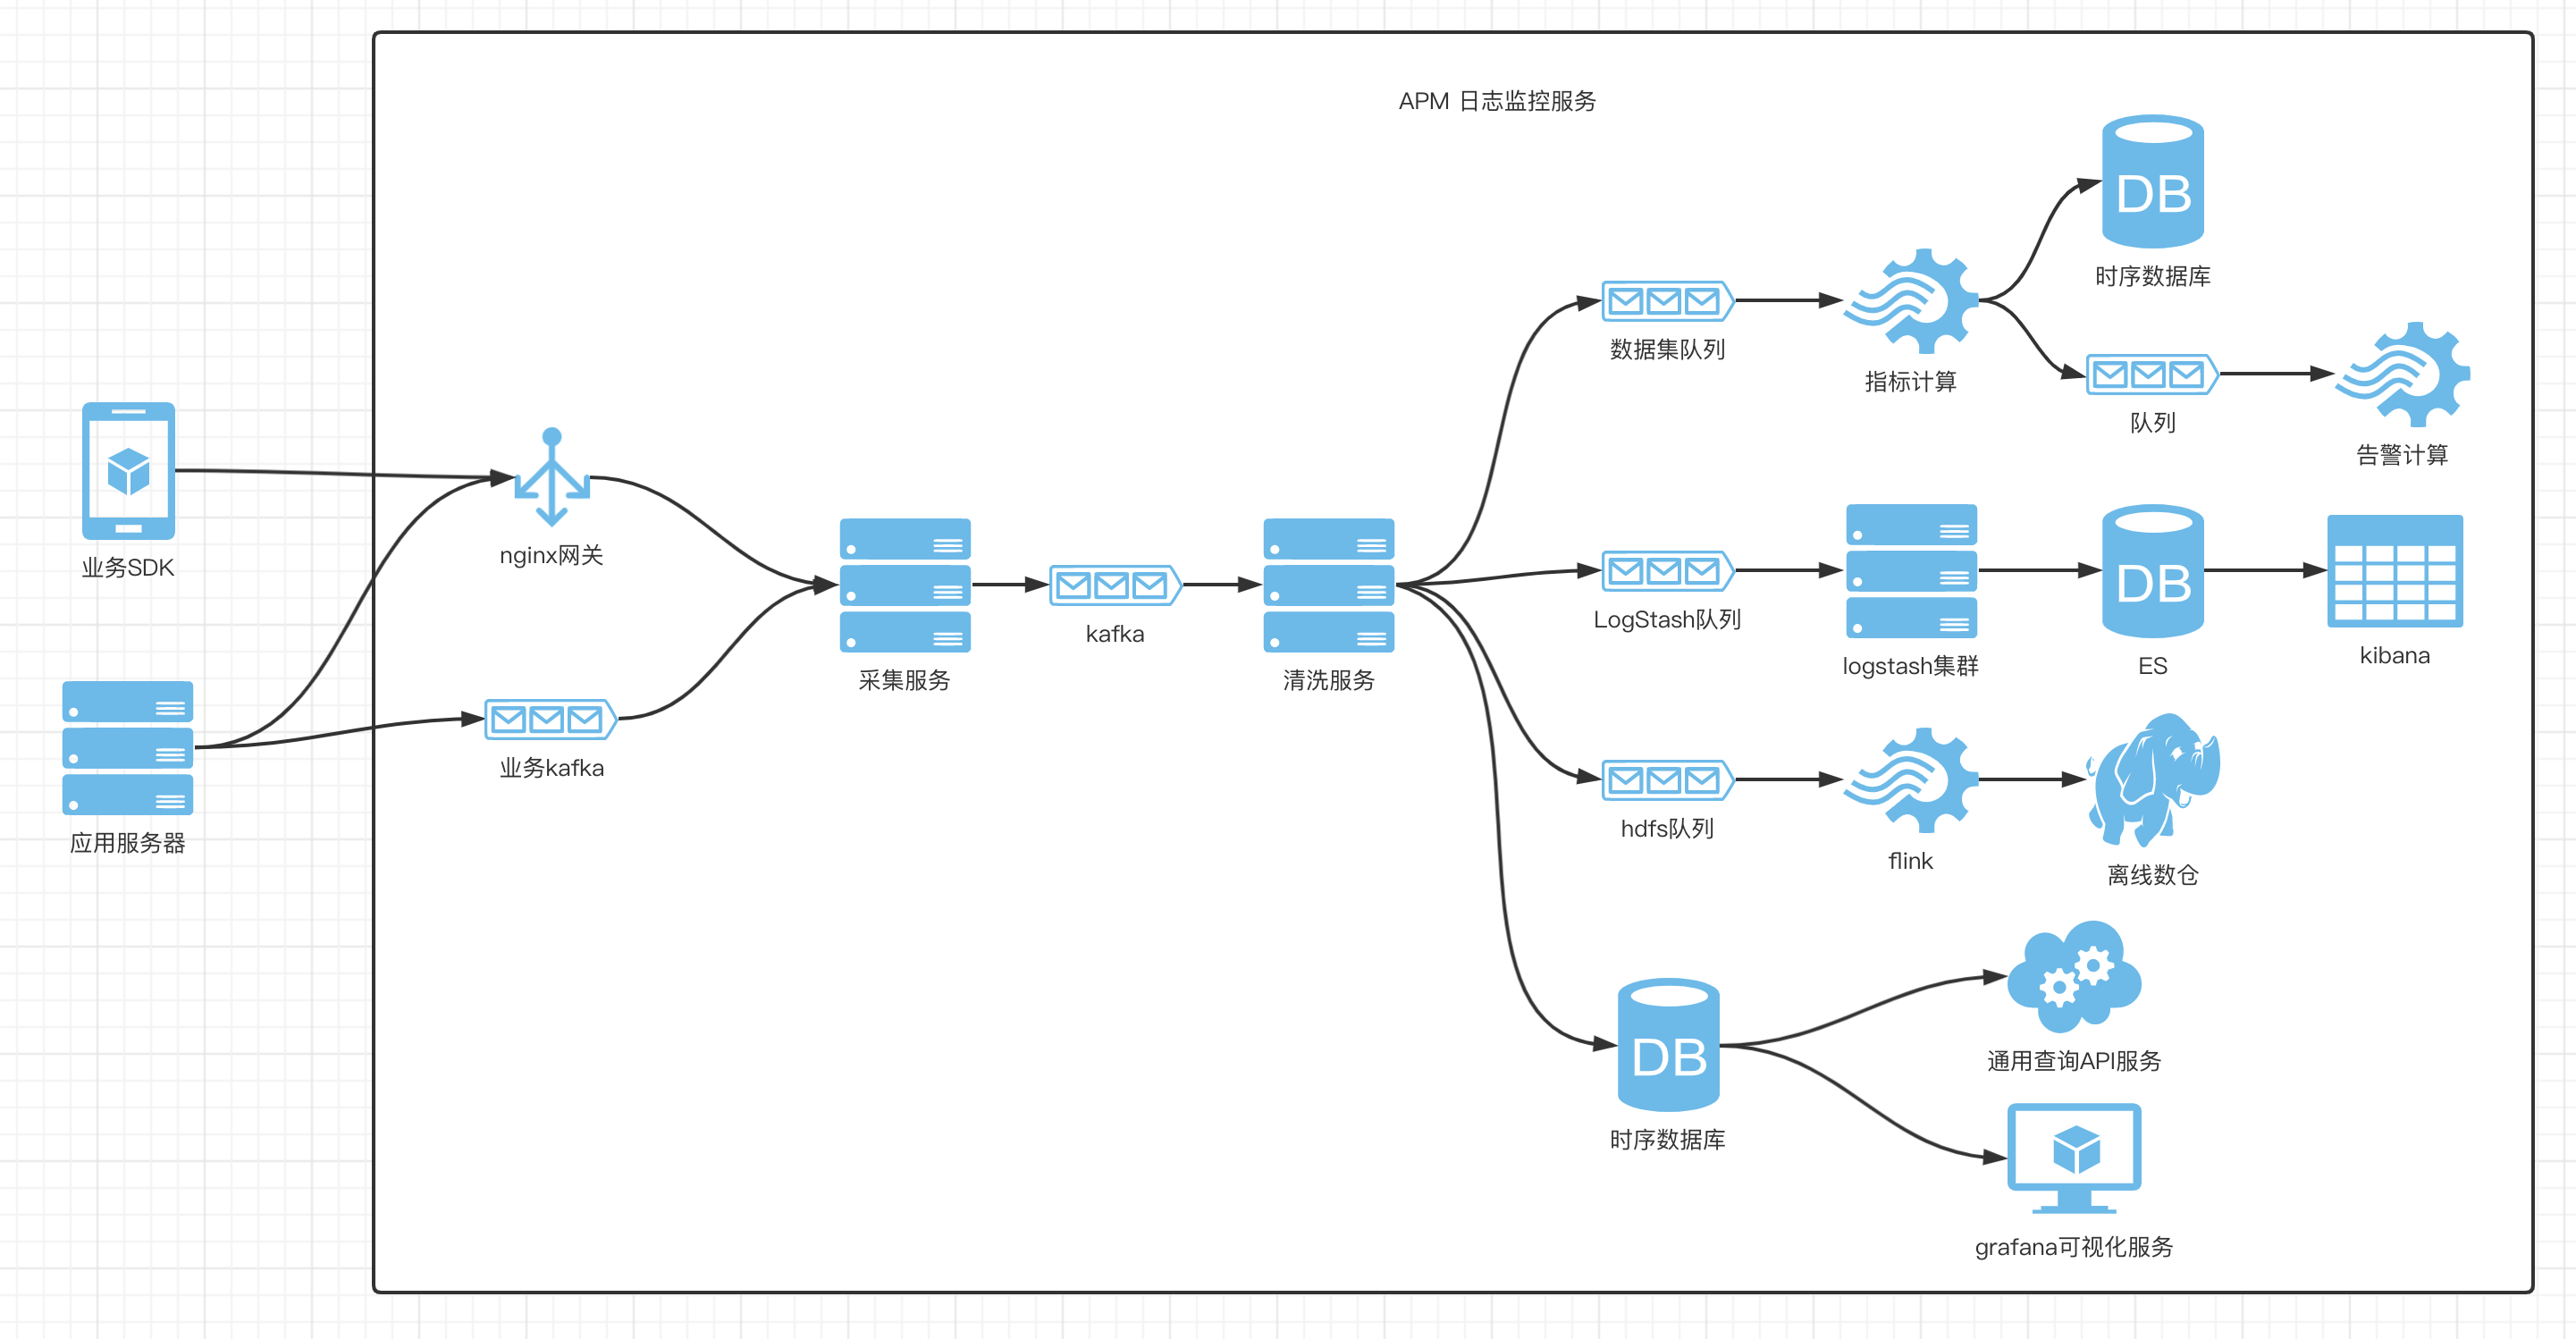
First, let's take a look at the overall architecture of NetEase Cloud Information Collection Monitoring Platform, as shown below:

The overall architecture of the acquisition monitoring platform is mainly divided into four parts: data acquisition, data processing, data application, and monitoring alarm. The whole processing flow is as follows:
- Data collection:
- Our main data sources are business SDKs and application servers. These data can be accessed to collection services through HTTP Api and Kafka.
- The collection service simply verifies and splits the data, and then transmits it to the data cleaning service through Kafka.
- Data processing: The data processing service is mainly responsible for processing the received data and sending it to downstream services for use. Among them, we provide simple data formatting capabilities such as JOSN, and also provide script processing modules to support more flexible and powerful data processing capabilities, which also makes the data processing capabilities of our monitoring platform more diverse.
- Monitoring alarm: The monitoring alarm module is the most important part of the service monitoring capability we mentioned at the beginning. We conduct multi-dimensional aggregation statistics and analysis on the collected data, and use rich aggregation algorithms and flexible rule engines to ultimately achieve the purpose of service early warning and problem location.
- Data application: The cleaned data can be directly written into the timing database for use by the problem troubleshooting platform, or can be accessed to the es, HDFS, and stream processing platforms through Kafka, and finally used by the user layer. For example: quality service platform, general query service, problem troubleshooting platform, etc.
Next, we will analyze the four modules in detail.
data acquisition
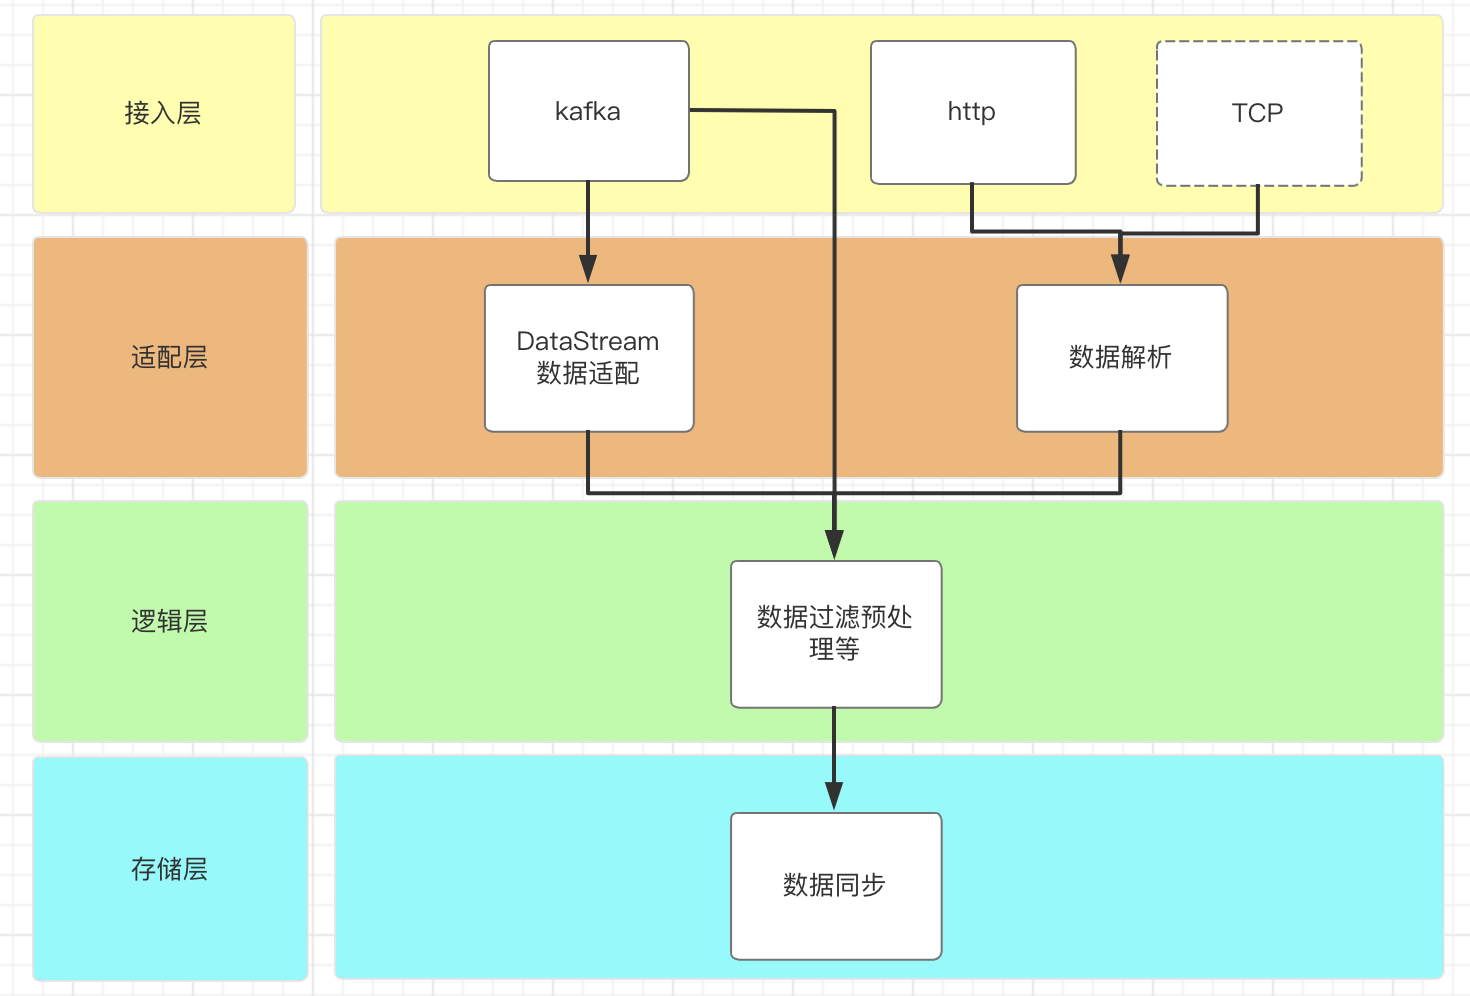
Data collection is the entrance to the service monitoring platform and the first step of the whole process. The following figure shows the architecture of the data collection module.

As mentioned above, in order to facilitate user access, we provide HTTP API and Kafka channels to the business side.
- The HTTP API is mostly used for real-time data reporting scenarios on the end or in the server to support second level data access.
- Kafka is mostly used in scenarios with high throughput and low real-time data requirements.
- The data filtering pre-processing module filters some illegal data in advance and splits the data in advance.
Finally, it is transmitted to the data processing service through Kafka, and then the data processing phase is introduced.
data processing
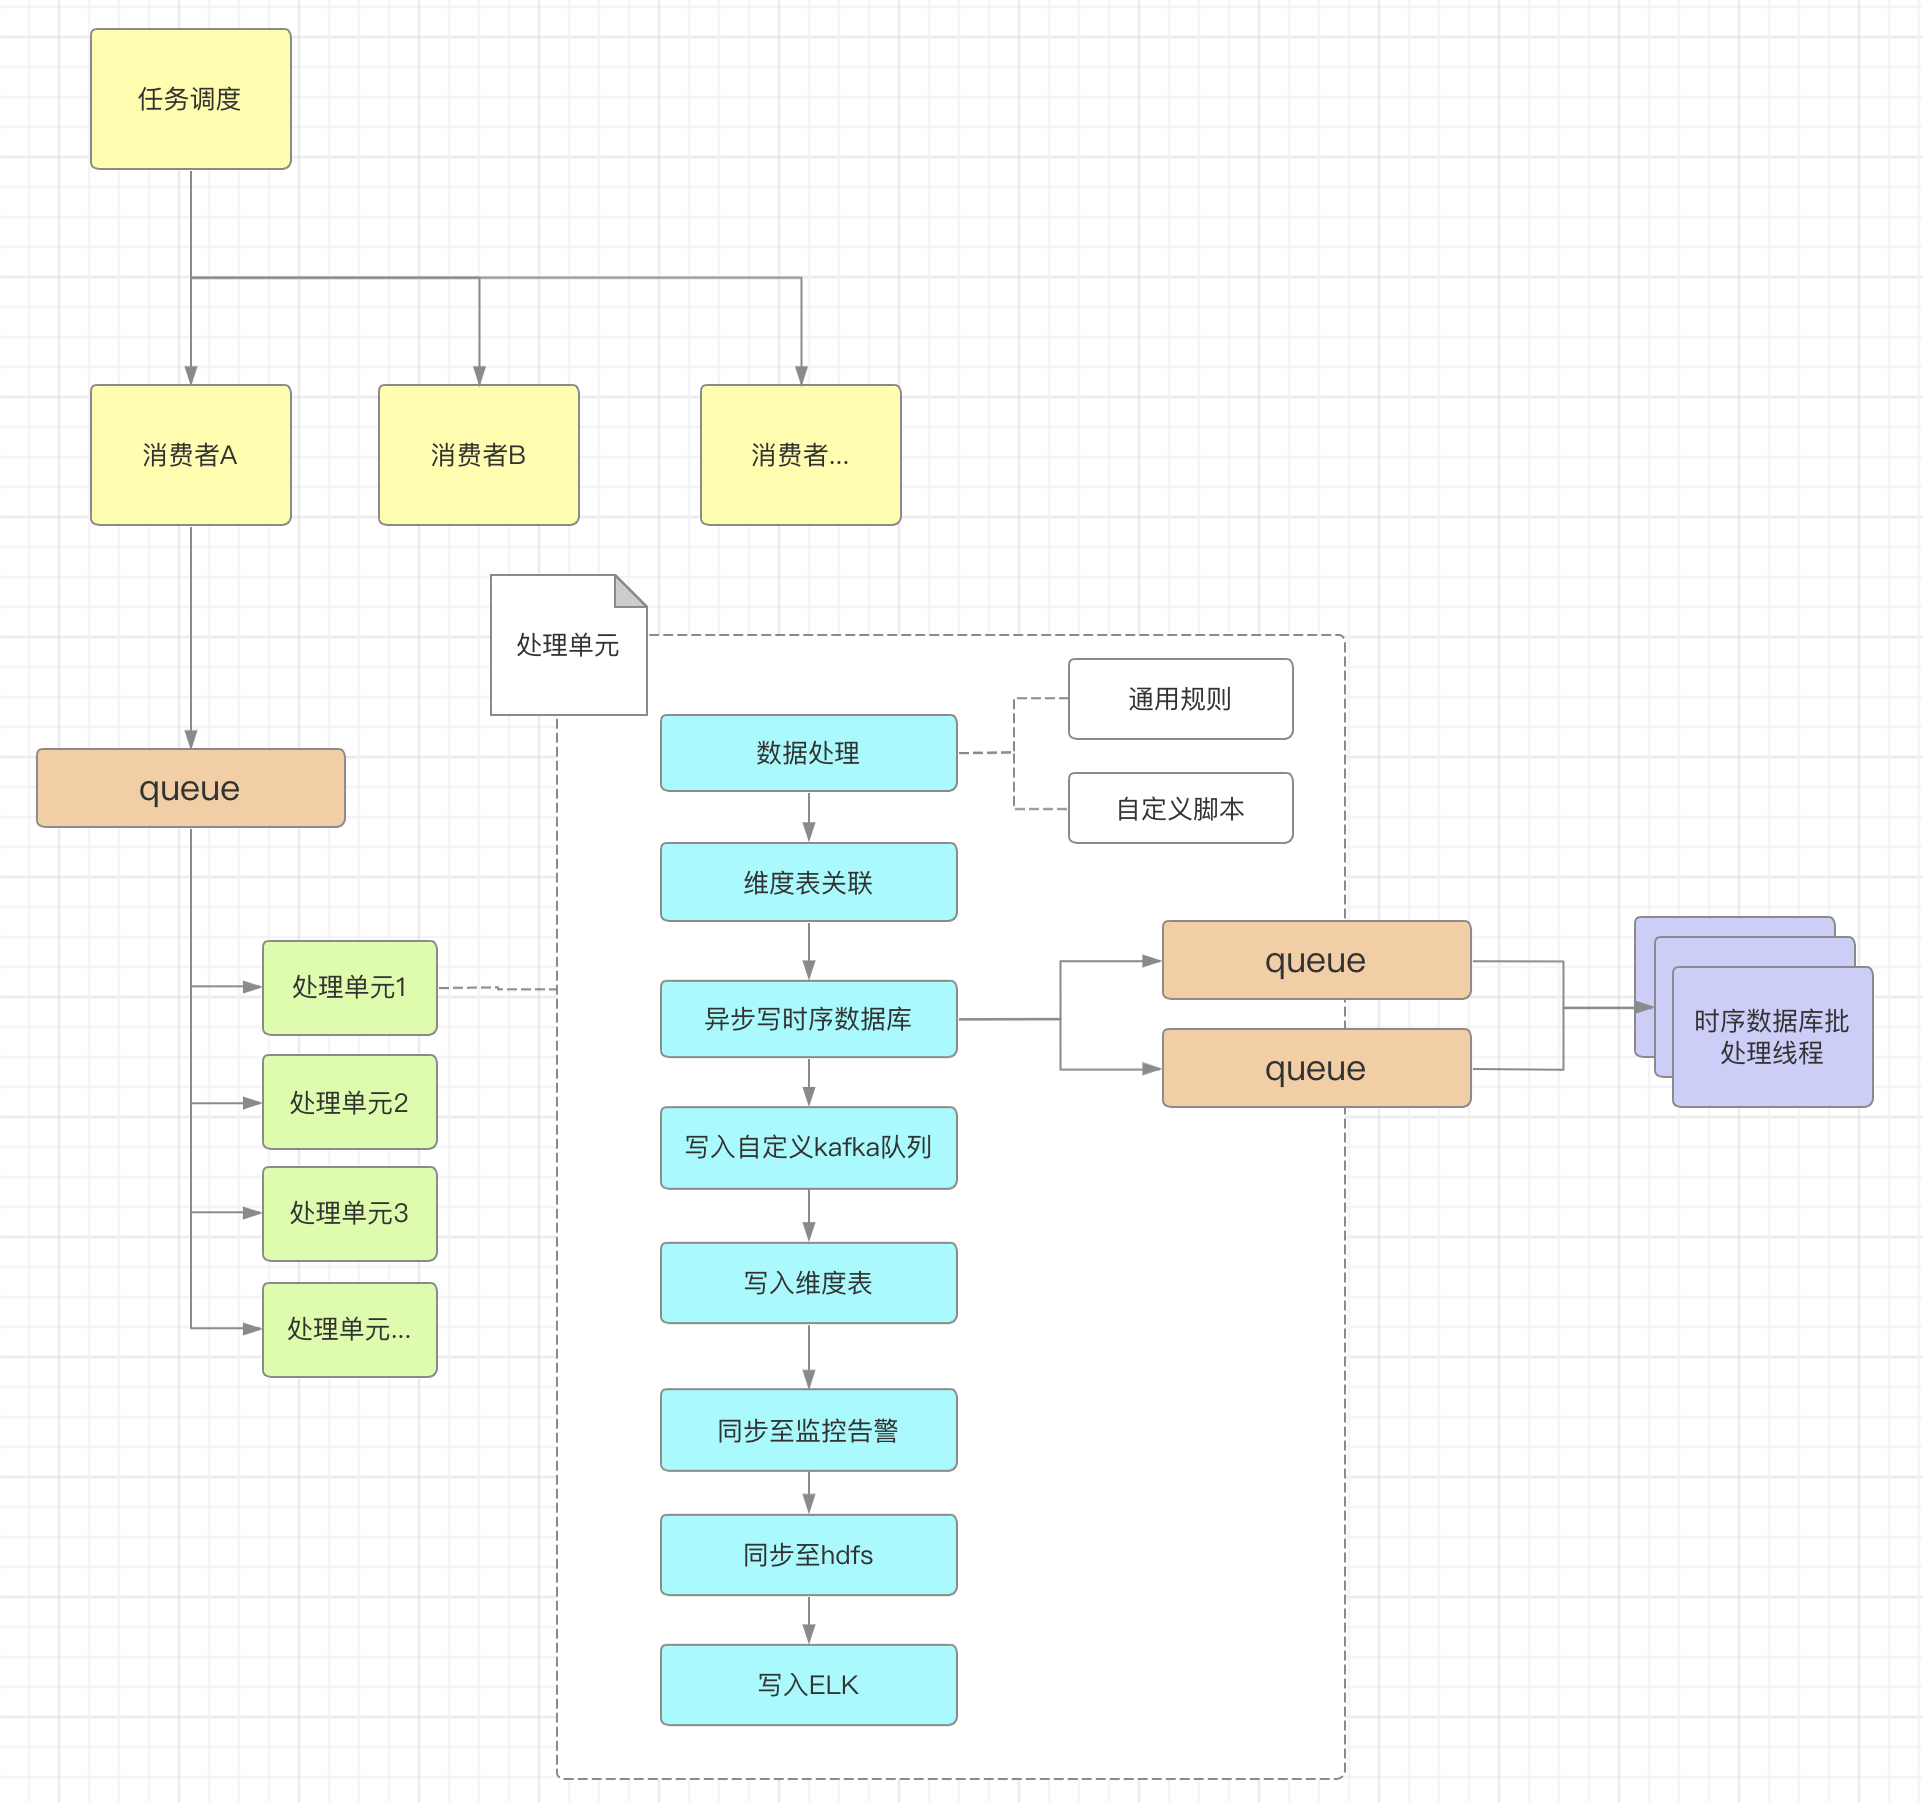
After the completion of the data acquisition phase, the data processing phase is entered. The specific process is as follows:

- Task scheduling is mainly responsible for the life cycle management of data processing threads, from startup to shutdown.
- Consumers use internal queues to decouple after obtaining data, so as to achieve the ability of horizontal expansion to improve the parallelism of data processing threads.
- Processing unit, parallelism can be set as required:
- Data processing capabilities are divided into two types, general rules and custom scripts. The general rules are simple JSON conversion, field extraction, etc., which can basically meet 80% of the requirements. However, in order to support complex businesses such as multi field association calculation, regular expression, multi stream association processing, etc., we also provide the ability of user-defined scripts to process data.
- The dimension table is mainly used for the scenario of multi data stream association processing. To solve the problem of high data volume and concurrency, the local+third-party cache scheme is used.
- Timing database output: We use NTSDB for timing database. NTSDB is a clustering scheme of Netease Cloud based on influxdb, which is characterized by high availability, high compression ratio, high concurrency, etc.
After data processing, the next important stage is monitoring alarms.
Monitoring alarm
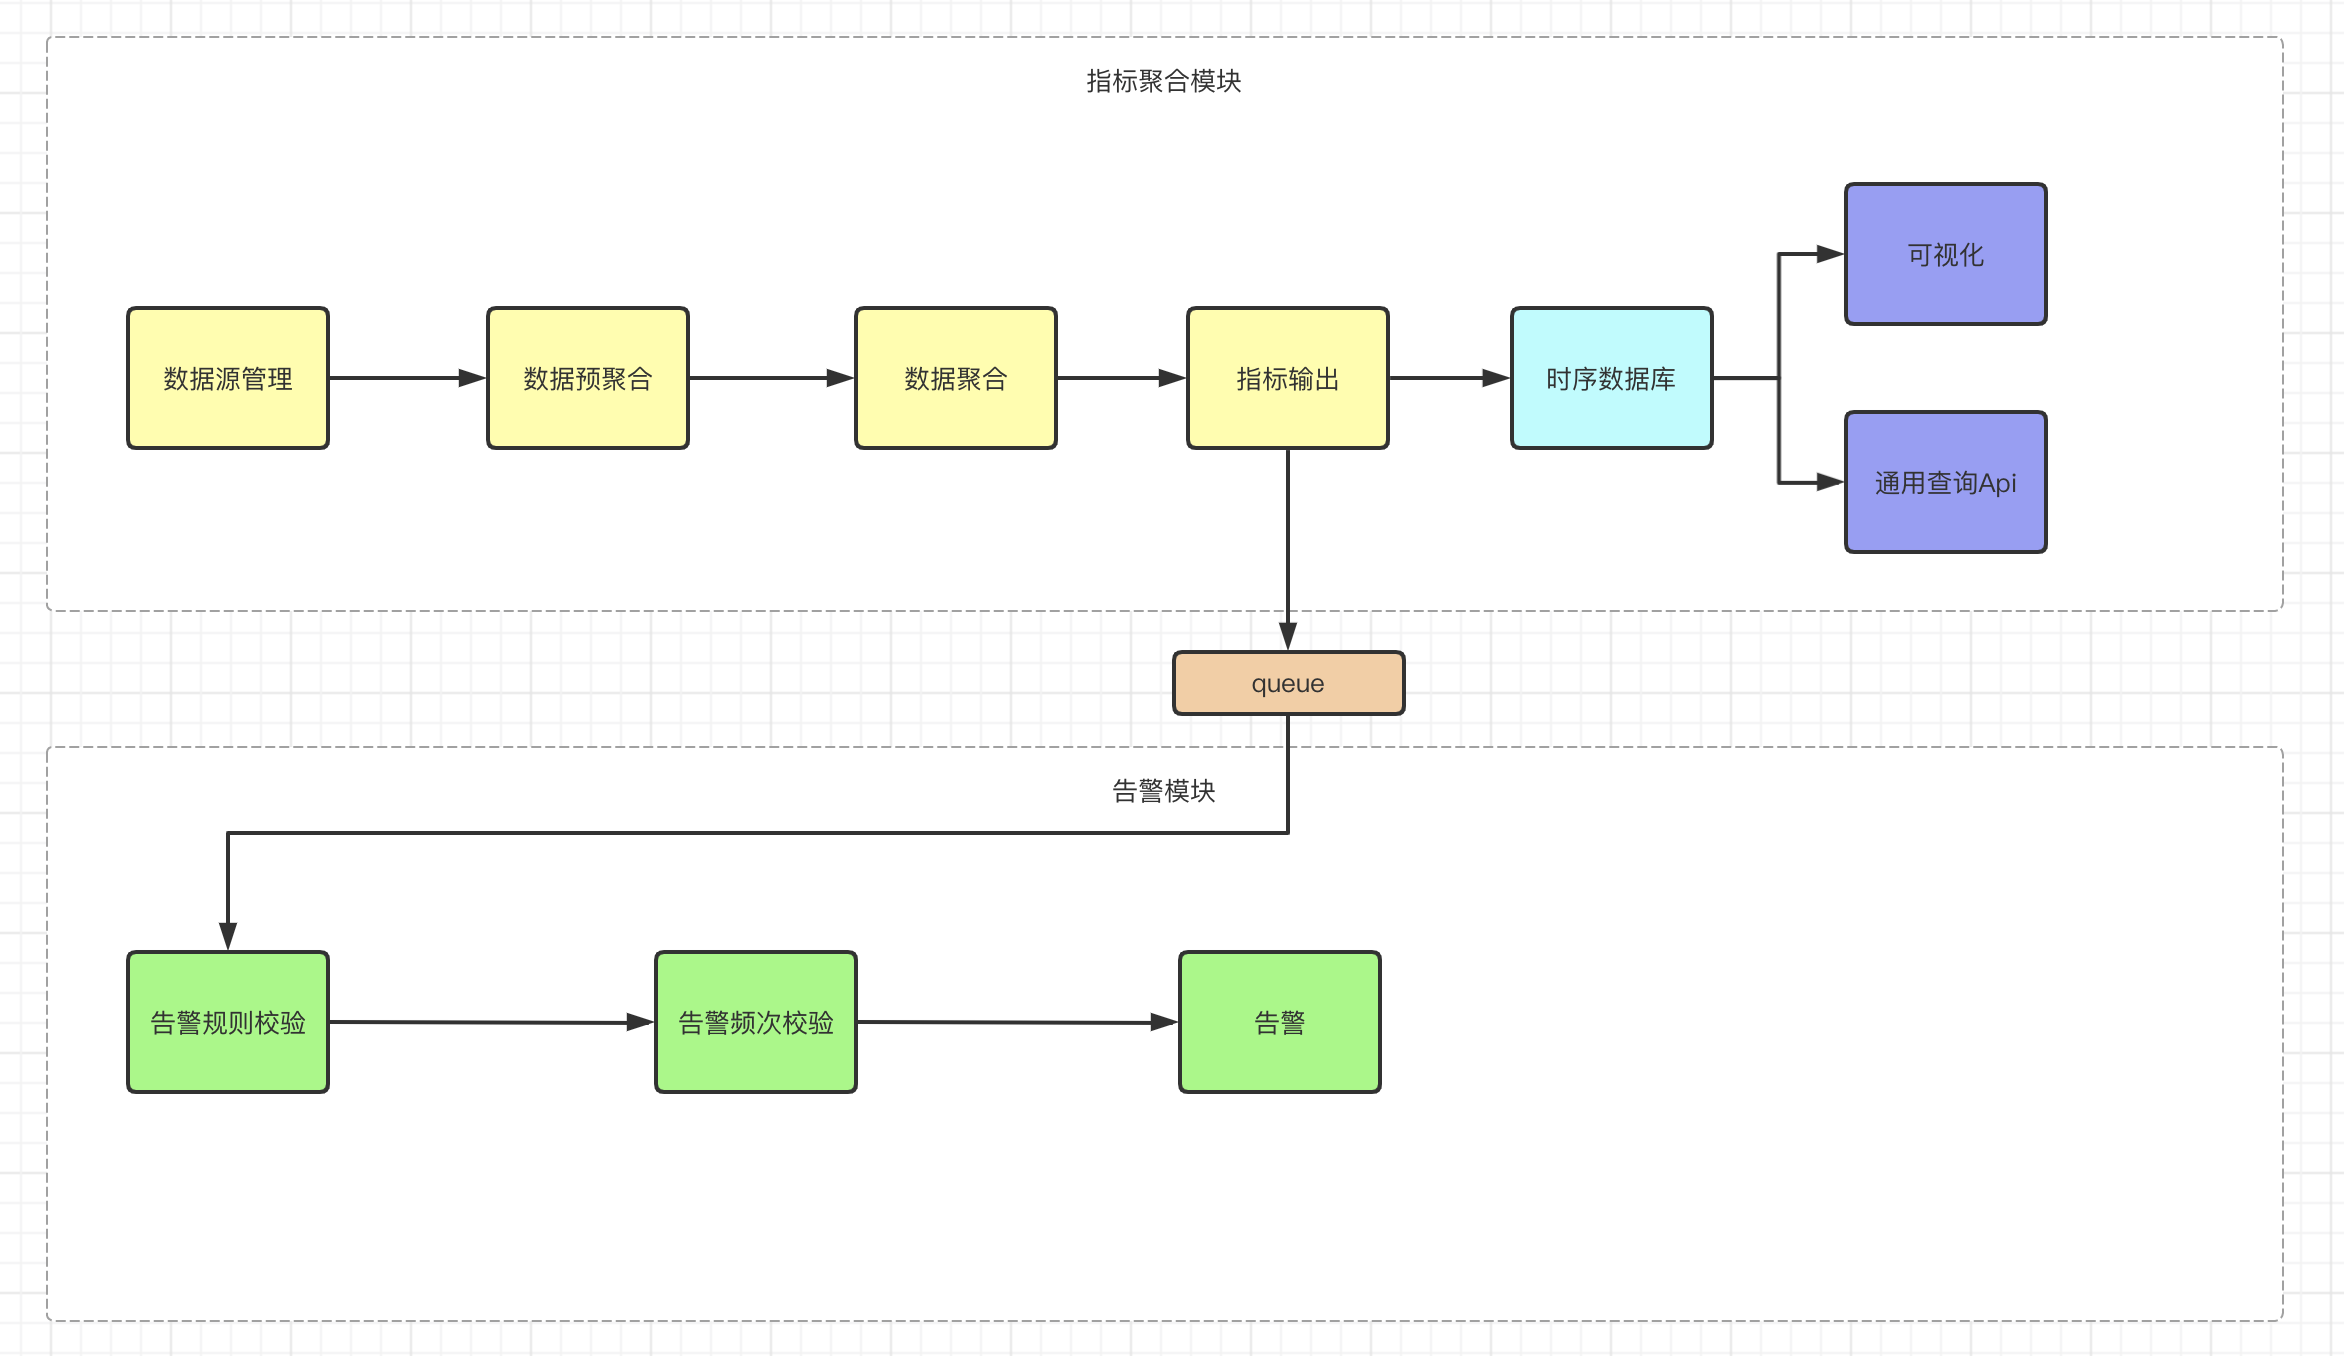
The following figure briefly shows the process of monitoring alarm:

The monitoring alarm stage is divided into indicator aggregation module and alarm module.
The indicator aggregation module supports specified field grouping statistics, flexible aggregation window time, data filtering, fine-grained operator level data filtering, and maximum data delay time. The most important thing is that we support very rich aggregation operators: accumulation, min/max firstValue/lastValue、 Average, number of records, de duplication count, TP series (TP90/TP95/TP99), link comparison, standard deviation, etc., and the ability to perform composite calculations (composite indicators) after the first indicator aggregation. These rich operators provide a guarantee for us to implement more flexible monitoring rules.
In addition, we have changed the original one-stage polymerization to two-stage polymerization. Why? Because in the process of data processing, we often encounter a problem: tilt caused by data hotspot. So here we add a preprocessing stage, in which random numbers are used to disperse data to ensure data balance, and then the pre aggregated data is aggregated in the second stage.
The alarm module and the indicator aggregation module are divided into two modules from the original one. The indicator module focuses more on how to do data aggregation, rather than being coupled with the alarm module as a part of the alarm module. As an additional function, the alarm only needs to do some alarm rule verification, frequency control verification, alarm information encapsulation, and docking with the message platform to send alarm messages according to the received data. At the same time, it supports the internal IM platform, SMS, phone and other message channels. The various message channels are designed to be able to sense the problem at the first time.
Data application
Existing platforms for data application: data visualization, quality service platform, ELK log platform, online and offline analysis, etc. Now, let's briefly introduce each platform.
Data visualization
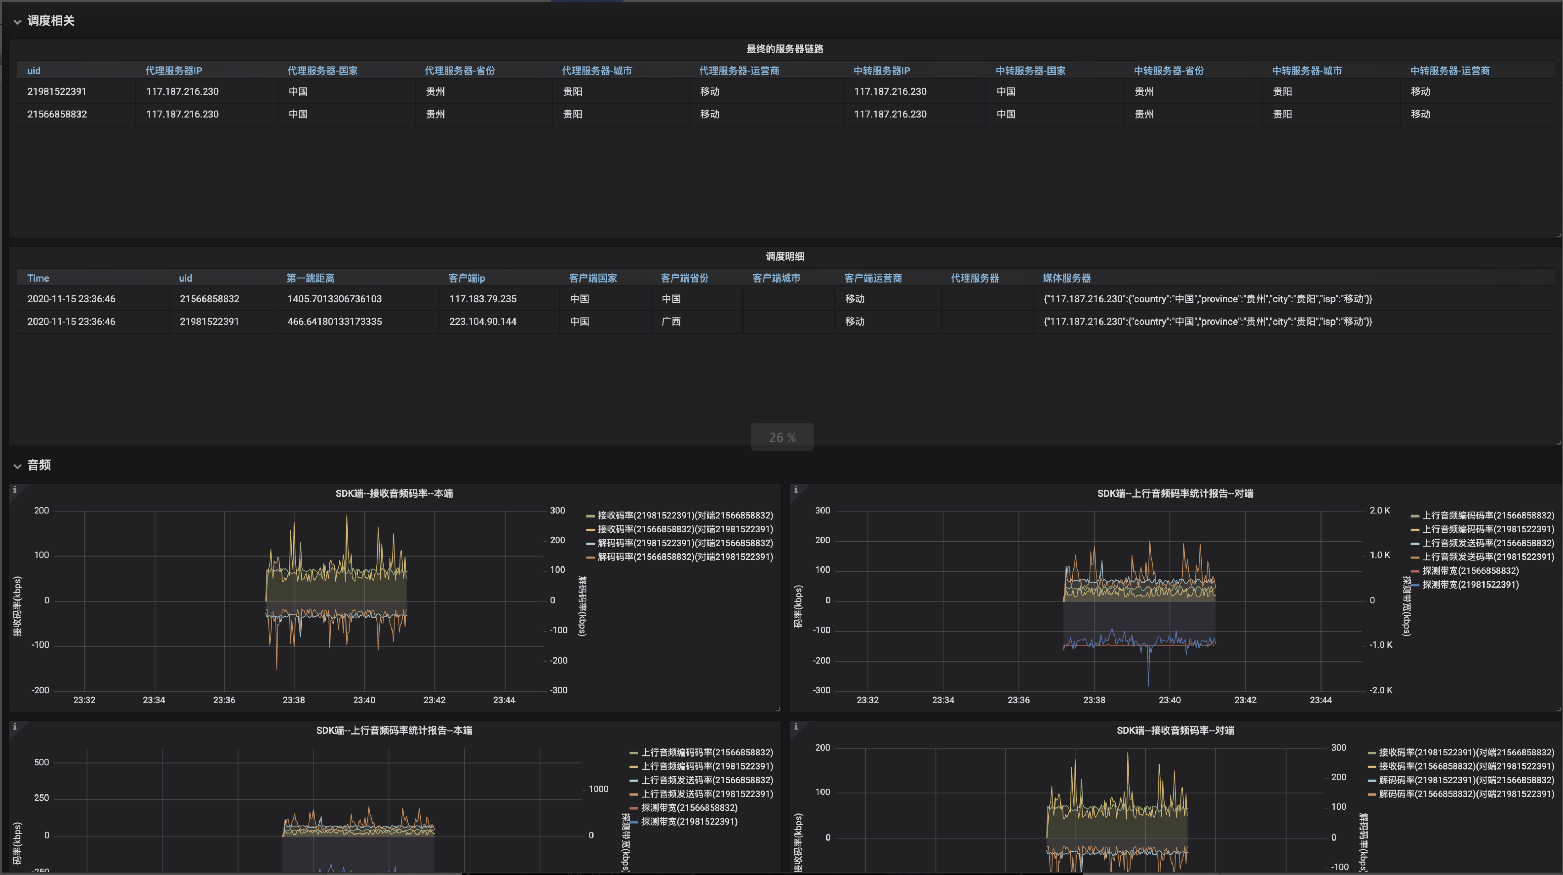
For data visualization, we use Grafana like most companies. The data that needs to be visualized can be synchronized to NTSDB first, and then NTSDB can be used as data to make charts and charts. In addition, for unsupported charts, we have made secondary development for Grafana to support more visualization requirements.
The following figure shows some dashboards for audio and video problem troubleshooting scenarios:


Quality service platform
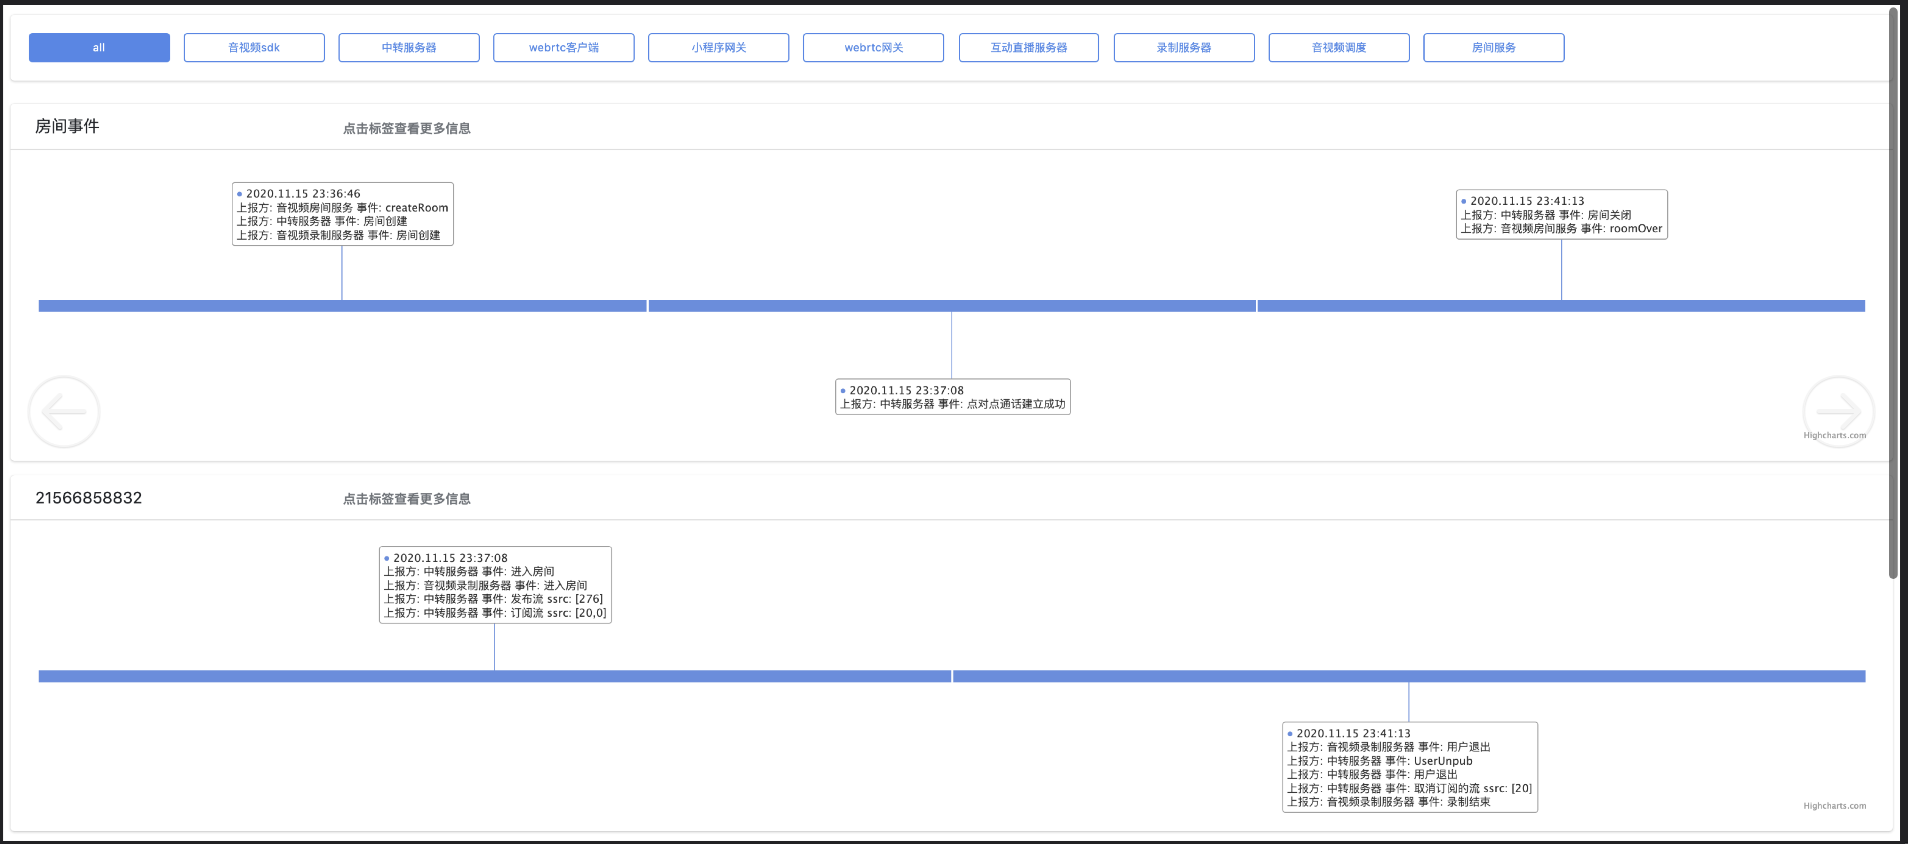
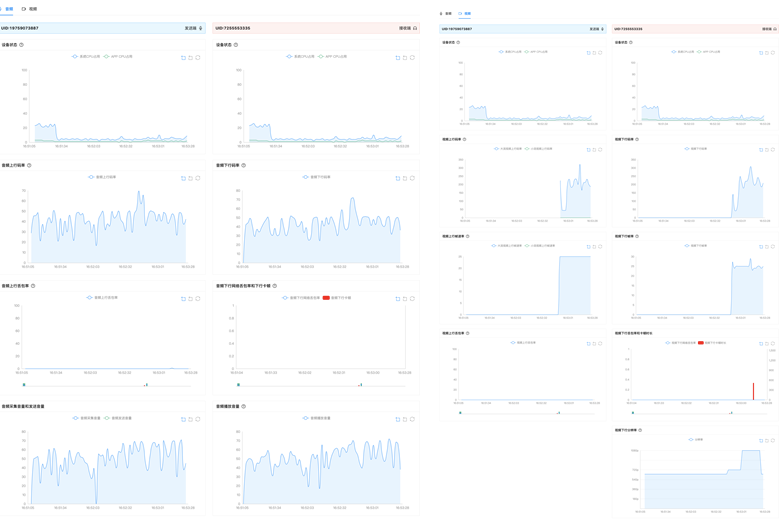
The platform is designed to provide customers with an intuitive, efficient, comprehensive and real-time problem location and troubleshooting tool. When customers receive problem feedback, they can find and locate problems at the first time, and finally feed back to users and optimize.

ELK Log Platform
The ELK technology stack contains three components, Logstash, ES and Kibana. It is a complete set of log collection, storage, query and visualization solutions. Currently, our system is more used for detailed log queries.
Online and offline analysis
Here we use Kafka as the data pipeline, and use Flink platform to segment and archive log data. After this part of data is synchronized to the offline database, subsequent data mining and analysis work can be carried out. Similarly, the discussion is not expanded here.
epilogue
The above is the full introduction of this article, which analyzes the design and practice of Netease Yunxin service monitoring platform, mainly introduces the system architecture of the whole service monitoring platform, and makes some elaboration on four points of data collection, data processing, monitoring alarm, and data application.
The entire data collection and monitoring system of Netease Yunxin has grown from more than a dozen original collection tasks to more than 300 since its launch in early 2020. 100+key user behaviors and system events, 300+core audio and video indicators, and millions of lines of data and T-level data are processed every day. The concurrency and throughput of the entire platform are rising, which is due to the continuous growth of cloud messaging services, but also makes us put forward higher requirements for the stability and scalability of the platform. In the future, we will rely on the ability of the platform to provide customers with more quality services.
Author Introduction
Dai Qiang, a senior development engineer of Netease Yunxin data platform, has been engaged in the work related to the data platform. From 0 to 1, he has built the real-time and offline digital warehouse system of Netease Yunxin, and is responsible for the design and development of the service monitoring platform, data application platform, and quality service platform.

