The full name of ANR is Application Not Responding, which means that the program does not respond.If the application is blocked in the UI thread for too long, ANR will occur.When ANR appears, a prompt box will pop up.
ANR type
(1).Broadcast ANR
(2). ServiceANR
(3). ContentProviderANR
(4). InputANR
(5).System WatchDog
ANR timeout threshold
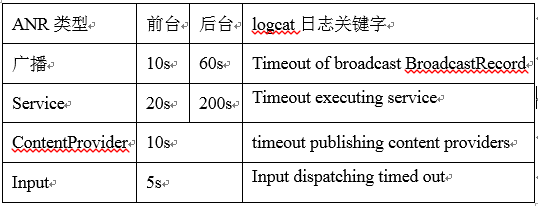
The timeout thresholds of different components are different. The timeout thresholds of Service, Broadcast, ContentProvider, and Input are as follows
(1)BroadcastTimeout
Foreground Broadcast: An ANR occurs when onReceiver fails to complete processing within 10S.
Background Broadcast: ANR occurs when onReceiver fails to complete processing within 60s.
(2)ServiceTimeoutThe foreground service: onCreate, onStart, onBind and other life cycles do not complete processing within 20s, and the ANR occurs.Background services: onCreate, onStart, onBind and other life cycles have not been processed in 200s, and ANR has occurred (3)ContentProviderTimeout ANR occurs when the ContentProvider does not complete processing within 10S.(4)KeyDispatchTimeout
The input event is not processed (such as pressing a key or touching) within 5S, and an ANR occurs.
[II]. Causes and scenarios of ANR】
oneCauses of ANR
a.Time consuming operation
b.Self service blocking
c.System blocking
d.Memory tight
e.CPU resource preemption
2. Typical Scenarios
a.The main thread frequently performs time-consuming IO operations, such as database read and write
b.The main thread is blocked due to the deadlock of multi-threaded operation;
c.The main thread is blocked by the Binder peer;
d.ANR appears on the WatchDog in SystemServer;
e.servicebinderThe connection of has reached the upper limit and cannot be combinedSystem Serversignal communication
f.System resource exhausted (pipeline, CPU, IO)
[III]. ANR positioning and analysis】
1. ANR analysis idea - traces
Usually, when an ANR occurs, first look up the corresponding Trace (trace information of each thread call stack of an important process) log to see whether the main thread is processing the broadcast or blocked.
Trace path:/data/anr/traces.txt
Trace export: adb pull/data/anr/traces.txt
The latest ANR information is at the beginning. We can find the specific number of rows in question from the stacktrace.
Use ctrl+F to find the package name in the file to quickly locate related codes.Special attention:Generate a new ANR, and the original traces.txt file will be overwritten.
2. Other ANR analysis ideas and related logs
If the stack is found to be completely idle, it needs to be analyzed in combination with log logs, including logcat, kernel logs, cpuinfo, and meminfo. The reference order is from front to back.
Analyze the idea of logcat
First, search the log for keywords such as "anrin", "low_memory", and "slow_operation". Through these keywords, you can mainly view the system CPU load. If you find that the application process CPU is obviously too high, it is likely that the process preempts too many CPUs, and the system is not scheduled in time, mistakenly thinking that the application has timed out.
Analyze kernel ideas
Search lowmemorykiller directly in such logs. If it exists, check whether the occurrence time and the ANR time roughly correspond. If there is little difference, you can see the current memory situation on the operating system level from this log. Free Memory refers to free physical memory, File Free refers to file cache, that is, the application or system reads files from the hard disk. After use,The kernel does not release this kind of memory and cache it for the purpose of speeding up the next read/write process.Of course, if the overall value of Free and Other is low, the kernel will exchange memory to some extent, causing the whole system to jam.At the same time, this kind of phenomenon will also be reflected in the log "slow_operation", that is, the scheduling of system processes will also be affected.
Analyze the idea of cpuinfo
This type of log can clearly see which process has a high CPU. If there is a process with a high CPU, the ANR has something to do with this process preempting the CPU.Of course, if Kswapd and emmc processes are found in top, it means that the system memory pressure or file IO overhead is encountered.
Analyze meminfo ideas
The analysis of this type of log is mainly to see which applications or systems occupy high memory. If the application memory occupation is relatively normal and the system does not have excessive memory usage, then it means that a large number of processes are cached in the system and the overall memory of the system is low because they are not released in time.
3. Important fields of traces.txt
Main: main identifies the main thread. If it is a thread, it is named in the form of "Thread-X". x represents the thread id and increases gradually.
Prio: thread priority, default is 5
Tid: tid is not the thread ID, but the thread unique ID
Group: is the thread group name
SCount: The number of times the thread is suspended
DsCount: is the number of times a thread has been suspended by the debugger
Obj: object address
Self: the address of the thread's native
SysTid: is the thread number (the thread number of the main thread is the same as the process number)
Nice: is the scheduling priority of the thread
Sched: indicates the scheduling policy and priority of threads
Cgrp: Scheduling Home Group
Handle: The address of the thread processing function.
State: is the scheduling status
Schedstat: read from/proc/[pid]/task/[tid]/schedstat. The three values represent the time the thread executes on the CPU, the thread's waiting time, and the length of the thread's time slice. The three values that do not support this information are all 0;
Utm: the time value used in thread user mode (unit: jiffies)
Stm: is the scheduling time value in kernel mode
Core: the serial number of the cpu core that last executed the thread.
Find the java stack information, locate the code location, and locate the problem.
[IV]. ANR analysis case】
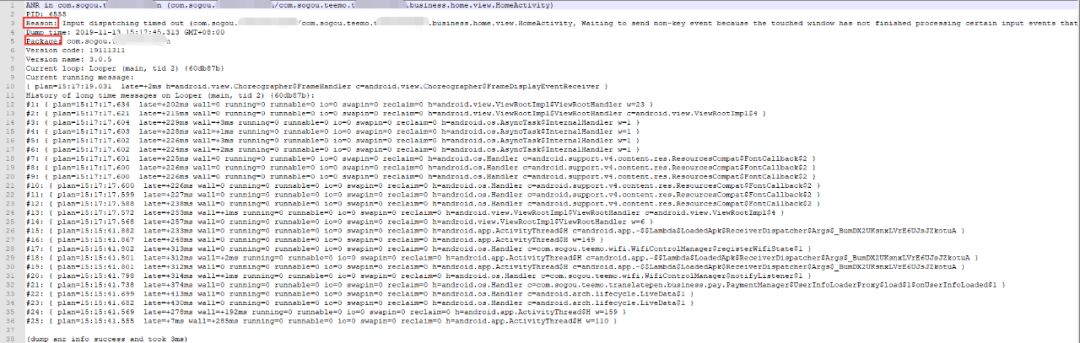
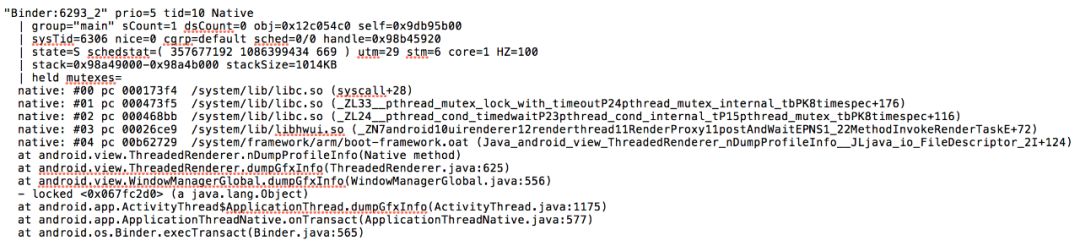
Case 1: Input ANR
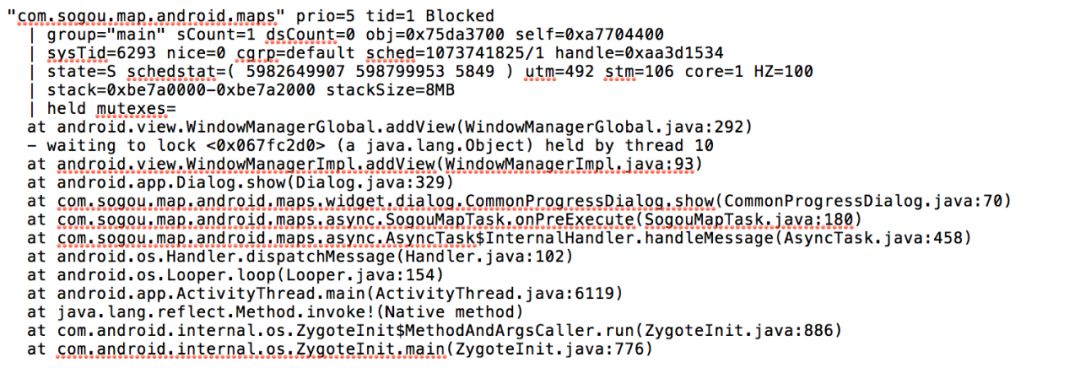
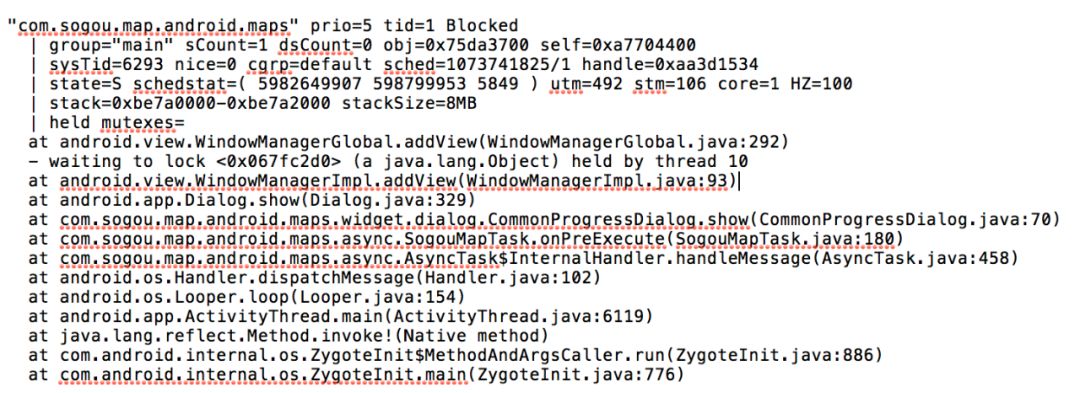
Case 2: The lock on the system method is not released
WindowManagerGlobal.dumpGfxInfo
Blocked must have held objects. This sometimes happens in the binder, so you need to analyze the log related to the binder
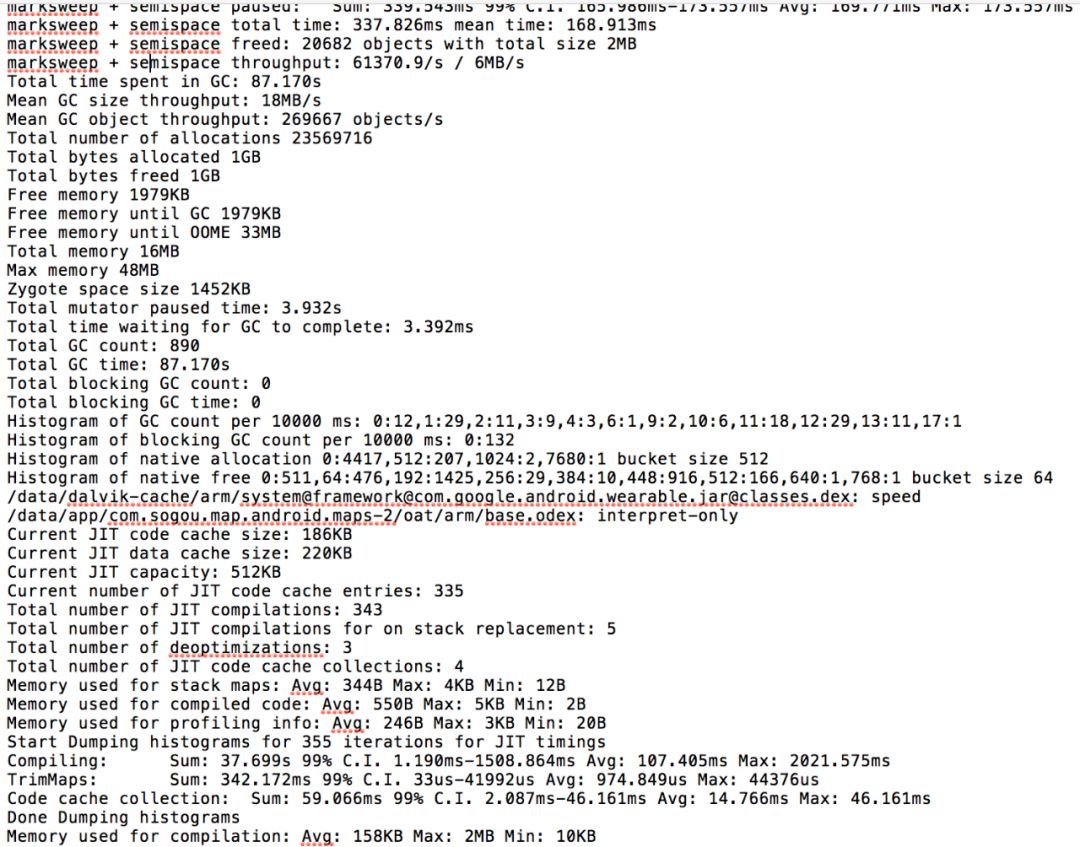
Analysis case 3: memory problem
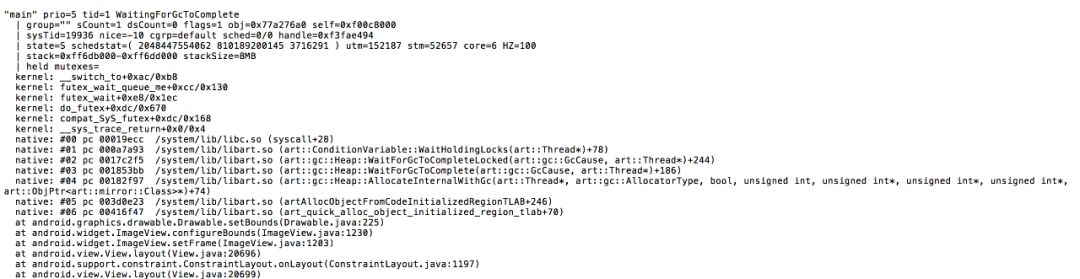
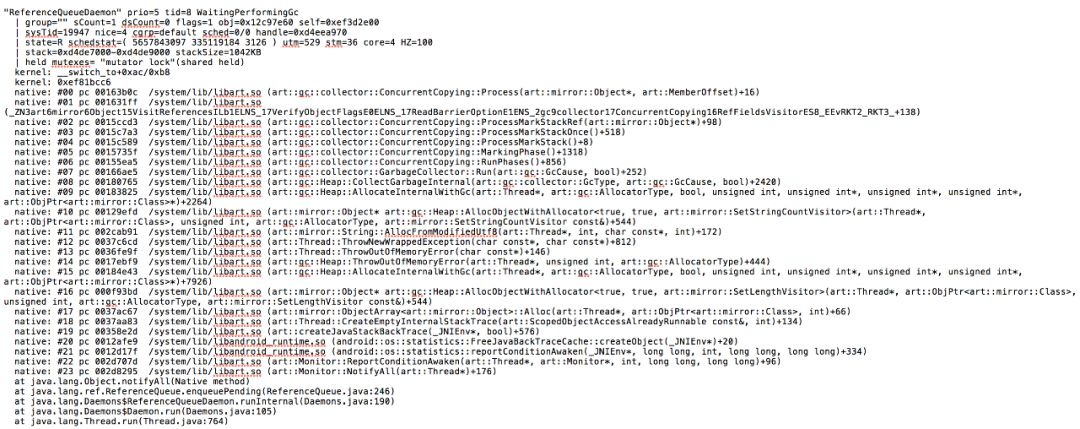
Case IV GC problem
Observe the Trace main thread stack. It is found that the main thread is blocked in the process of applying for memory, waiting for the GC to end,
Look at other thread statuses and find out that the following tasks are executing GC
Tip=8 threads execute GC, which causes the main thread's memory application to be blocked,Improper use of application process memory causesGCHourInterprocessANR。
[Reference】
This article is shared from the WeChat official account Sogou QA. In case of infringement, please contactsupport@oschina.cnDelete. Participation in this article“OSC Source Innovation Plan”, welcome you to join us and share with us.
I give you six seconds. I give you six moves with the same effect in the martial arts contest, which shows the invincibility and confidence of the master
Although France is the parent community, the core developers of OCCT on github are all Russians. Without Russians, the French parent community cannot continue to operate.So Huawei took over, moved to China, changed its name and resumed open source and community operations. What's the problem?
It is compatible with Oracle, but does not know "just" or "just".Those who can be compatible with Oracle and do well are real men and real warriors.You should know that compatibility means that even bugs must be compatible, and you have no other code that can not be copied.It's all based on real skills and understanding of oracle.
It seems that the current version of the Foreign Function&Memory API is not as fast as that of jni, or even worse. In addition, before vallhala comes out, all interactions between java and c have to get an additional memory. Even if it comes out, it may not be possible to directly throw a copy of binary data into memory as a structure. When the two apis are completely stable, the day lily is cold
Why is this so-called "vulnerability" not a vulnerability? Spring, MyBatis and other frameworks can accept all kinds of CVE criticism, while MyBatisPlus has to dump the pot and accuse programmers of being too low-level#There is a difference. The premise is that you write XML, MyBatisPlus encapsulates Wrapper and claims to simplify code. Since it encapsulates and hides $#, it is not appropriate to do some necessary security checks?Instead of doubting the authority of CVE, you should know that SQL ->MyBatis ->MyBatisPlus ->various back-end scaffolds have multiple layers, each layer is simplifying, and each layer is throwing away the upper layer of the boiler. Who dares to use them.The programmers who use MyBatisPlus can't be expected to be at a high level. Every programmer wants to save effort. The front-end parameters can be directly obtained by HttpServletRequest from the back-end. Wrapper splicing can be found everywhere. If something goes wrong, is it the front-end or the framework?According to Qingmiao, can the injection vulnerability of the previous log4j and the deletion vulnerability of the Druid be used to eliminate low-level programmers?
I suggest that 360 open source all its products, and then become the leading enterprise in the domestic open source industry through open source, leading everyone to compete with foreign enterprises
Not everyone will go to see the document in full detail. As a general basic framework, the method naming should consider not only readability but also understandability. At least, it should also establish a cognition for developers. LambdaQueryWrapper is recommended. The official only briefly said that QueryWrapper may lead to SQL injection risks,There are no detailed examples (many people don't understand what SQL injection is).Now I met a jerk and submitted it to CVE to see who is the most powerful
My technical article was moved by CSDN. Why didn't anyone step on the sewing machine? This kind of report is a joke to me. The monsters with background are fine, and the monsters without background fight to death
Buddhism has a good word, evil opinion.In dealing with the world, it is meaningless to draw conclusions from preset positions;It is also important to receive good logic training.
@Qingmiao Hutool has also been mentioned some loopholes that I think are relatively "low-level", or I think are not loopholes.At first, I was also very angry, but after thinking it through, I found that CVE's idea was that once you did not actively remind users that there was a pit, the user fell into the pit is your fault, that is, your vulnerability.For example, as a traffic policeman, you should remind everyone who crosses the road to pay attention to safety, and ask him to answer whether he knows. Once you don't remind someone and are hit by a car, you can't get away from it.Similarly, when using frameworks and tools, you should provide at least one parameter to remind users that there may be SQL injection vulnerabilities. Note that it is not in the comments, but in the method parameters, which is the user's responsibility.Therefore, it is not comprehensive to provide solutions in comments or documents.
That's too right.Old Zhou can't control Google, but he can control 360.Do not do to others what you do not want.All 360 products should be opened first.
Wine runs the Android emulator of Windows. Chrome OS is installed in the Android emulator. Linux environment is installed in chrome OS. Linux environment is installed in the Linux environment. Wine is installed in the Android emulator
This is also called floor washing?Does it mean that Tesla will not wash the floor if it releases all the source code?Some people HWptds?That is to say, the language is ambiguous, which will also rise to the washing ground?Are some people too focused?Think the people he pays attention to must be staring at?
Don't expect programmers to have a deep understanding of the document. I still think that since the tool hides the details of $#, some necessary security checks are necessary.Many people do not use MybatisPlus directly, but use various so-called rapid development platforms.The MyBatisPlus rapid development platform Snowy, Guns, etc., has an impression that many versions have the problem of using Wrapper directly to splice the Request parameter.I remember that JeecgBoot was opened a lot of CVEs last year or the year before last because of the Wrapper splicing problem.Do you know the author of ibeetl? Many CVE blaming holes have been opened before. The problem is similar. The lack of basic knowledge "script editing permission" is actively handed over to the front end. What a low-level error or even low-energy behavior.However, I accepted it with an open mind and added a white list check.
The world only knows that Android was created by Google. Several people know that Android is only a product acquired by Google. Similarly, what is the problem with Huawei's contribution to the collection of OGG open source work and integration into its own proprietary product line?
There is no tipping point. There are also many official documents stating that SQL fragments involving direct string splicing need to be controlled by the user, and specific solutions are also provided. If you say that the value part is injected, then we are also 100% free of any dispute. This obvious SQL fragment is unrealistic for ORM to explain without your control,Since SQL allows splicing fragments, there must be some scenarios that cannot be forced into non SQL strings. It is also very simple. Have you ever thought about why not force them???