


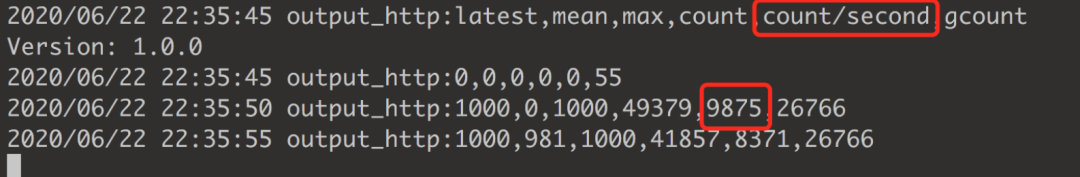
Goreplay's own statistics
Prometheus

metrics
Transformation objectives
Implementation process
Analyze the source code and find the function that sends the request in the source code; To obtain the request status code and the corresponding QPS, insert the counter metric at the position where the request return value is obtained; In order to obtain the response time of different requests and other indicators, it is necessary to record the starttime before sending the request, the endtime after returning the request, and the histogram metric of time consumption; After goreplay is started, register the metrics interface and the service listening port; The metrics service of the goreplay client is registered in the prometheus service; Establish a dashboard in grafana system to count the data indicators required;
effect
Add metrics related code to http_client.go in the source code (see the end of the text for the source code address) main.go conduct Metrics registration; Register goreplay_client metrics in the prometheus configuration file 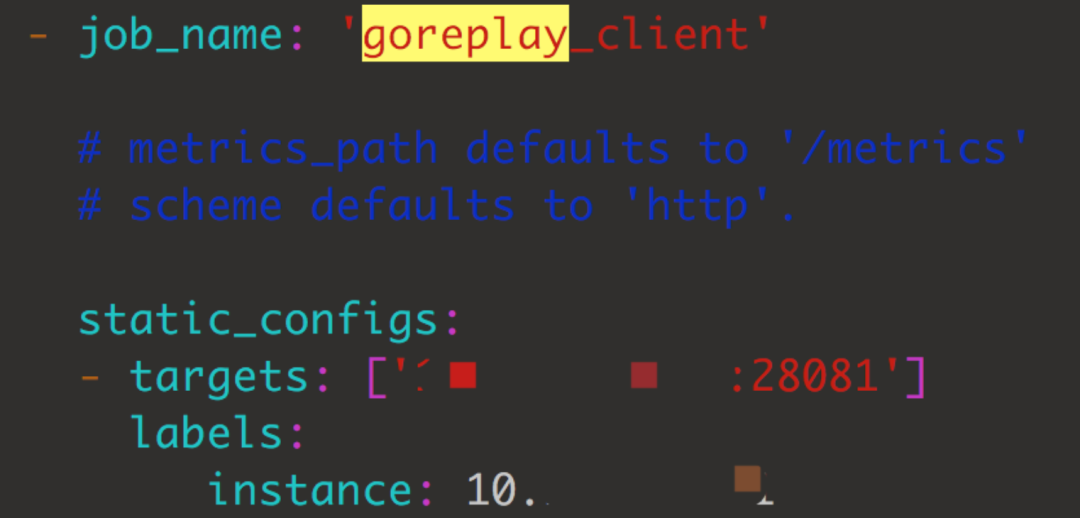
You need to add a command line when starting goreplay -output-http-compatibility-mode true Statistics based on startup results; 
When starting goreplay, check the listening port and find that there is a registered 28081 Interface access http://10.1xx.xx.xx:28081/metrics 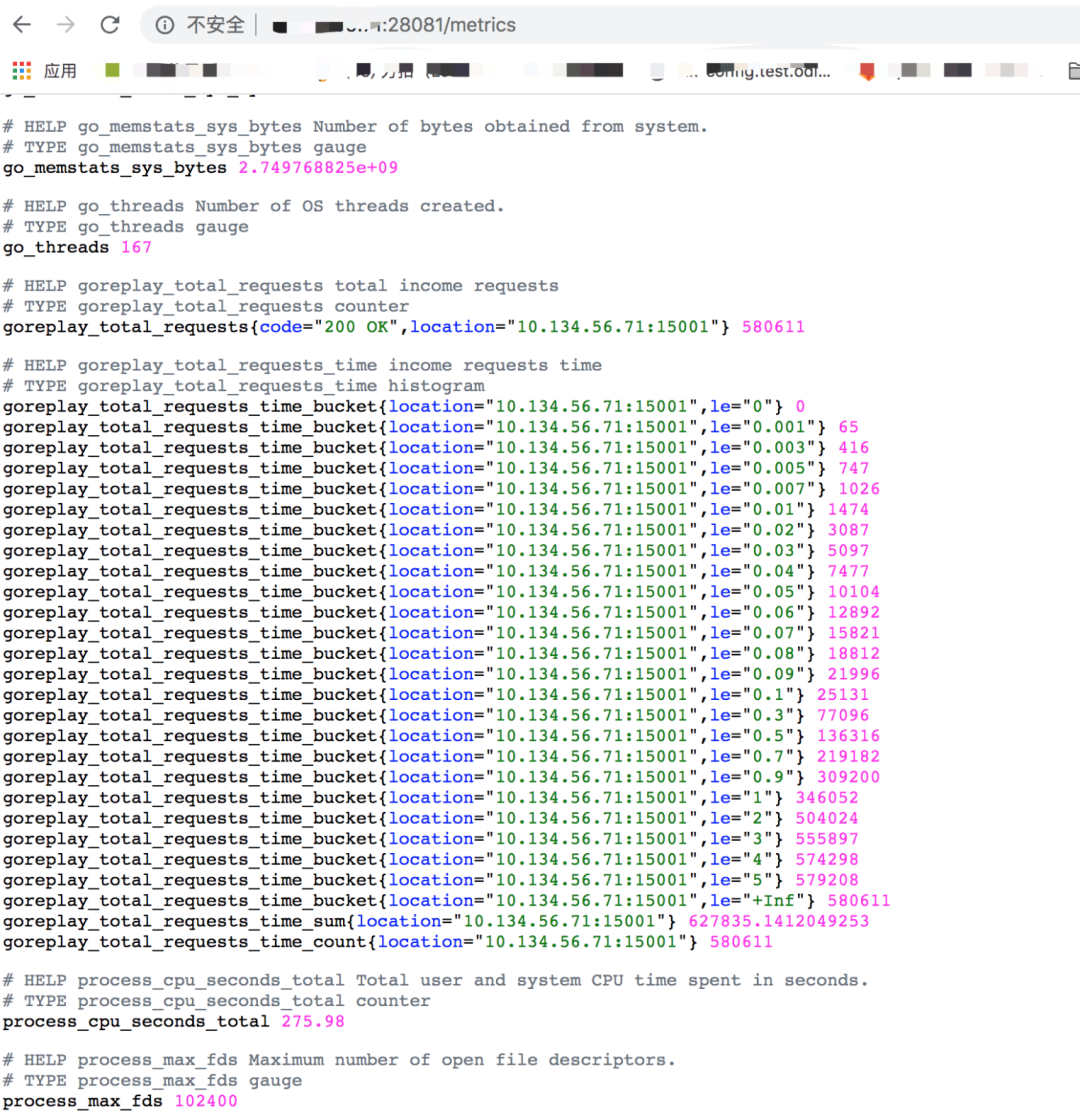
Performance test indicators required for creating a new dashboard query in grafana: 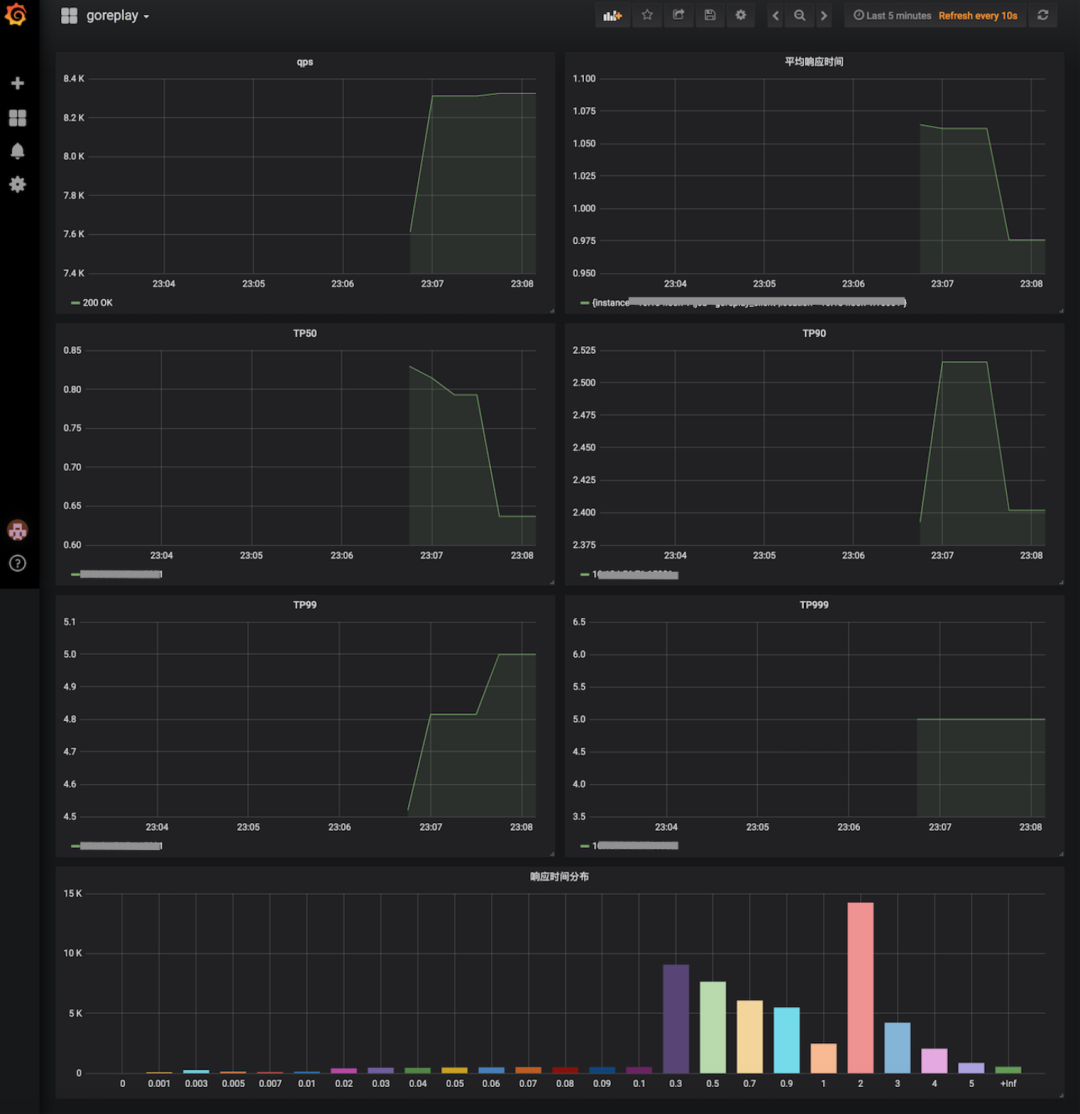
So far, the transformation of goreplay has been completed. Through metrics, various indicators in the process of pressure testing have been counted from the client;
Source code address. Since the branch submission needs to be reviewed by the goreplay author, a new project has been created on github, which can be downloaded and used https://github.com/lidedede/gor