Recommend two kinds of artifact: Solver and reflexil
Deblector
Its name is a combination of Debug and reflector. It is used for debugging. In short, it can start a debugging process like the ide, or attach to a running process, debug them, set breakpoints, step through, view variables, and so on. It does not need a pdb file, nor does it rely on the ide like the reflector pro's debugging plug-in, nor does it need to decompile the dll. All work is only done inside the reflector. Is it cool. But there is also a disadvantage, that is, it can only debug at the il level. However, this is basically enough for us to debug bugs.
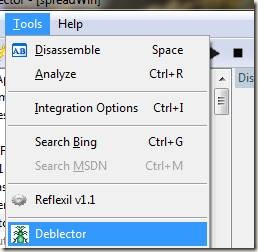
Briefly describe the usage of this plug-in. After installation in reflector, there will be an additional Solver menu under the tools menu.

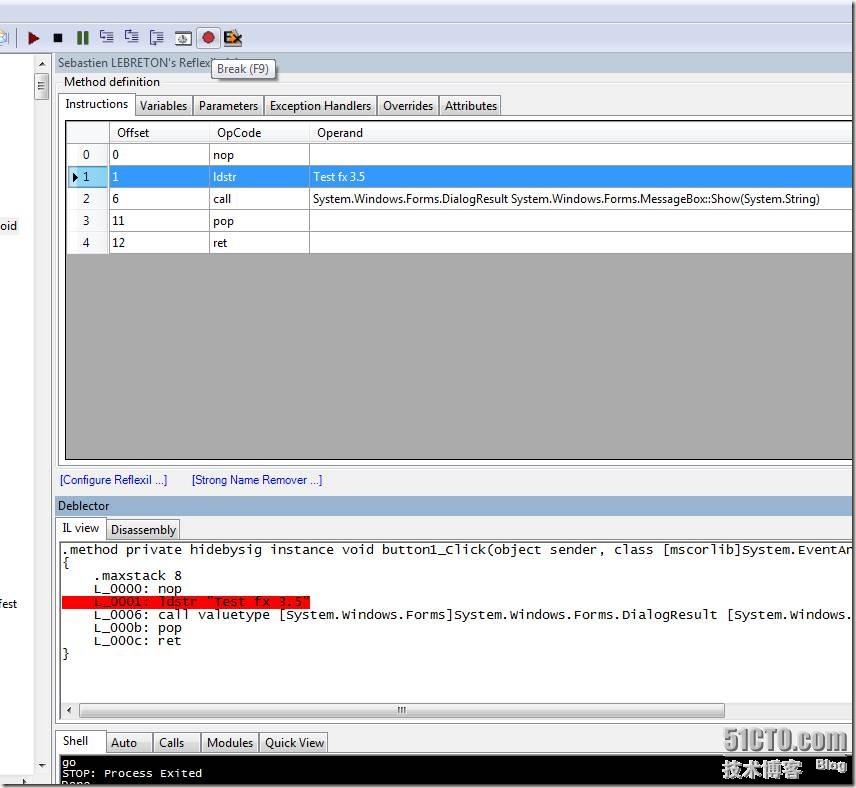
Click this menu to open the plug-in. At this time, there will be more buttons on the reflector's toolbar.

I don't want to say much about these buttons. I'll look at the tooltip myself.
If you want to start a new process for debugging, you can drag the exe to reflector, and then click the first button on the toolbar, the small triangle, to automatically start the exe and enter the debugging mode.

At this time, the process is started, but it will be stopped at the main function entrance and wait for your operation. At this time, you can find the method you want to set the breakpoint. F9 sets the breakpoint.

Then click Small Triangle or F7 to continue running the program. Then when the program reaches the breakpoint, it can be disconnected.
It should be noted here that breakpoints can only be set when the program has been disconnected, which is why the program will automatically break at the main entrance at the beginning. If you want to set a breakpoint halfway, you can click the Pause button. Pause and reset. Other functions can be played by yourself. It seems that this tool has stopped updating. I can debug 3.5 code. 4.0 seems unable to be adjusted.

reflexil
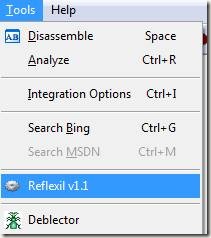
Simply put, the code of the dll can be modified and saved as a new dll. In its own words, it is called dll injection tool. It seems nothing at all. But this plug-in is very powerful. Let me briefly say that after installation, there will be this menu,

There are also different right-click menus:

When you select a method, it can display the IL code and many other information, which can be modified.

In particular, it is worth mentioning his "Replace All will Code" function. Click the meeting to display a C # code editor and the empty body of the current method, and then you can write code freely. With intelligent prompt. After writing, click Compile. Note that the code here seems to use the full name. Other codes may make mistakes and cannot be edited.

I won't mention other functions. It can modify almost any part of the dll. It also supports strong names and strong name references. If you are interested, you can try it yourself.
Welcome to share your experience.
This article is from“ Grapevine Control Blog ”Blog, please keep this source http://powertoolsteam.blog.51cto.com/2369428/472094

