
Small example: implementing calendar chart in ECharts

Step 1: Import the js file
<script src="echarts.min.js"></script> <script> // ... </script> Step 2: Specify the DOM element as the chart container.
<div id="main" style="width=100%; height = 400px"></div>
var myChart = echarts.init(document.getElementById('main')); Step 3: Configure parameters
var option = { visualMap: { show: false, min: 0, max: 1000 }, calendar: { range: '2017' }, series: { type: 'heatmap', coordinateSystem: 'calendar', data: [['2017-01-02', 900], ['2017-01-02', 877], ['2017-01-02', 699], ...] } } myChart.setOption(option);
If the chart is not displayed correctly, you can check the following possibilities:
Whether the JS file is loaded correctly; echarts Whether the variable exists; Whether the console reports errors; DOM element in echarts.init Whether there is height and width. if it is type: heatmap , check whether the visualMap 。
<! DOCTYPE html> <html> <head> <meta charset="utf-8"> <title>ECharts</title> <script src="echarts.min.js"></script> </head> <body> <div id="main" style="width:100%;height:400px;"></div> <script type="text/javascript"> var myChart = echarts.init(document.getElementById('main')); //Analog data function getVirtulData(year) { year = year || '2017'; var date = +echarts.number.parseDate(year + '-01-01'); var end = +echarts.number.parseDate(year + '-12-31'); var dayTime = 3600 * 24 * 1000; var data = []; for (var time = date; time <= end; time += dayTime) { data.push([ echarts.format.formatTime('yyyy-MM-dd', time), Math.floor(Math.random() * 10000) ]); } return data; } var option = { visualMap: { show: false, min: 0, max: 10000 }, calendar: { range: '2017' }, series: { type: 'heatmap', coordinateSystem: 'calendar', data: getVirtulData(2017) } }; myChart.setOption(option); </script> </body> </html>
Custom configuration parameters
-
range : set the time range. It can support a year, a month, a day, or cross years. -
cellSize : Set the size of the calendar grid, which can support setting different heights and widths, and also support adaptive auto. -
width 、 height : You can also directly set the overall height and width of the calendar chart to make it adaptive based on the existing height and width. -
orient : Sets the direction of the coordinates, either horizontally or vertically. -
splitLine : Set the style of the separation line, or it can not be displayed directly. -
itemStyle : Set the style of the calendar cell. You can customize the background color, box line color size type, transparency, and even add shadows. -
dayLabel : Set the week style in the coordinates. You can set the day of the week from which it starts. You can quickly set the Chinese and English, or even customize the Chinese and English mix, or do not display locally. You can display it as you want through the formatter. -
monthLabel : Set the style of the month in the coordinate. Like the week, you can quickly set the Chinese English and custom mix and match. -
yearLabel : Set the coordinate style, which is displayed for one year by default. What you want to display through the formatter text can be customized through the string function, and you can choose from the top, bottom, left, right directions.
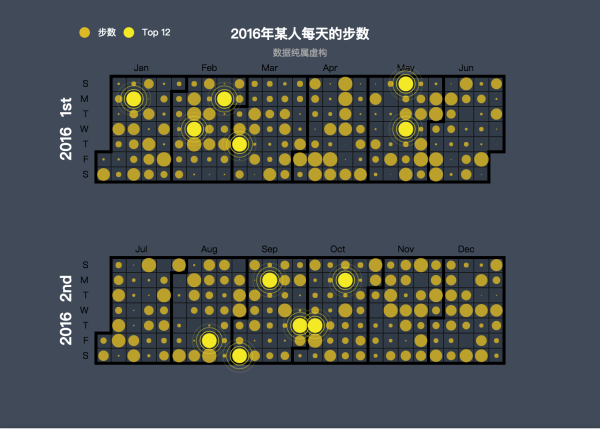
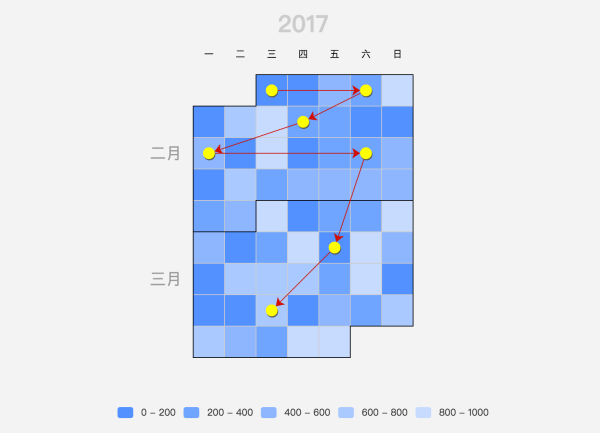
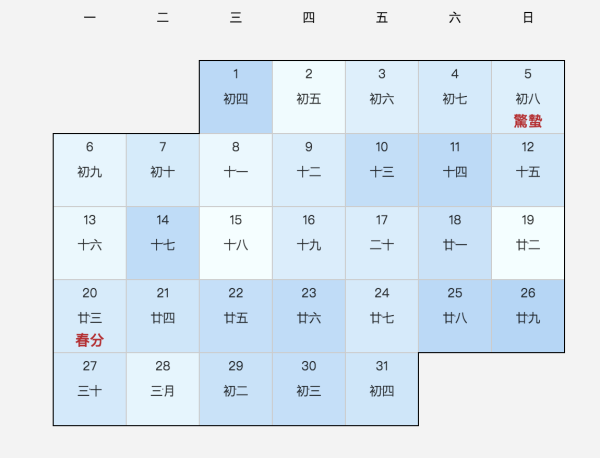
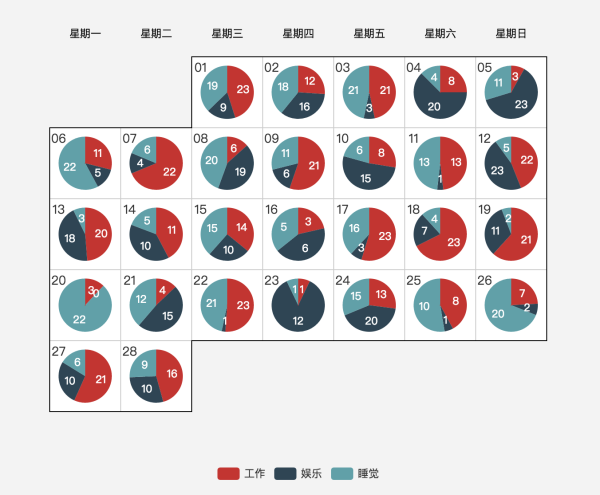
Other forms of calendar coordinate system

Summary


