stay Apache ECharts 5 Series Tutorials (2) Visual Design We learned that through the adjustment of visual design, we hope to enable readers to pay more attention to the important information in the chart. The multi state design that we will introduce next will further enable readers to participate in interaction. The richness and smoothness of interaction will enable users to better understand the relationship between data.
Interaction ability
State management
In ECharts, all series of graphics and text have two interactive states: highlighted and normal. We can set the style of graphics and text in these two states respectively.
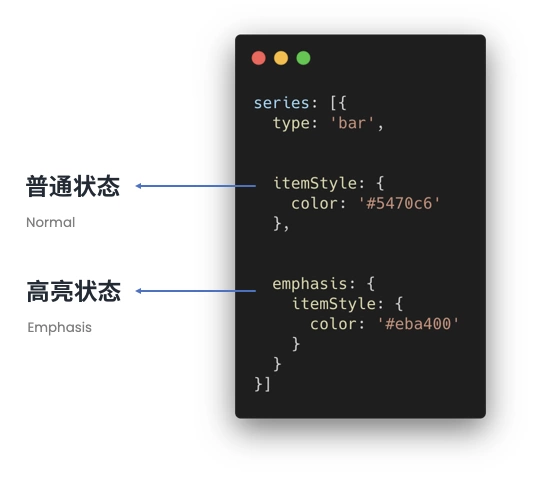
The normal state is what the chart looks like by default, while the highlighted state will be triggered to prompt the user when the mouse moves in or the legend is linked. As shown in the following figure, the highlighted state will become yellow when the mouse moves to the middle column, and will return to the normal state of blue after moving out.

In some series with richer interactions, there are more interaction states. For example, you can click to select data in a pie chart or map, and the selected graph will enter the selected status.
Or when a data is highlighted in the sunrise chart, relationship chart and Sankey chart, irrelevant data will fade out, thus achieving the effect of focusing on target data.
However, in ECharts 4 and earlier versions, the fade out and selected states are only available in some series, and the styles of these two states cannot be configured. Therefore, we often encounter such a demand. Can a histogram provide the function of clicking and selecting like a pie chart, and can you configure opacity when fading out nodes in the graph?
In order to meet these requirements, we have made a comprehensive reconstruction of state management in ECharts 5, so that all series can be provided with the interaction of clicking to select and focusing to fade out other data.
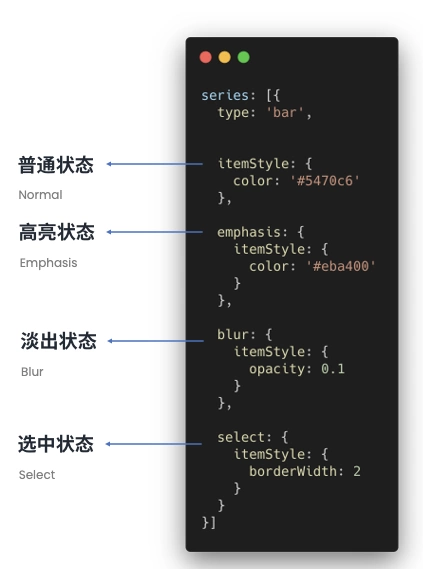
For example, the styles that can be configured in the highlighted state, such as color, shadow, border, and opacity, can be configured in both the selected state and the faded state.
Like pie chart, in other series, we can use selectedMode The configuration item enables the function of single selection and multiple selection of data. Then you can click the selected data to apply the set selected style to the selected data. In addition, we can monitor selectedchanged Event to get all the currently selected data for deeper presentation.
ECharts 5 can be set on any series focus To enable the focus fade out function of the series.
For example, when the mouse highlights a data in this histogram, other series that do not want to be closed will enter the fade out state and the set fade out style will be applied, so that the focused series can more clearly present the data contrast. Or with our new text optimization, it can also achieve the effect of focusing on the data after moving the mouse over the label.
Developers can use different focus and blurScope To flexibly configure the focus granularity. focus It is used to configure relevant focus data, such as the whole series, or only the current data. If you do not want the focus fading effect to affect the data of other coordinate systems, you need to set blurScope To limit the range of fading out. If set to global All other data in the chart will be faded out.
focus You can also specify each data that needs linkage focus more flexibly through arrays, so as to achieve richer interaction effects on the hierarchy diagram of custom series such as circle packing.
Performance improvement
Just now, we introduced the new interaction functions in Apache ECharts 5. In addition, we have also optimized the performance to ensure the smoothness of interaction.
Performance has always been an important direction of Apache ECharts. In previous versions, we introduced progressive rendering, independent highlight layer, WebGL rendering and other optimization technologies to improve the smoothness of interaction in big data. We also added SVG mode to improve the performance of mobile terminals. These technologies have their own advantages and disadvantages and their applicable scenes.
In 5, we will introduce a new technology—— Dirty rectangle rendering To improve the interaction performance of Apache ECharts 5 more comprehensively.
Dirty rectangle rendering
Before understanding dirty rectangle rendering, we need to have a rough understanding of how ECharts renders a chart.
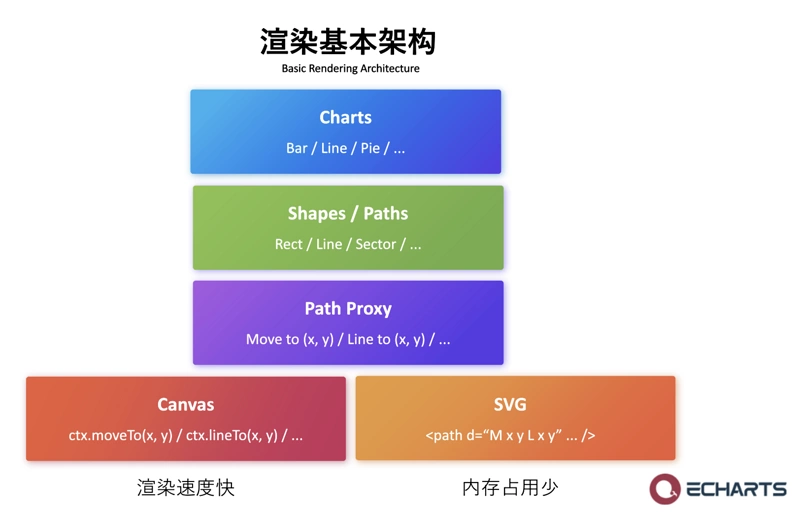
We provide various chart types externally, such as column chart, line chart, pie chart, etc. These chart types will be disassembled into different graphs, such as column chart composed of multiple rectangles, line chart composed of multiple line segments, pie chart composed of multiple sectors, etc. These figures will be further disassembled into path operations such as drawing lines and arcs. In order to ensure the simplicity and consistency of the upper layer drawing interface, we use a layer of proxy to isolate the path operation and the implementation of different rendering engines on the bottom layer. Finally, to the browser graphic interface layer, Canvas will call the corresponding drawing instructions, and SVG will update the DOM to do the final drawing.
Canvas has the advantage of fast redrawing, so it is suitable for large amounts of data. SVG has the advantage of low memory consumption and is more suitable for mobile terminals. Our new dirty rectangle optimization is intended to further improve Canvas's big data volume redrawing performance. Provide more smooth interaction experience for more scenes.
For the Canvas rendering engine, ECharts will redraw the entire canvas when the graph changes due to mouse hover highlighting. That is, erase the entire canvas, and then paint all the elements in turn. This method is simple and reliable, and can maintain very smooth interaction when there are hundreds or even thousands of graphics.
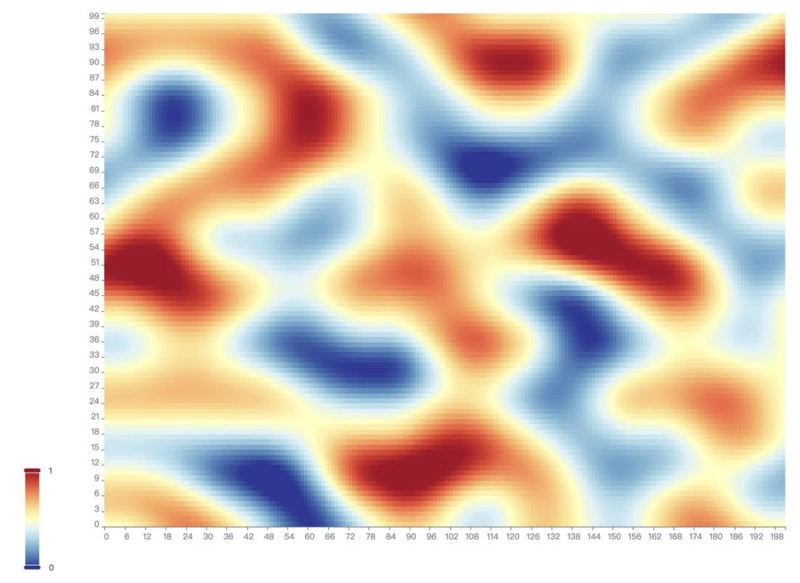
However, if there are more graphics, such as a heat map with tens of thousands of graphics, because the time for redrawing each frame is too long, interaction may be stuck.
In previous versions, we used an additional Canvas layer as the highlight layer to solve the problem of rendering performance. That is, the shape changed by mouse highlighting is placed in a separate layer for rendering. This method is very simple and crude to solve the interaction fluency under big data.
However, it is not a silver bullet, and there are also some problems.
First, this extra Canvas layer will cause additional memory consumption; Secondly, because this algorithm does not erase the original elements, it is not suitable for complex style changes, such as opacity or shadow changes that will be exposed. In addition, some platforms are not suitable for multi-layer Canvas overlay, such as Node.js or applet.
Therefore, in ECharts 5, we introduced a more general technical solution, dirty rectangle rendering, to remedy these problems. By only erasing and redrawing the modified part of the screen each time, the redrawn graphics can be reduced and the interaction fluency can be improved.
The opening of the dirty rectangle is very simple. You only need to init Set the useDirtyRect The parameter is set to true Just do it.
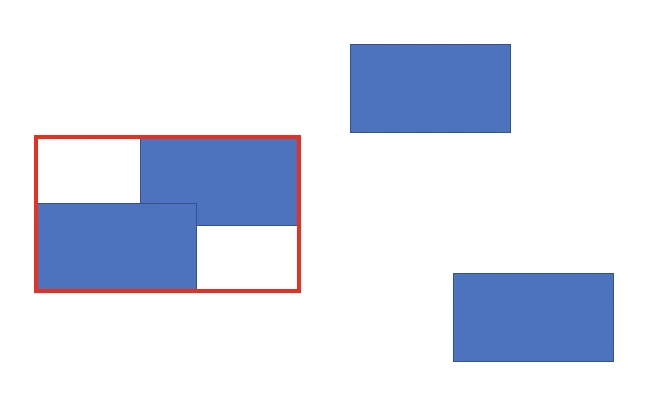
First, let's use a very simple example to see how dirty rectangles can improve redrawing performance. Suppose there are four rectangles in the picture.
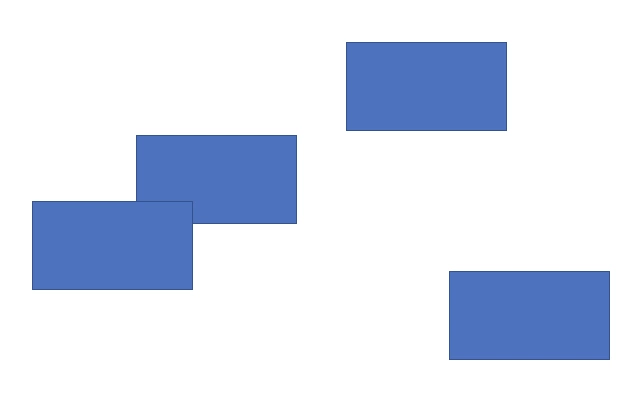
Two of them now change color, so they need to be redrawn.
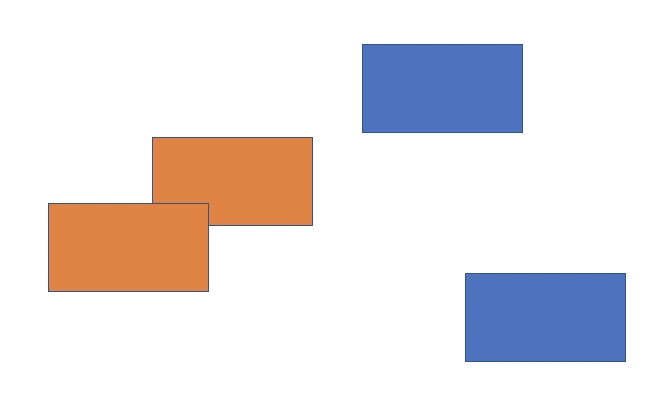
ECharts will track the two changed shapes, calculate the bounding box, get the area to be updated, and erase the redrawn area.
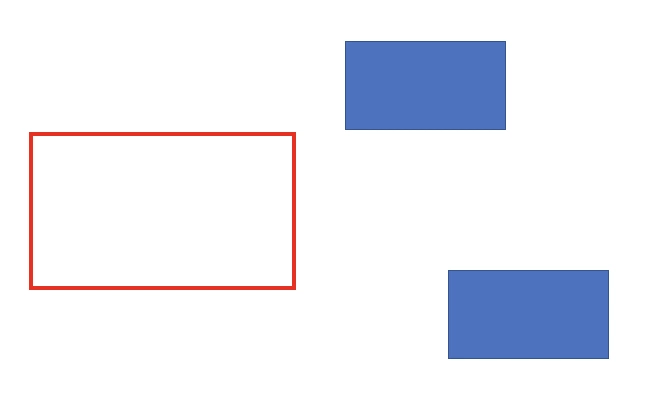
Then, within this range, draw the elements in the redraw area in turn. In this way, only the two changes need to be drawn to get the updated picture.
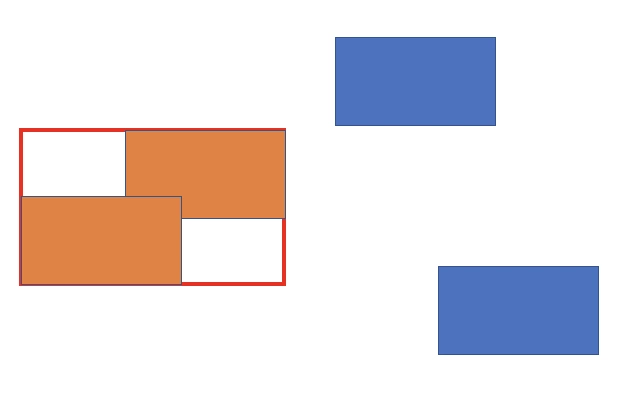
If there are many elements in the picture and only a few have changed, dirty rectangle rendering can effectively reduce the content that needs to be redrawn each time.
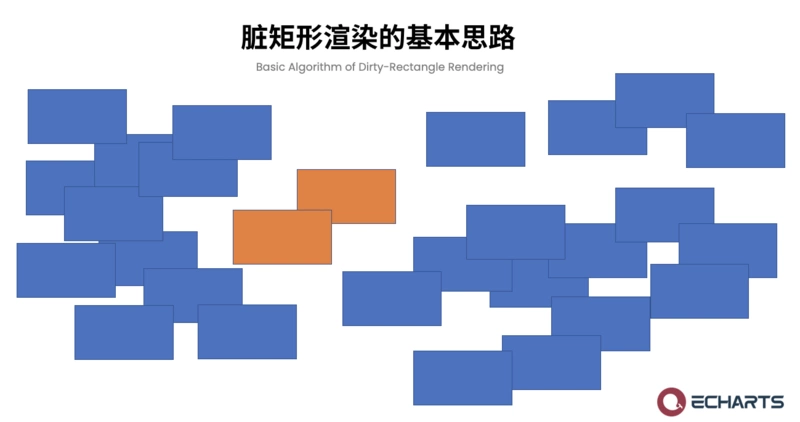
Of course, this is just the simplest demonstration. The actual scene processed by the algorithm will be more complex. We have done a lot of work to ensure the correctness and efficiency of the dirty rectangle algorithm in each scene.
Let's look at the application of dirty rectangles in the actual scene. You can easily see the effect by selecting Enable dirty rectangle optimization in the rendering settings on our new sample page.

This is an example of drawing a pie chart on the calendar every day. The red box marks the contents of each redraw. During interaction, only one pie chart is redrawn each time, and the efficiency of redrawing is also greatly improved.
In addition, most modern browsers now only redraw and composite the changed parts of the screen through the dirty rectangle technology, which further improves our redrawing performance. The green box below represents the redrawn area in Chrome.
Finally, we use an example to visually see the performance improvement brought by dirty rectangles.
This is a complex rectangular tree with shadow and translucent effect. When the mouse is moved over the graph, there will be an upward animation effect of enlarged shadow. When the dirty rectangle is closed, the animation is very stuck, with only 10 frames on average, which has seriously affected the smoothness of the entire interaction. A large number of red frames at the bottom of the figure indicate that the animation has seriously blocked the entire page.
After enabling the dirty rectangle, the number of frames has been greatly improved. Although there are a few stutters in the middle, the overall interaction has been very smooth.
The application of dirty rectangle rendering in ECharts 5 is introduced above. If you encounter performance problems in your complex charts, you can try to turn on our dirty rectangle rendering.
Line chart optimization
In ECharts, the line chart is often used to visualize real-time timing data such as CPU and memory. These data are often updated with high frequency. They need to be updated every few hundred milliseconds or even tens of milliseconds, and the amount of data updated every time is often large. Previously, ECharts' broken line graph was not very good at optimizing such high frequency and large amount of data, so developers often reported that the update and redrawing of the broken line graph would get stuck, and the memory usage was high.
Therefore, in ECharts 5, we have made centralized optimization for the line graph to reduce the memory consumption and initialization time.
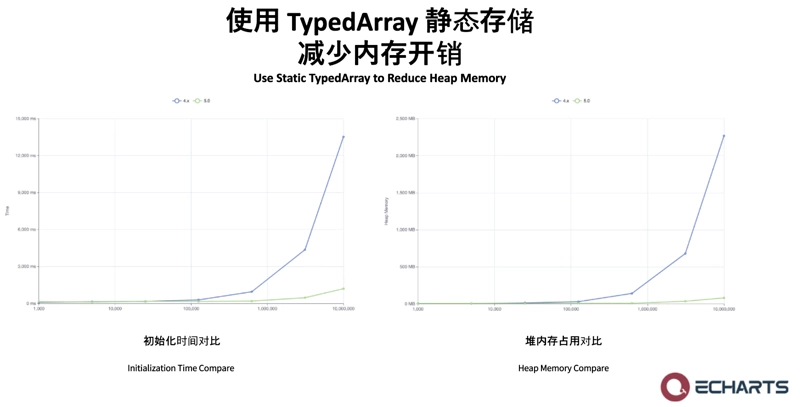
We changed the storage of internal graphic data from the original dynamic array to the use of TypedArray To do static storage, which can significantly reduce the heap memory occupation and garbage collection time of the browser, and further effectively reduce the initialization cost. From these two figures, we can see that this optimization will increase the initialization time and memory occupation more significantly when the data volume is larger, and can reach 10x or more at the level of millions of data.
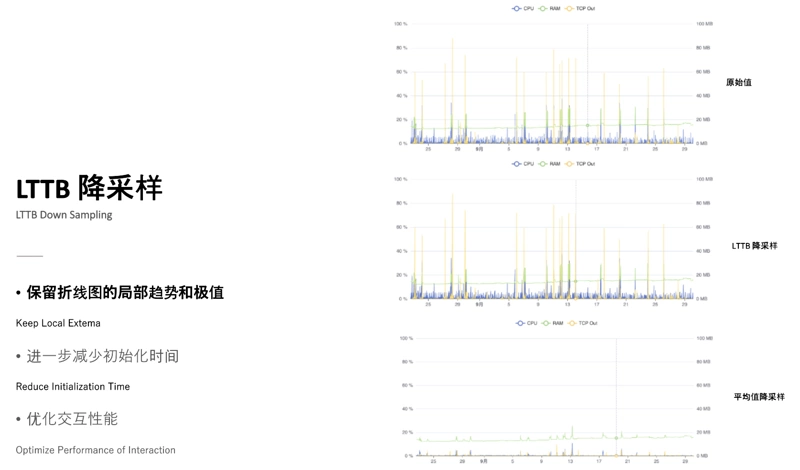
At the same time, we also added the LTTB algorithm to the original downsampling function. The LTTB algorithm can reduce the number of points that need to be drawn to only a few thousand on the premise of retaining the local trend and extreme value of the line chart, thus further reducing the initialization time of the line chart. However, the original downsampling strategies such as average and maximum will lose too much data information.
In addition, with a series of detailed performance tuning of internal code and the browser's JIT, ECharts can complete the data update and re rendering within 30ms for millions of data, so as to meet the requirements of real-time update.
Of course, these performance improvements are not only for time series data. All types of large data volume line graphs can benefit from performance optimization.
For more extreme scenes with 10 million data, ECharts can render a line graph with 10 million data in 0.76s, with a memory occupation of only 370MB, and can still perform interactions such as tooltip smoothly at a frame rate of 60fps.
You may not encounter such extreme data in your own applications, but I believe that the optimized effect can make you more proficient in implementing big data line graphs with ECharts.
other
In addition to user experience, we also attach great importance to the experience of developers. In the next article, we will introduce the efforts of Apache ECharts 5 in improving the developer experience.