Recently, ECharts released its 100th version on GitHub!

Background color of bar in bar chart
In the past, many partners who needed to "add background colors to the bars of the bar graph" solved the problem by adding an additional series to the bottom.
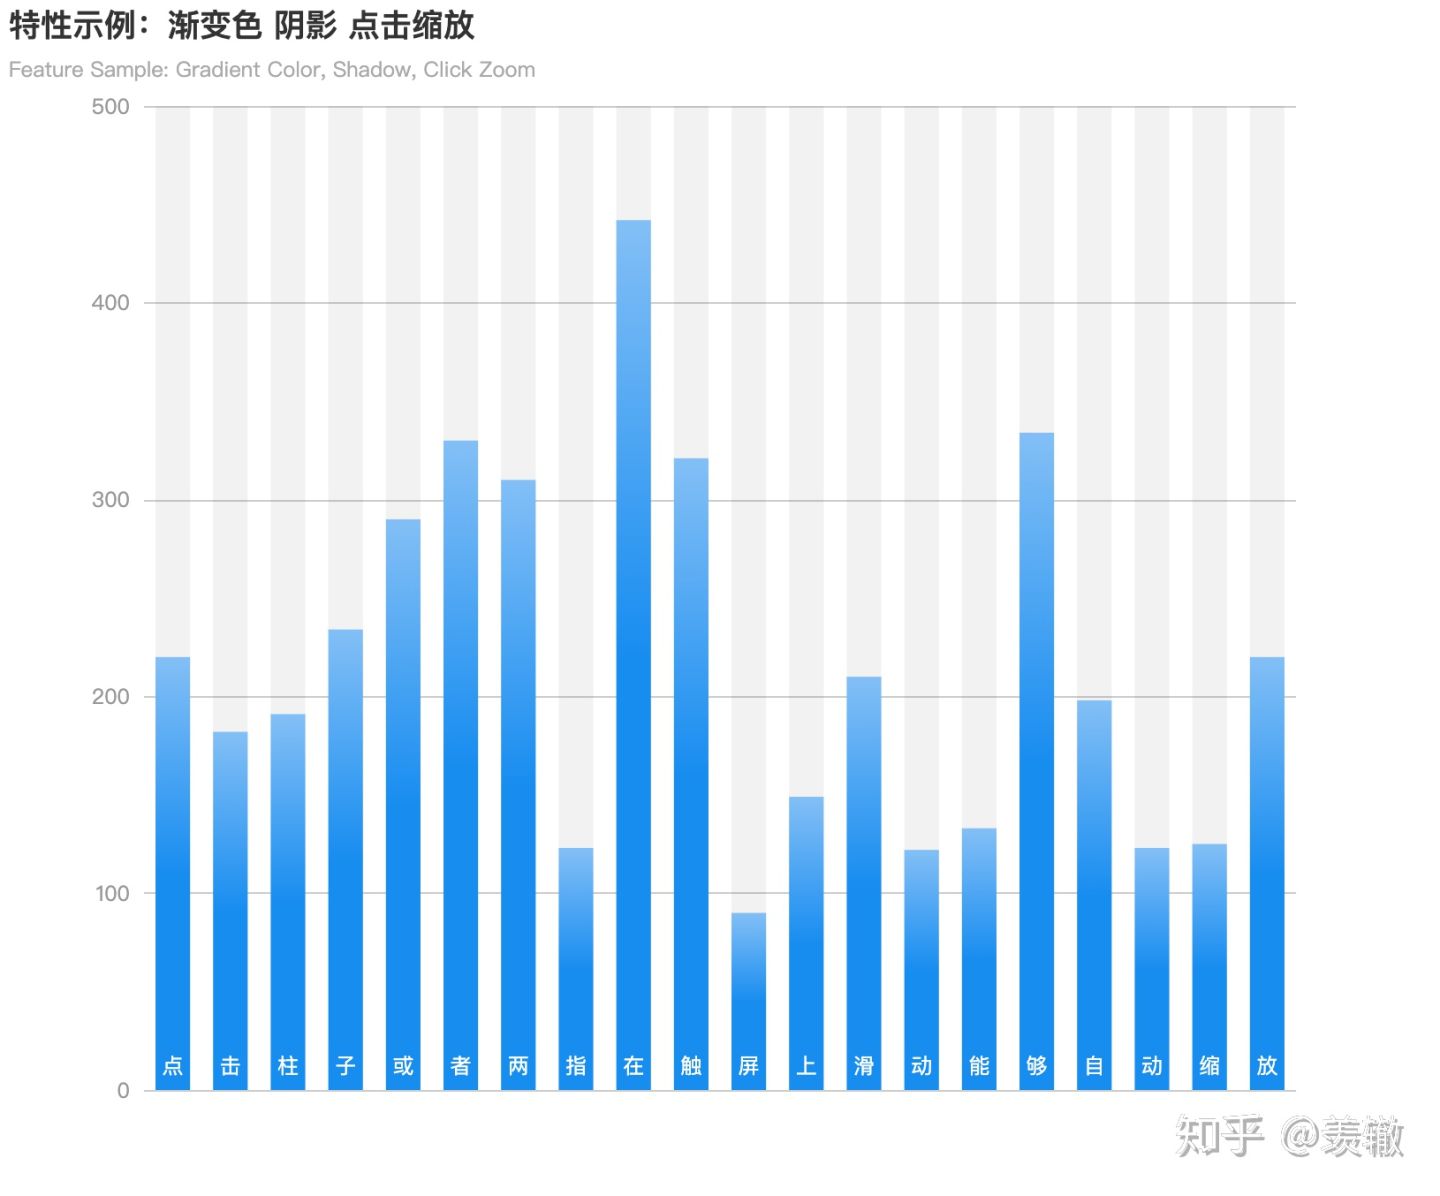
This method is troublesome to write, and it is difficult to think of such a solution if you are not proficient in ECharts. Because of such requirements, in v4.7.0, we support the configuration item of background color, which is enabled by one click of showBackground. If you need to configure the style, you can modify the default background color through backgroundStyle, and even set shadows, borders, transparency, etc.
With this method, the background color effect of the histogram can be easily realized.
In addition, the configuration of the background color is also applicable to the column chart (that is, the ring chart) in the polar coordinate system, so it can be used to achieve the ring chart effect in the promotional pictures in this article:

option = { angleAxis: { show: false }, radiusAxis: { Data: ['Monday ',' Tuesday ',' Wednesday ',' Thursday '], show: false }, polar: {}, visualMap: { show: false, min: 4, max: 10, inRange: { color: ['rgba(255, 87, 51, 0.8)', 'rgba(199, 0, 57, 0.8)', 'rgba(144, 12, 62, 0.8)', 'rgba(87, 24, 69, 0.8)'] } }, series: [{ type: 'bar', data: [4, 6, 8, 10], showBackground: true, roundCap: true, coordinateSystem: 'polar' }] };
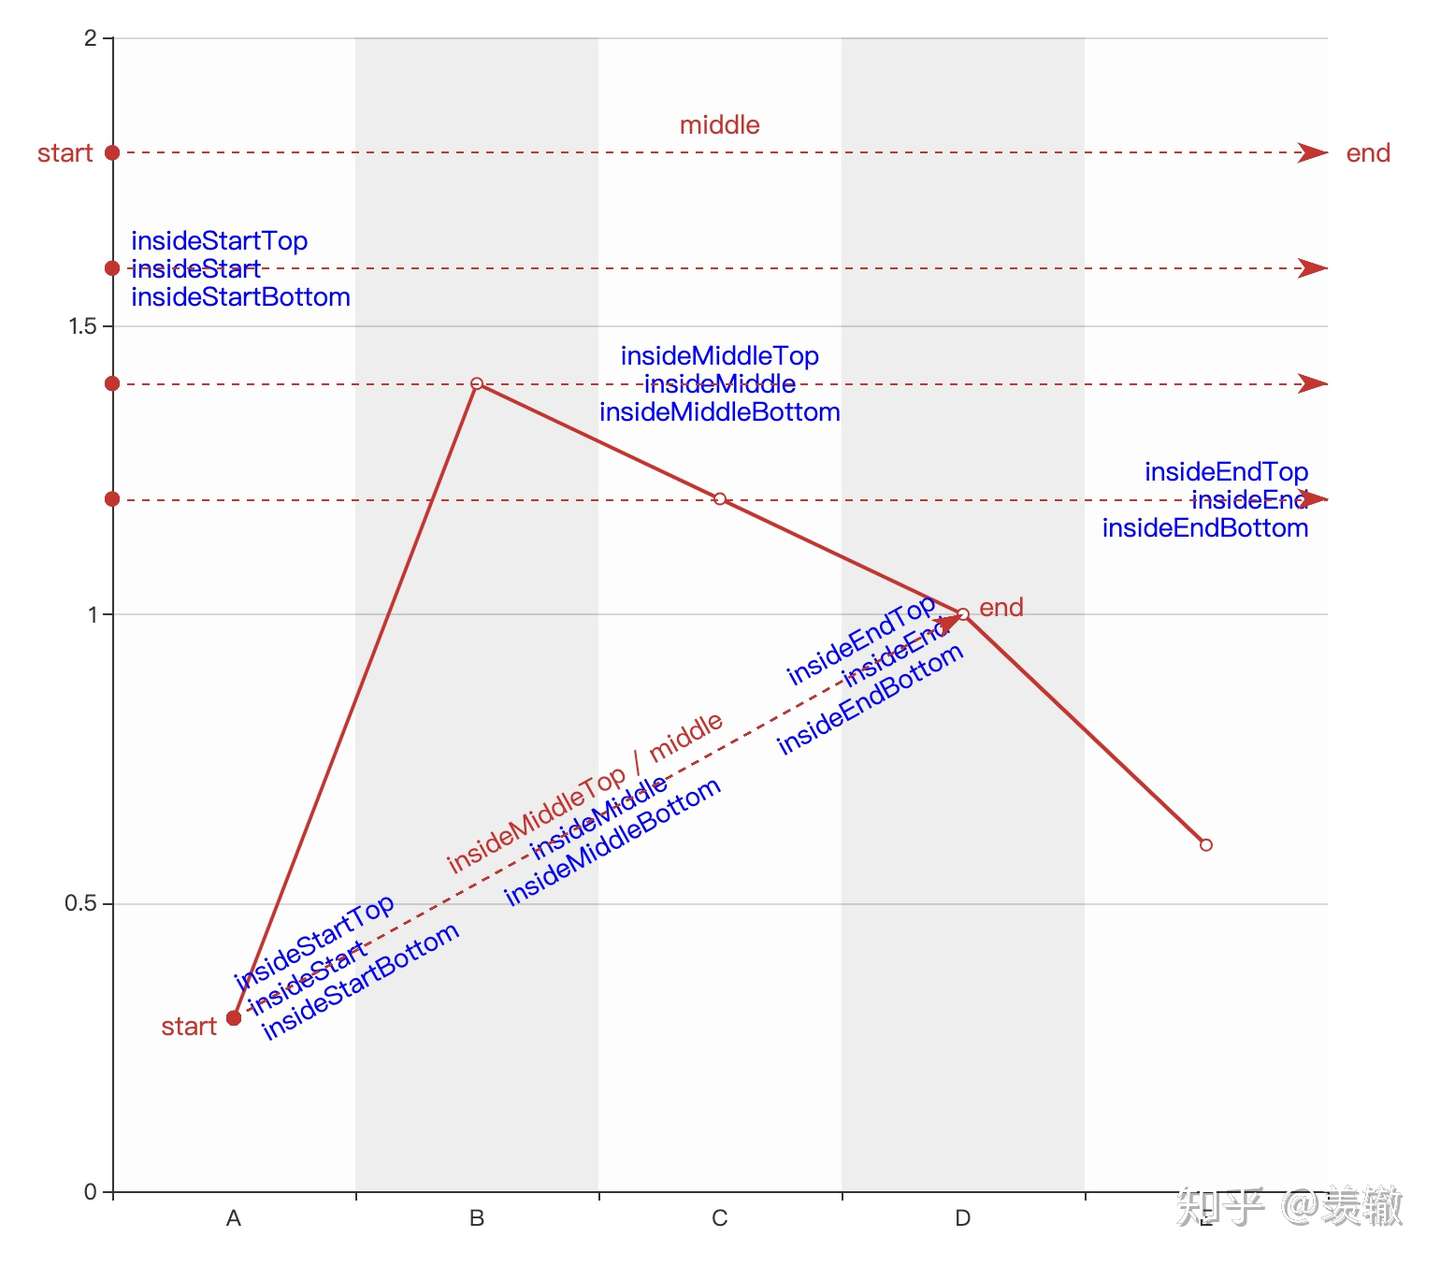
Add multiple markLine label positions
ECharts markLine can mark data.

Previously, the label position only supported start (displayed on the left side of the marked line), middle (above the line), and end (on the right side of the line). In order to meet the label positions of more scenes, in v4.7.0, 9 new label positions have been added (the blue part in the figure below):
Add a broken line layout for the tree chart
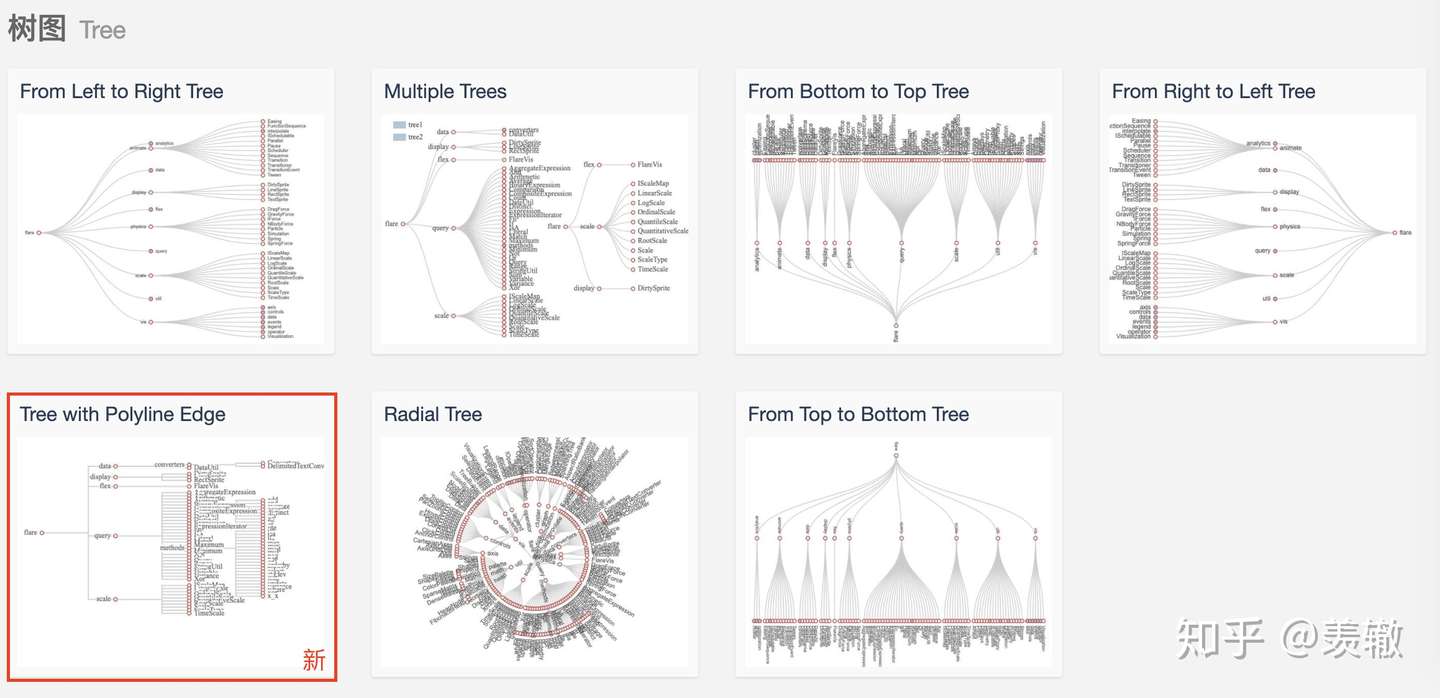
Now, you can use curve or polyline layout through edgeShape configuration to create more visualizations of tree graphs.
Complete Changelog
[Feature] markLine adds more label position configurations #11843 (Zhang Wenli)
[Feature] New background configuration drawing background for histogram series #11951 (Zhang Wenli)
[Feature] tooltip Add an appendToBody configuration item #8049#12024 (xinpureZhu, Su Shuang)
[Feature] graphic component supports setting draggable. # 11959 on group element (Shen Yi)
[Feature] The tree series adds a polyline configuration item to draw corner polylines #11808 (Li Deqing)
[Enhance] EffectLine wake effect optimization #11893 (alex2wong)
[Fix] Optimize the positioning of markPoint on the stack histogram and line chart #11965 (yikuangli)
[Fix] Fix the problem that radar map data points may exceed the axis #11841 (Su Siwen)
[Fix] Fix the problem that treemap highlight cannot be triggered #12050 (Su Shuang)
[Fix] Fix the problem that the zoom and translation of geo components cannot be restored #12035 (Su Shuang)
[Fix] Fix the problem # 11956 (Shen Yi) that the map reported errors in ie10, 11
[Fix] Fix the bug # 12027 (Su Shuang) that may be reported by the k-line diagram
[Fix] Optimize the brush component to follow the interaction of dataZoom and other components #11998 (Su Shuang)
[Fix] Repair 'showTip' distributed in radar chart. # 11985 (Yu Feng)
[Fix] Fix the problem that splitArea cannot be drawn in singleAxis #11890 (newraina)
[Fix] Fix bug # 11952 (Yu Feng) that may disappear with the legend page turning button
[Fix] Fix the bug # 11729 (Li Deqing) that the emphasis.lineStyle in sankey's Sankey diagram cannot take effect
[Fix] Fix bug # 11752 (Li Deqing) without value attribute in the tooltip formatter of sankey sankey