
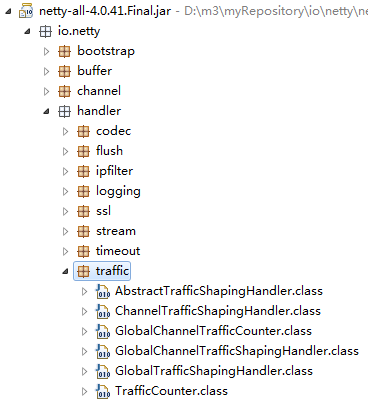
ChannelPipeline p = socketChannel.pipeline(); p.addLast(new GlobalTrafficShapingHandler(Executors.newScheduledThreadPool(1), 1000));
/** * @return the Read Throughput in bytes/s computes in the last check interval. */ public long lastReadThroughput() { return lastReadThroughput; } /** * @return the Write Throughput in bytes/s computes in the last check interval. */ public long lastWriteThroughput() { return lastWriteThroughput; } /** * @return the number of bytes read during the last check Interval. */ public long lastReadBytes() { return lastReadBytes; } /** * @return the number of bytes written during the last check Interval. */ public long lastWrittenBytes() { return lastWrittenBytes; } /** * @return the current number of bytes read since the last checkInterval. */ public long currentReadBytes() { return currentReadBytes.get(); } /** * @return the current number of bytes written since the last check Interval. */ public long currentWrittenBytes() { return currentWrittenBytes.get(); } /** * @return the Time in millisecond of the last check as of System.currentTimeMillis(). */ public long lastTime() { return lastTime.get(); } /** * @return the cumulativeWrittenBytes */ public long cumulativeWrittenBytes() { return cumulativeWrittenBytes.get(); } /** * @return the cumulativeReadBytes */ public long cumulativeReadBytes() { return cumulativeReadBytes.get(); } /** * @return the lastCumulativeTime in millisecond as of System.currentTimeMillis() * when the cumulative counters were reset to 0. */ public long lastCumulativeTime() { return lastCumulativeTime; } /** * @return the realWrittenBytes */ public AtomicLong getRealWrittenBytes() { return realWrittenBytes; } /** * @return the realWriteThroughput */ public long getRealWriteThroughput() { return realWriteThroughput; }
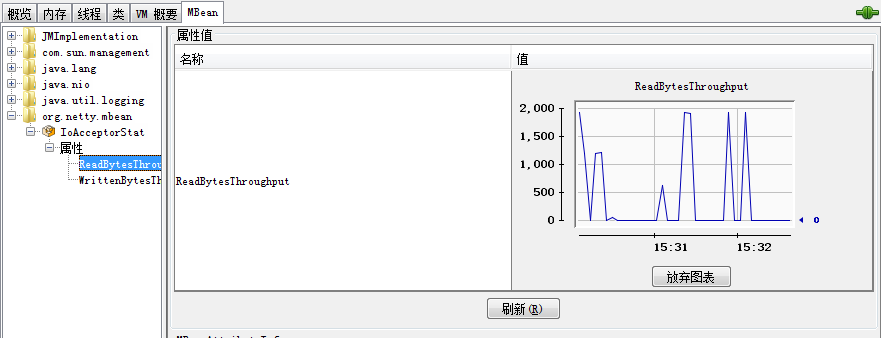
public interface IoAcceptorStatMBean { public long getWrittenBytesThroughput(); public long getReadBytesThroughput(); }
public class IoAcceptorStat implements IoAcceptorStatMBean { @Override public long getWrittenBytesThroughput() { return SocksServer.getInstance().getTrafficCounter() .lastWriteThroughput(); } @Override public long getReadBytesThroughput() { return SocksServer.getInstance().getTrafficCounter() .lastReadThroughput(); } }
MBeanServer mBeanServer = ManagementFactory.getPlatformMBeanServer(); IoAcceptorStat mbean = new IoAcceptorStat(); try { ObjectName acceptorName = new ObjectName(mbean.getClass().getPackage().getName() + ":type=IoAcceptorStat"); mBeanServer.registerMBean(mbean, acceptorName); } catch (Exception e) { e.printStackTrace(); }