Open Java VisualVm ->Tools ->Plug ins, as shown in the figure:
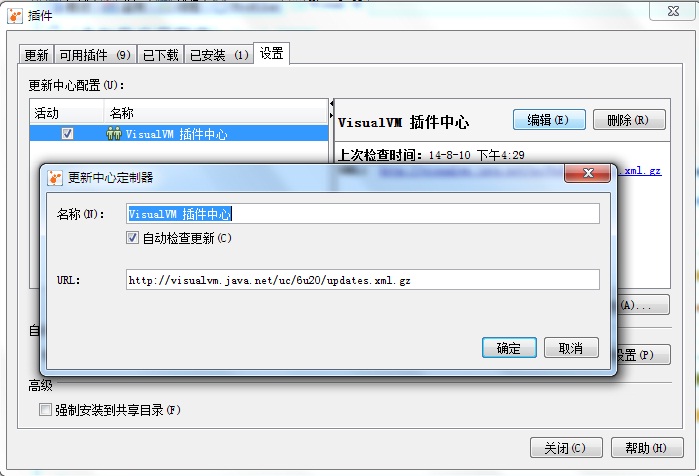
About the URL to fill in http://visualvm.java.net/pluginscenters.html Find the plug-in center address corresponding to the jdk version and the updated version.
When VisualVM cannot download the plug-in, check whether there is a problem with the address above.
Common extensions:
Visual GC : Monitor the time required for each part to facilitate our tuning

jconsole plugins
After installation, the following configurations are required:

In the place where jconsole plugins are configured, add JAR/Folder, and select JDK_HOME/demo/managemnt/JTop/jtop.jar
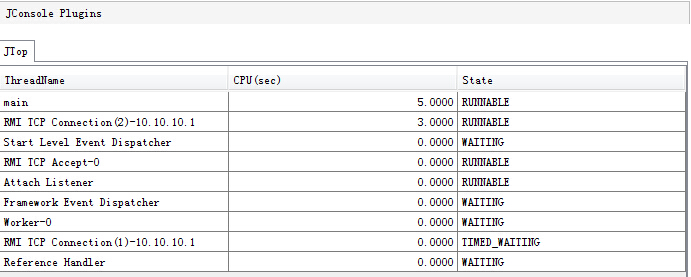
JTop is used to show the top thread of the specified process (calculated by the CPU usage time), which is very useful when making some profilers. We can also refer to the source code of jtop and write our own implementation
MBean Plug in