Use OSS data as machine learning training samples
background information
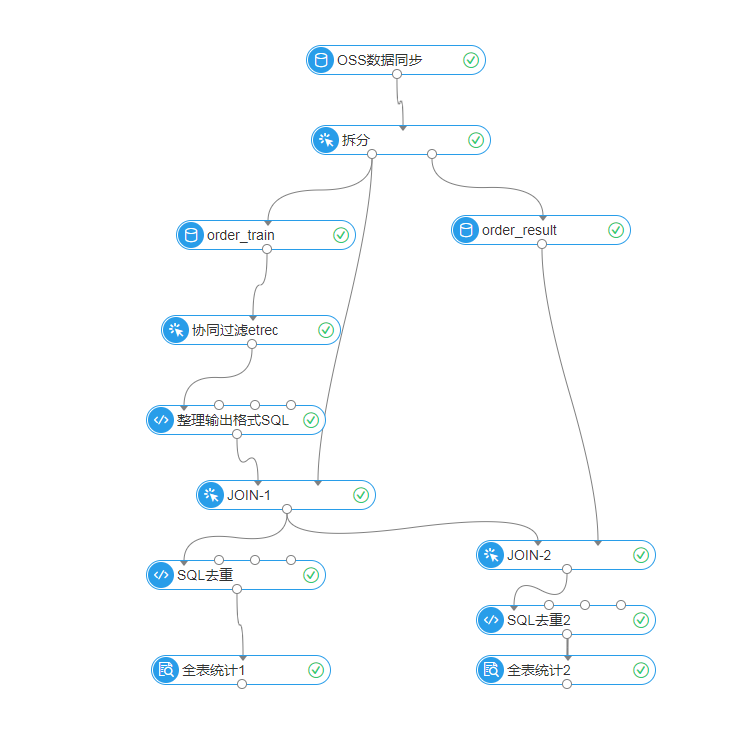
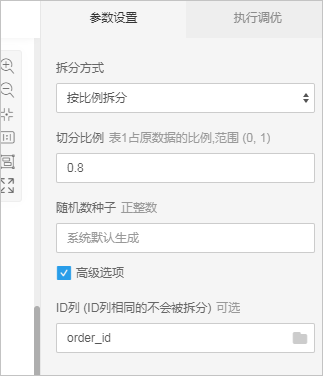
Operation steps
Upload data to Bucket。 Take the uploaded file as Sample_superstore.csv, Upload to East China 1. Target storage space in Hangzhou examplebucket Take for example. structure Sample_superstore.csv Sample file data. order_id,order_date,customer_id,item,sales,quantity 1,20240101,1, aa,10,100 take Sample_superstore.csv File upload to examplebucket。 See Simple upload 。
connected OSS and PAI。 In East China 1. New workflow in Hangzhou region. See New Custom Workflow 。 Click the new workflow, and then select 。 Double click read CSV File component, read on the right CSV Of the file component panel Parameter setting Tab, File Path Set to oss://examplebucket/Sample_superstore.csv , Schema Set to order_id string,order_date string,customer_id string,item string,sales string,quantity string , Open Whether to ignore the first row of data Switch and other parameters remain the default configuration. Right click to read CSV File component, and then click Execute this node 。 After the execution is completed, right-click Read CSV File component, and then click 。 Under the component, view the table information. Data preview is only supported one thousand Records. If you need to view the full table, please follow the instructions on the page DataWorks。
Data exploration process
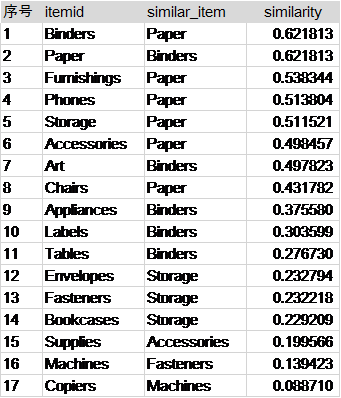
conclusion
The paper and stapler shelves are placed in the middle, and the shelves of other products are placed in a ring around the two, so that no matter which shelf customers enter from, they can quickly find the paper and stapler with a high degree of correlation. Place the paper and stapler shelves at both ends of the stationery store. Customers need to cross the entire stationery store to buy the other one. Passing the shelves of other products halfway can improve the cross purchase rate. Of course, this layout method sacrifices the convenience of users' shopping, and should be cautious in actual operation.