Data visualization Sugar BI
-
Product Functions -
Product advantages -
Product selection -
Version comparison -
Application scenarios -
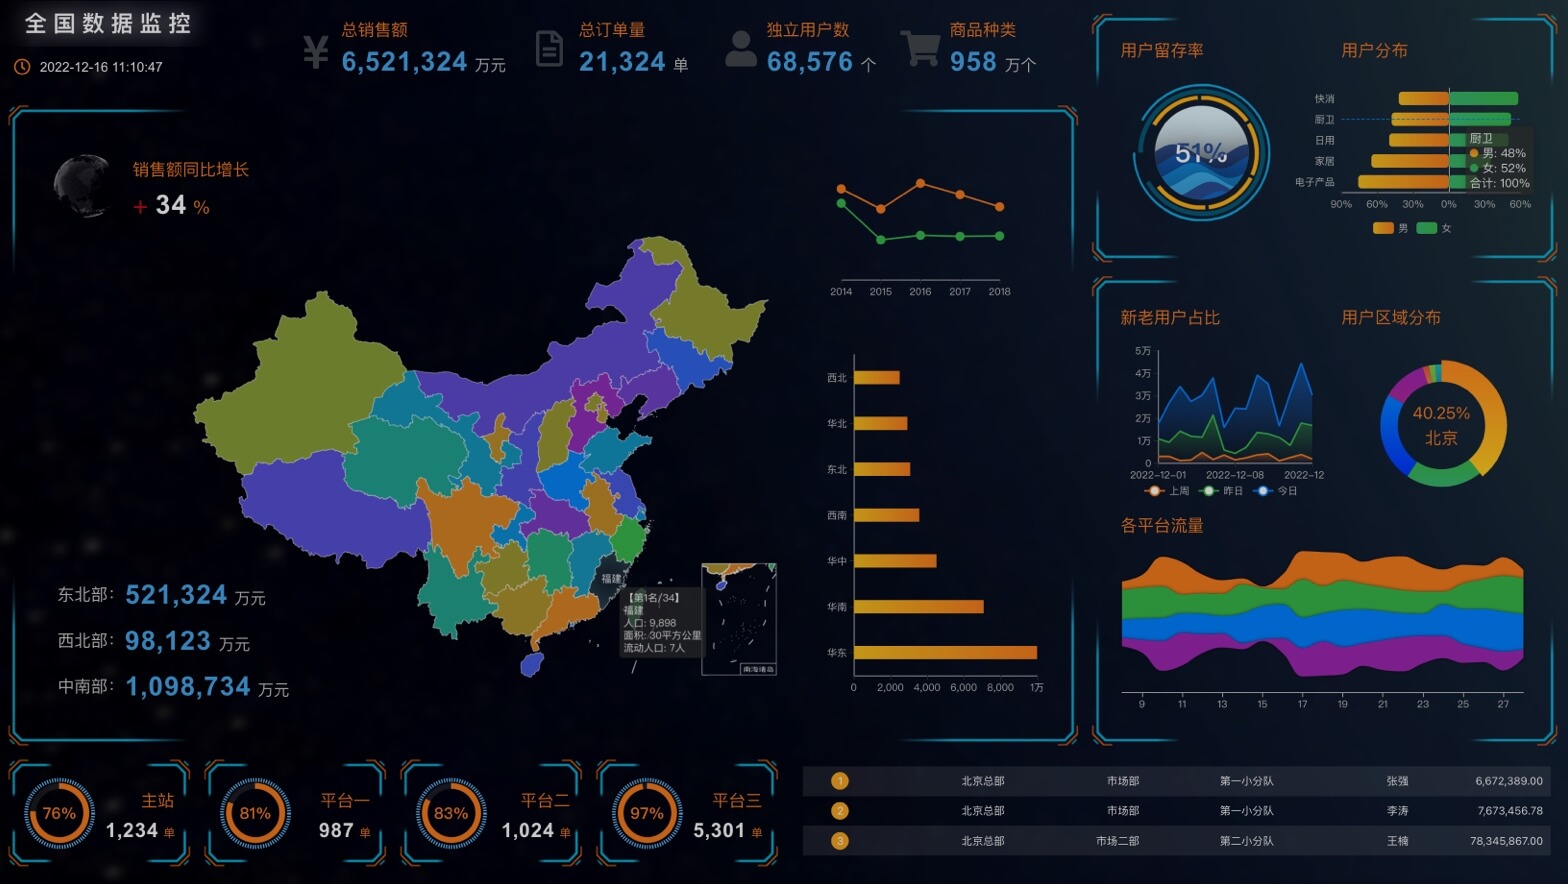
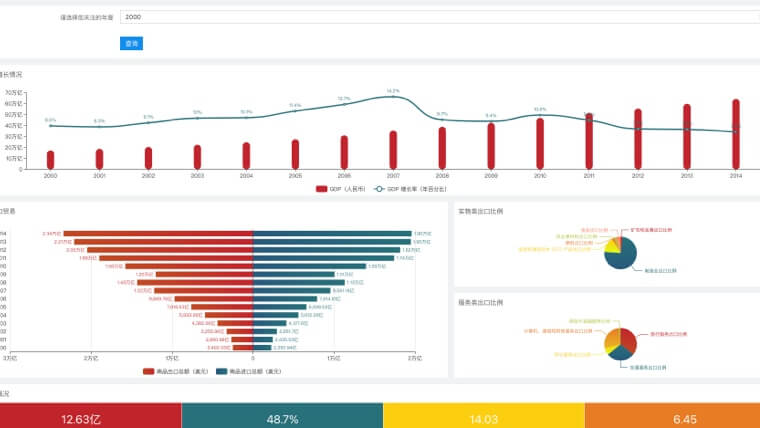
Large screen example -
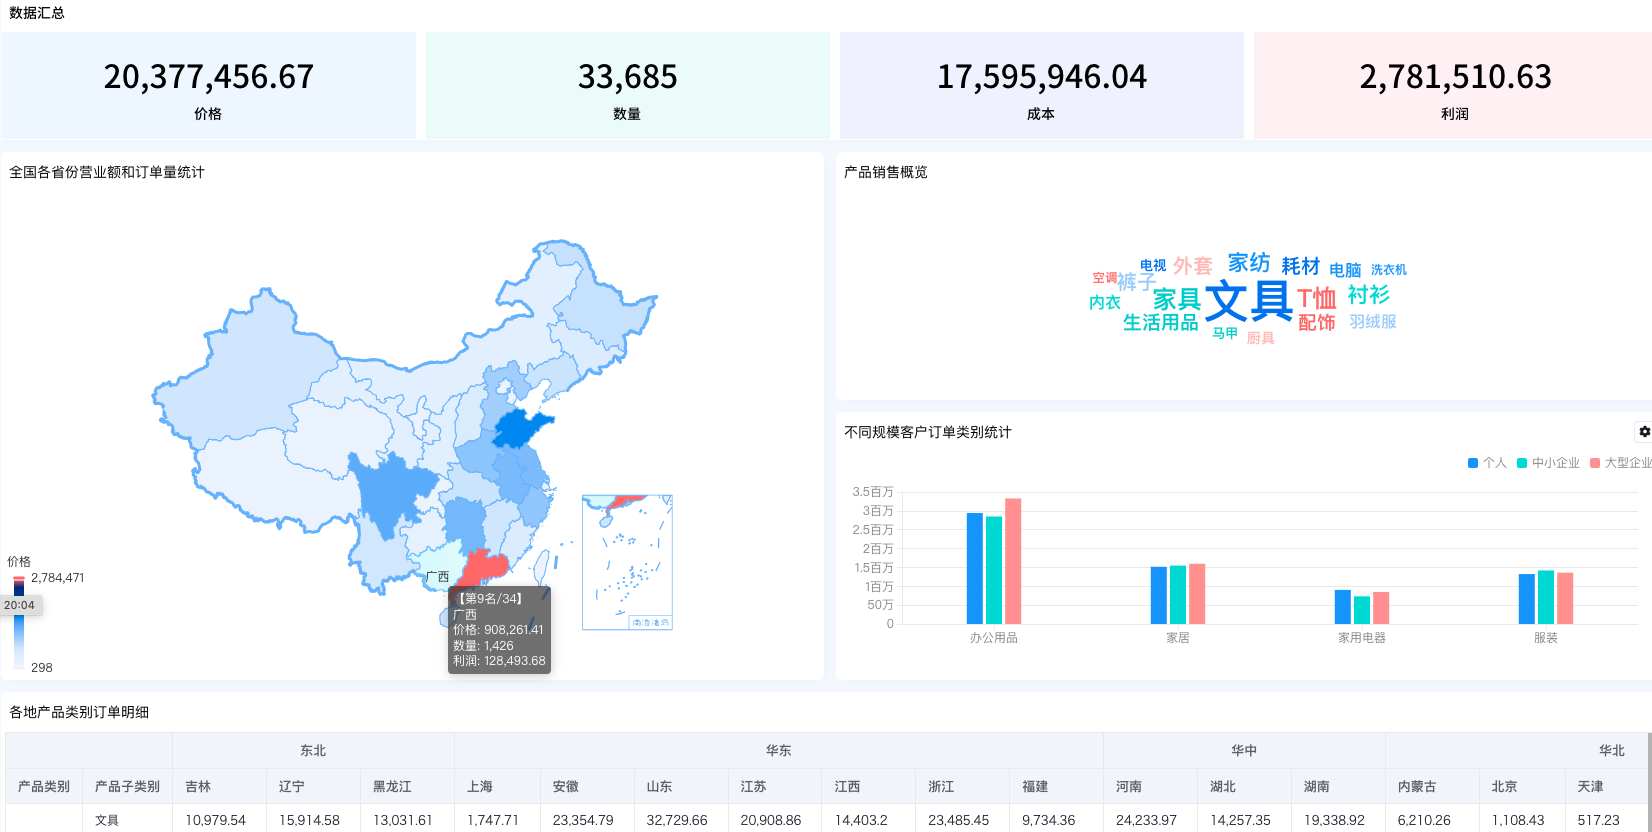
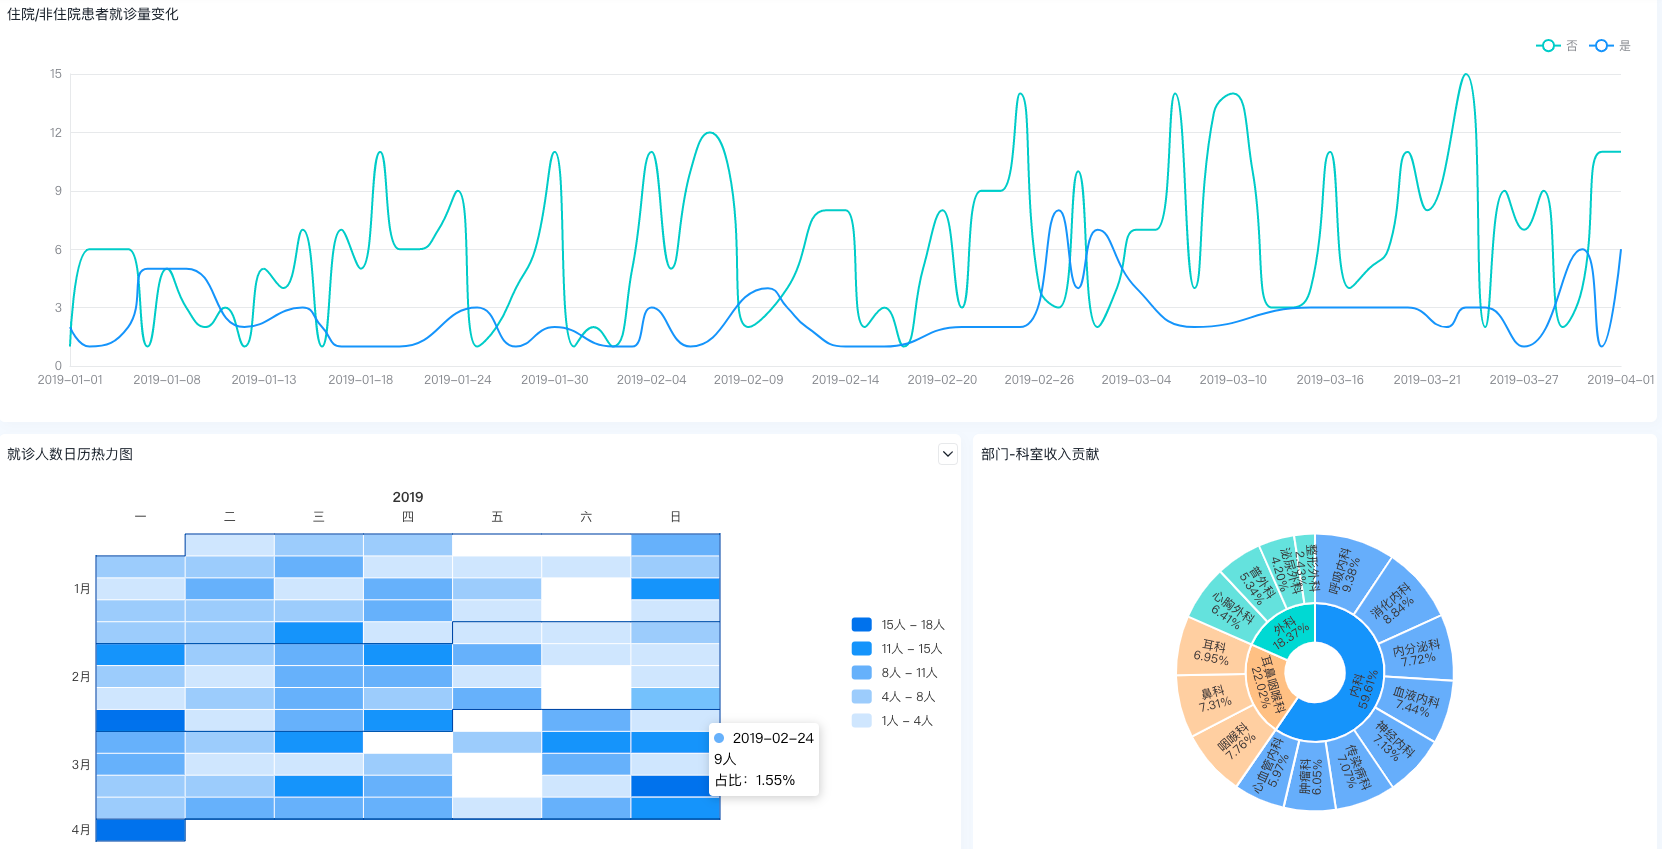
Report Example -
Customer Stories -
Case Details -
Product video -
Product Dynamics -
Documentation and Tools -
Related products -
Friendly Links
Latest activities
-
University welfare College students can get 90 day free trial by binding EDU email -
Private deployment From 30000 yuan, it is easy to implement container deployment and seamlessly integrate the internal environment of the enterprise -
Related products New data source GaiaDB 30 day free trial, 100% compatible with MySQL and large capacity
What's New
-
AIGC application Sugar BI: Intelligent BI in the era of big model -
New Features Support the query of record count (*) questions, and optimize the query effect of TopN, Like, date and time -
Interface upgrade Adopt the latest interactive style unified by Baidu Intelligent Cloud, optimize the functional structure and page layout, and improve the use experience
Product Functions
Direct data source
Rich charts
Drag and drop editing
Cool big screen
BI self-service analysis
Permission control
Product advantages
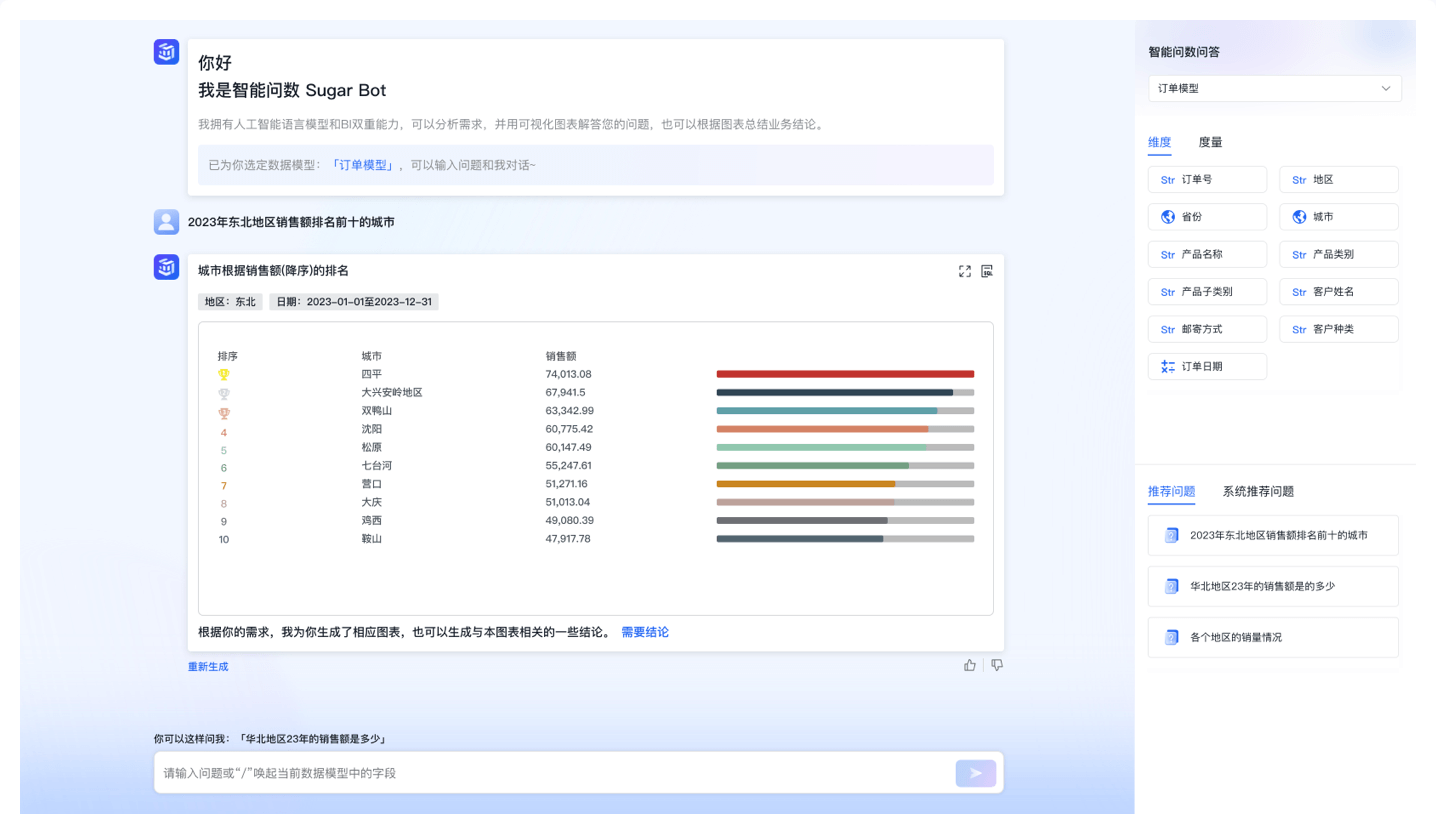
Intelligent question number
Our advantages
Large language model docking, no training required Get data quickly through simple dialogue Support generating business conclusions for charts Improve data insight efficiency
Product selection

Data visualization Sugar BI

Data visualization Sugar BI

Data visualization Sugar BI
Version comparison
| | | | ||
|---|---|---|---|---|
Application scenarios
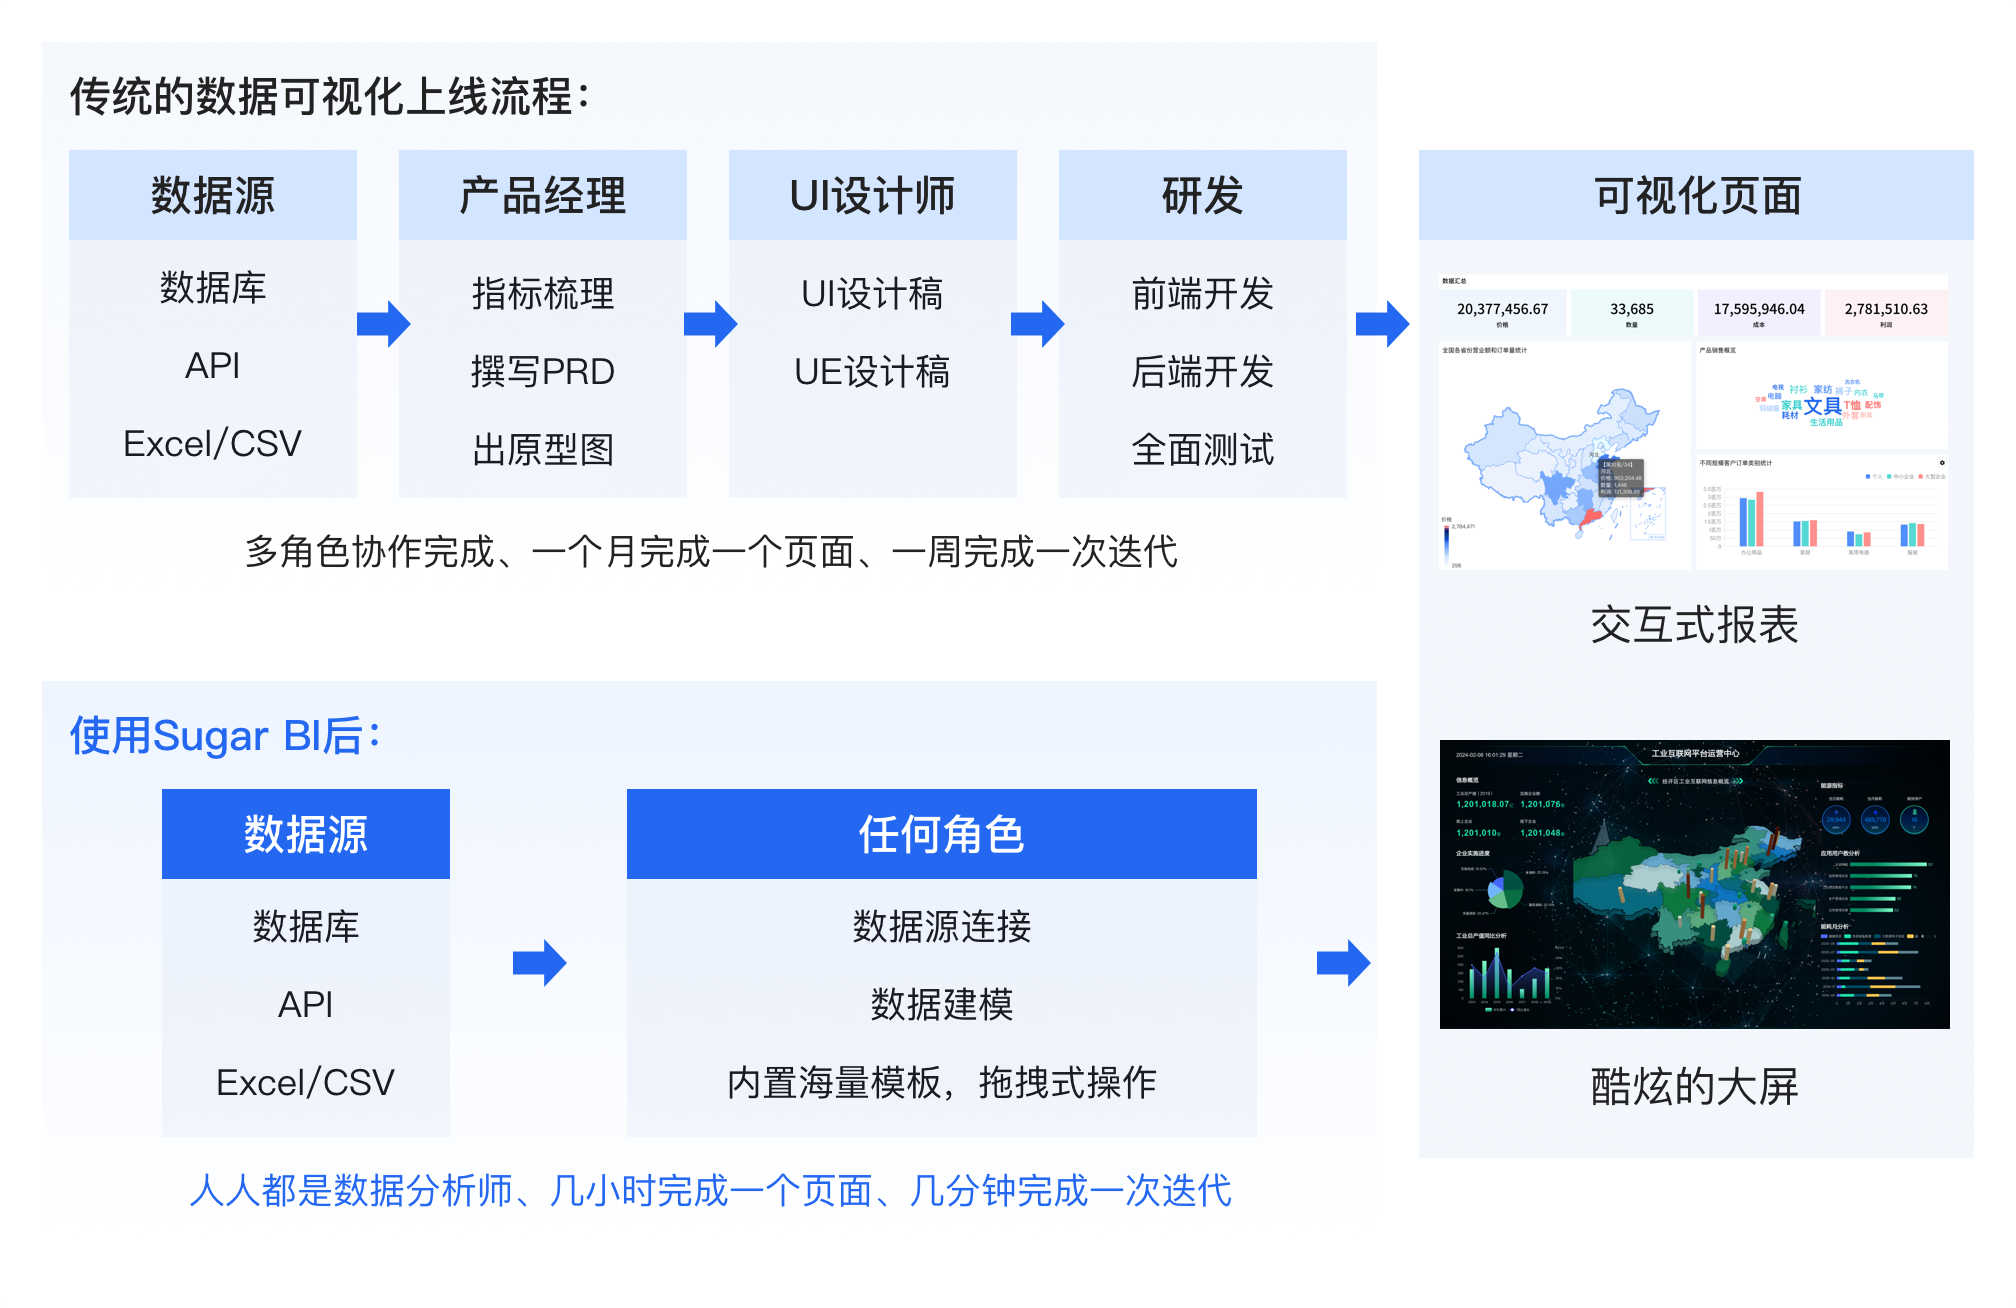
Scene pain points
After using Sugar BI
Quickly build visualization pages
Everyone is a data analyst
Respond to business requirements anytime, anywhere
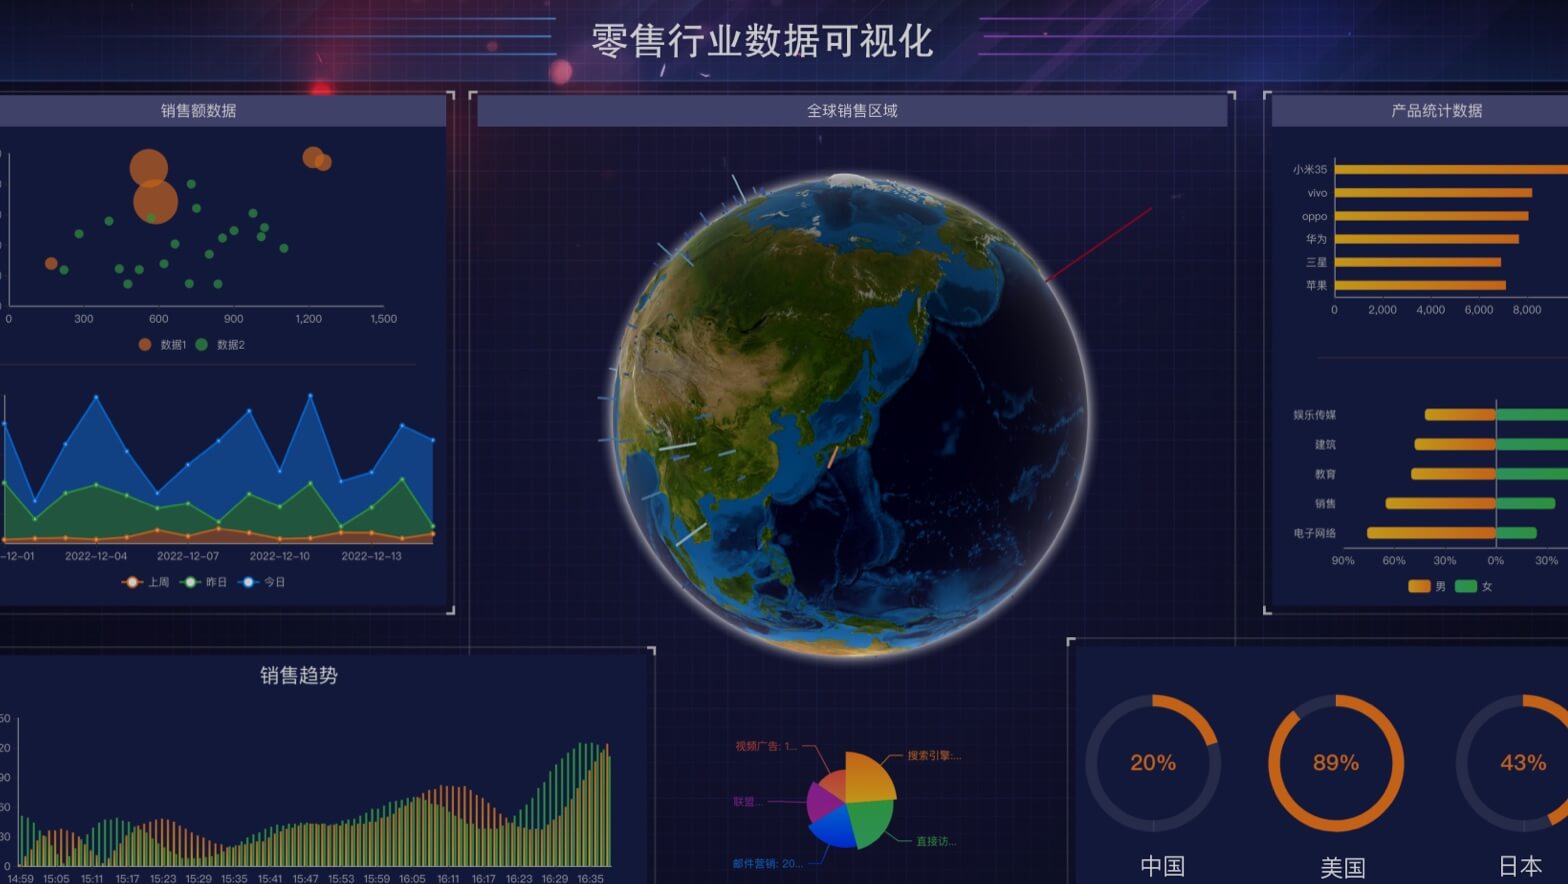
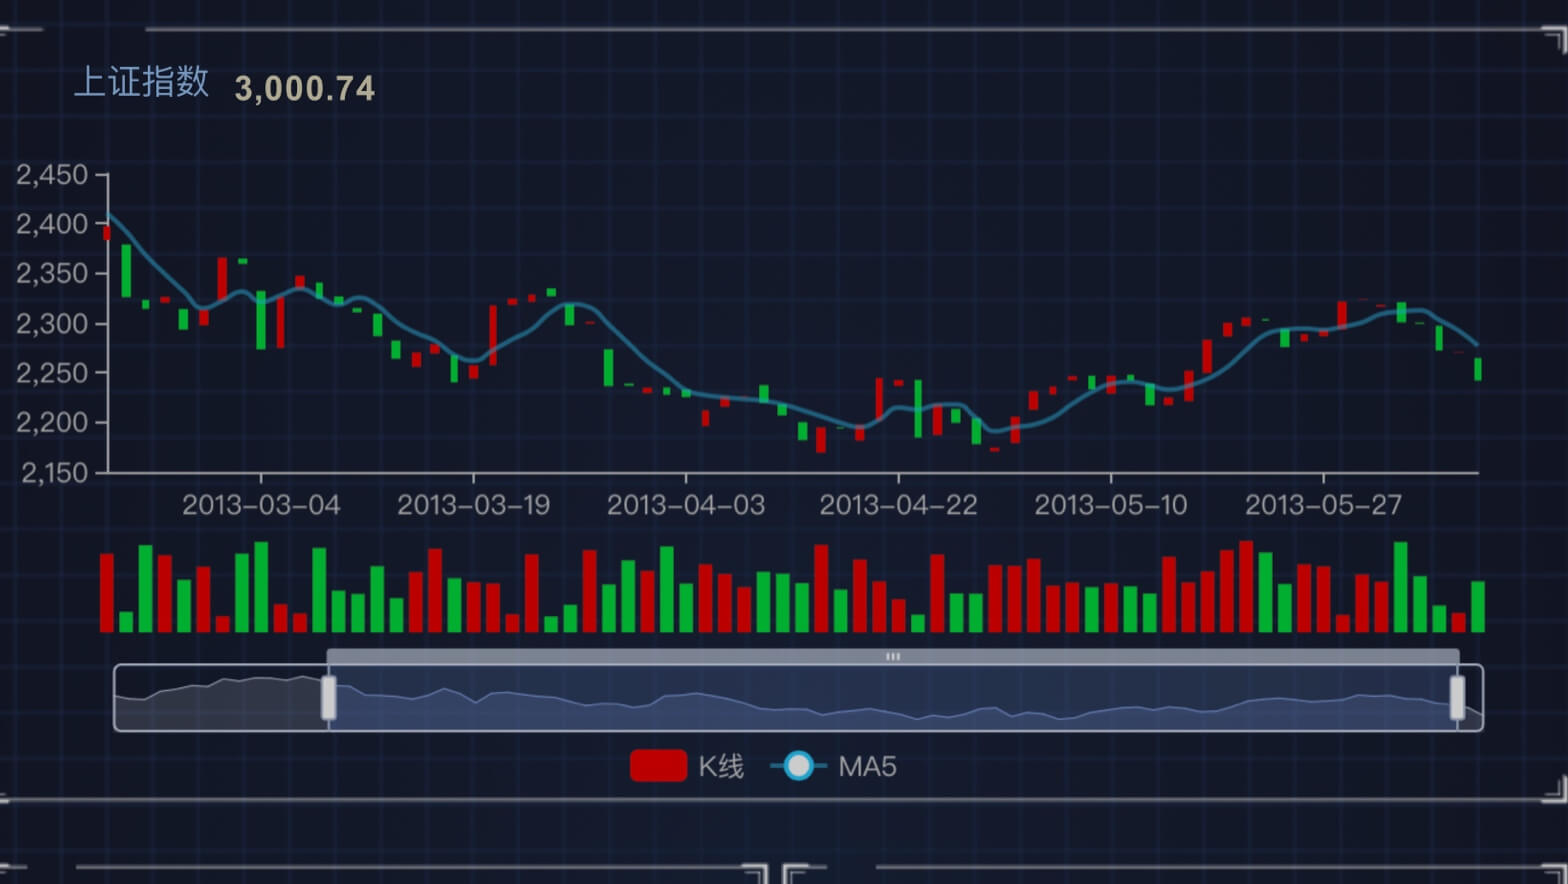
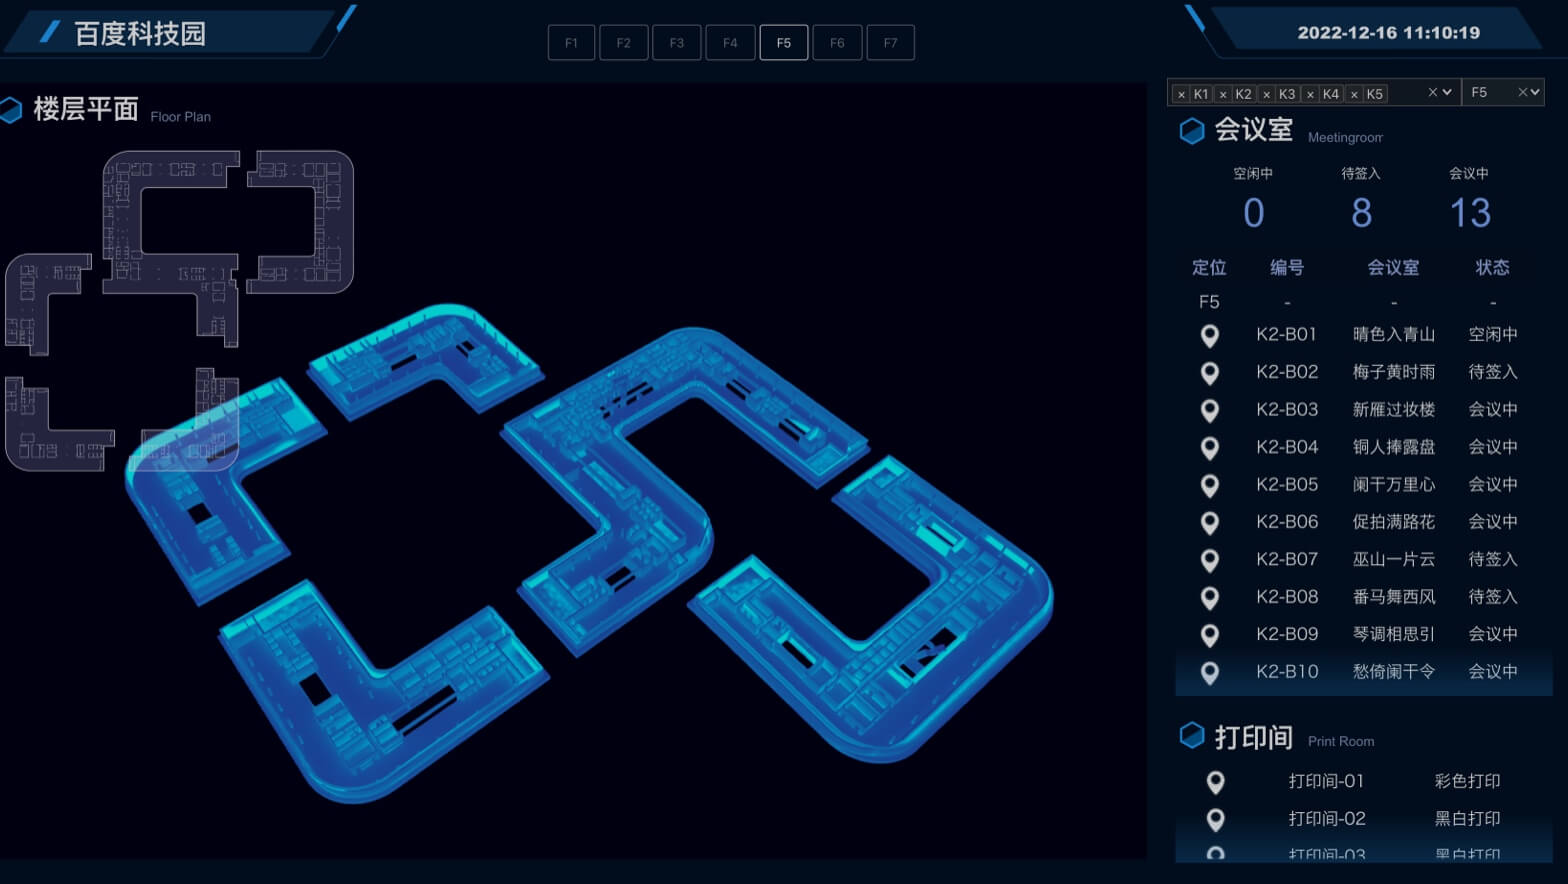
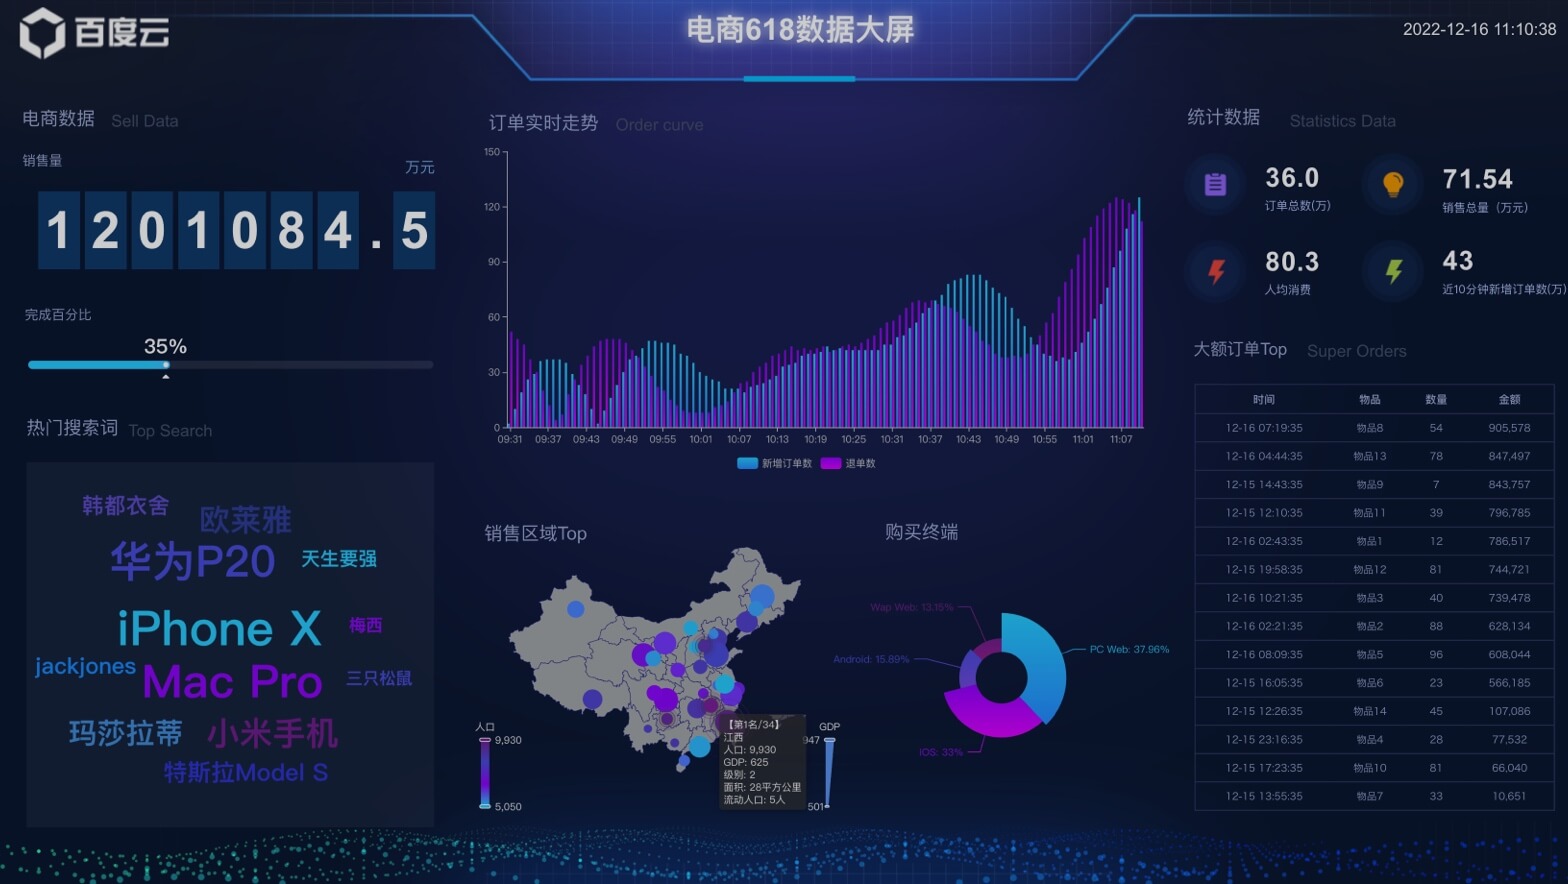
Large screen example
Report Example
They all chose Sugar BI
_ae8080e.png)
Case Details
Product video
Product Dynamics
New Features Support WYSIWYG visual editing Support basic functions such as management center, permission control and mailbox login 2018.04.12 V1.0.0 Details New Features Full support for private deployment and online application for trial license 2018.11.07 V1.5.0 Details New Features Sharing and publishing support password mode and iframe domain name password free white list 2018.11.07 V1.5.0 Details Function upgrade Support "data model" to realize BI multidimensional analysis capability 2020.02.15 V2.0.1 Details New Features Support the integration of WeChat, enterprise WeChat and nailing, and achieve password free login in WeChat and nailing 2020.11.25 V2.0.1 Details New Features The cloud SaaS version supports the "AI Q&A" function and adds the "AI Discovery Page" 2020.11.25 V2.4.1 Details> New Features Add "Cross source cross analysis function" 2021.01.25 V3.0.1 Details Function upgrade AI question and answer supporting "voice" interaction mode 2021.01.25 V3.0.1 Details Function upgrade Report and large screen support "Custom Chart Theme" 2021.06.27 V3.2.1 Details Function upgrade "AI Q&A" is supported in the large screen, and "voice interaction" is supported in the private deployment large screen 2021.06.27 V3.2.1 Details New Features The new function "Data Filling" supports custom setting "theme" in private deployment 2021.08.24 V3.3.1 Details New Features The new function "Table Calculation" supports custom setting "Theme" in private deployment 2021.11.25 V3.4.1 Details Function upgrade Various charts support "conditional format", which can highlight data outliers 2021.12.30 V3.5.1 Details New Features Add "Automatic Analysis" and "Self service Retrieval", and support "Cross source Cross analysis" in private deployment 2022.02.09 V4.0.1 Details New Features Add "Data Portal" and "Data Kinship" 2022.04.08 V4.1.1 Details New Features New fluctuation analysis function is added to analyze the fluctuation of time series data in the chart 2022.07.15 V4.4.1 Details New Chart Add "waterfall map", "Gantt map", "new topology map", etc 2022.07.15 V4.4.1 Details New Chart New Milestone 2022.07.26 V4.4.3 Details Function upgrade Macro definition function expansion, data model supporting automatic data completion, and data model supporting parameters in user-defined SQL views 2022.08.30 V4.5.1 Details New Features Add Historical Version and Recycle Bin 2022.10.10 V4.6.1 Details New Chart Add "3D Pie Chart", "3D Circular Chart", "Comment Component" and "Chart Comment" 2022.11.15 V4.7.1 Details New Features Add "Permission Audit" 2022.11.15 V4.7.1 Details New Features Add "intelligent prediction" to support multiple built-in classification and regression algorithms 2023.02.02 V4.8.1 Details New Features Add "Dynamic Dimension and Measurement Analysis" to support users to switch dynamically in browsing status 2023.03.09 V4.8.3 Details New Features Add "Time Series Data Prediction", support algorithms: Holt Winters, SARIMA 2023.03.09 V4.8.3 Details New Features The new "prediction service" can train the model of machine learning algorithm on the platform 2023.05.24 V5.0.1 Details New Chart Add Indicator Disassembly Tree 2023.05.24 V5.0.1 Details New Features Based on Wenxin's big language model, the conversational data Q&A function intelligent question number is officially launched 2023.07.28 V5.1.0 Details Function upgrade The function of super header and footer is upgraded for common tables and cross pivot tables, and supports super footer 2023.11.14 V5.1.1 Details Function upgrade Intelligent query effect optimization, support query of record count (*) questions, optimize query effect of TopN, Like, date and time 2023.12.28 V6.0.0 Details New Features The new data source supports GaussDB (DWS) - Huawei digital warehouse, and Redis supports cluster and sentinel modes 2024.02.05 Details of V6.0.0.25
