In stock software, there are not only daily k lines and monthly k lines. It is also a time-sharing chart, which changes in real time during trading, and has a very important reference function for current trading operations. How to see Trading volume time-sharing chart ?
Click the time-sharing chart in the stock interface. Below the time-sharing chart is the trading volume. The specific location is shown in the figure.
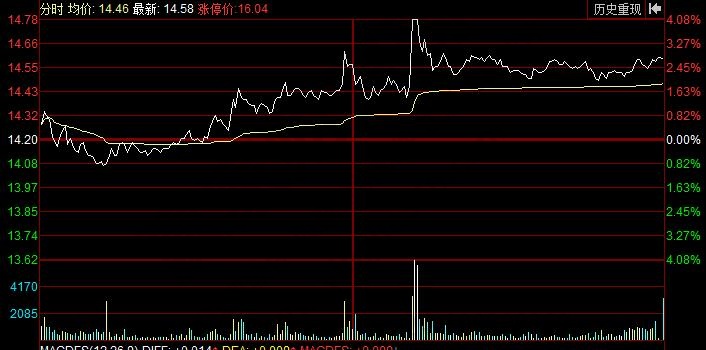
1、 Color
【1】 Red column line: This means that active purchase is dominant. When a certain price is reached, the red line bar is usually used to indicate that the seller takes the initiative to place an order, or places the order first, and then the seller places the order or makes a real-time shipment transaction
【2】 Green column line: It means that the buyer can pick up the goods only after the buyer takes the initiative to sell the goods, or the real-time shipment comes first. Green labels are generally used.
【3】 White column line: the trading volume of the time-sharing chart will also be white, indicating that at this price, the selling order and the buying order are linked at the same time. At the same time, investors only buy and sell commodities at this price, which will not affect the trend of stock prices.
2、 Length of column line
In the trading volume time-sharing chart, the trading volume status of the trading volume is one column per minute. The longer the column, the greater the trading volume at this price.
In the rising trend, the trading volume will rapidly expand. With the rise of prices, the differences between the buyer and the seller will become more and more fierce. With the continuous increase of trading volume, stock holders are also participating in selling, and should be vigilant when chasing up; The number of transactions will decrease with the decline of the trend, and the price may fall.
However, this kind of technical analysis is a foundation and cannot completely determine the success rate. We should also study other technical indicators Fundamental plane And policies, etc. For technical analysis, we can learn from Gann's theory, which is characterized by accurate price support resistance level and time cycle analysis.
1、 Attack volume (early attack volume, late attack volume).
Over a period of time, the amount of transactions has been increasing, from low to high, or even multiple, like a blowout. Only a large number of continuous purchases will form an attack volume. This is the main force buying in large quantities, collecting chips from those who cannot understand the backward power holders. At the bottom, the main force must be buying; If it appears at the top, it is highly likely that the main force is selling.
After the amount of attack is found at the bottom, it can be judged that the unit has the main force in action and can follow up at the right time; After the amount of attack is found at the top, it can be judged that the main mechanism is selling at this time. Holders should sell, and investors with short positions should be careful not to buy when the trading volume is released.
2、 Reverse measurement.
The transaction shows a sudden and sudden expansion of a single beam, and an independent single beam column, without continuity. After one measuring column is magnified, the next one will shrink immediately.
This is the feature formed when the main force falls. The purpose of the main decline should be judged according to the position of the stock price. When the main force sucks, washes, lifts, and ships goods, it will use reverse decline to mislead the market and make people who cannot understand it misjudge. After the counter measure appears, the best action is to hold still.
3、 Dish washing capacity.
The stock price opened higher and went lower. After the high opening, the trading volume increased slightly, while when the transaction opened lower, the trading volume doubled. In the session, we can see that the number of sales is greater than the number of purchases, and the number is smaller than each wave. The main force raises the share price at the opening, and then falls. Fearful retail investors are selling, so there will be no large trading volume; In addition, the main force is pushing down, the stock price is getting lower and lower, the holders are more and more afraid, and short sellers dare not buy. If you haven't stopped falling and stabilized, don't be greedy; The only chance to wash the dishes is to stop falling and stabilize.
4、 Flat head measurement.
The trading volume continues to increase until the highest volume of a wave appears, and then decreases; Then there was a continuous high volume, but the data of this transaction was almost the same as that of the previous transaction, which formed a flat volume.
The main force is to buy in batches. If the stock price rises one after another, it may face rising. After parity appears, it is advisable to buy on bargain.
5、 Incremental.
After a continuous wave of volume energy, the transaction is then reduced, then continuously increased and then decreased; However, the amount of the latter wave is greater than that of the previous wave, and each wave is greater than the other, forming an increasing amount. When the stock price rises, the trading volume enlarges, showing an increase in the buying volume. This is because the power of long in the market is greater than short, thus forming an increment. When it is found that individual stocks are in the incremental form of incremental bidding, it is necessary to use the intraday callback to choose the right time to buy. Don't hesitate. After the first low point, there won't be the same low price again.


