Yesterday, the market was first down and then up, but the index still did not rise much, so investors will inevitably encounter some problems in analyzing the wave structure of the rising index using the classic knowledge of wave theory. Next, we will bring you the wave structure analysis of the recent Shanghai Stock Exchange Index. After analyzing the wave, the conclusion is that wave 2 and wave 4 alternate in wave c; Wave 1 and wave 3 alternate in wave c; Wave 4 does not retreat the price range of Wave 1; At the end of wave 4 of wave c in a 335 bounce. The figure is as follows.

Because I'm interested in how to divide the small waves of Wave 1. In addition, even if Wave 1 intersects with Wave 4, there won't be too much problem. The main thing is that Wave 4 here will be completely ineffective if it breaks the low point of Wave 2, because the rebound in the past two days is not like a driving structure. Of course, it needs to continue to observe. In addition, the 335 structure you mentioned may not be true, but the 535 structure, short zigzag C wave.
The graph above Shangran has been analyzed as of the closing of the market on the 18th, so sometimes we will inevitably encounter various problems in the process of wave structure analysis, especially when there are several waves. Therefore, investors must be flexible in the specific analysis process. Next, let's look at the recent trend of gold.
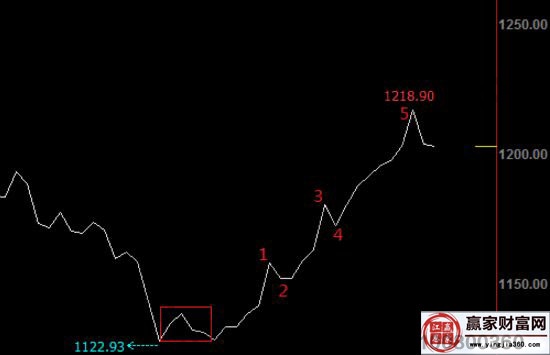
Since gold 1122.93, in addition to yesterday's analysis, there may be another division. To sum up, a wave level is at the end or has ended. First, look at the line chart. Day level:
Let's look at the column chart again:
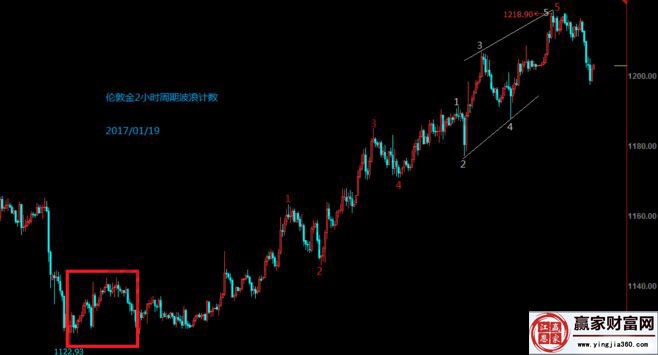
In the above figure, 3 is not the shortest, but the coordination is insufficient. If 1122.93 is the orthodox bottom, there is still a rush in the market and space is limited. The five wave structure of the wave theoretical model opened at 1122.93 of Gold is about to end. The five wave structure is a wave a or 1 of the first level.
Through the above analysis, we can understand the application of the wave theory. Of course, in the specific analysis process, investors can also use some ideas of entanglement and Zen to analyze, so that we can also understand the market trend from another aspect. Finally, in the last trading day of this week, we hope everyone can gain something.


