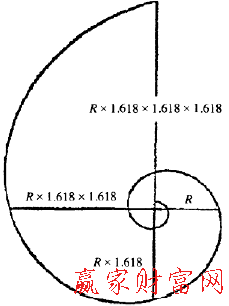
For time and price analysis, gann theory The division of a whole circle is proposed as the basis for analysis, while Eliot's Wave theory The spiral is the basis of analysis, one of which is static, the other is dynamic, each has its own advantages.
The difference between a spiral and a circle is that the radius of a circle is fixed, so the relationship between time and price is basically one-to-one (in fact, for the wheel in the wheel or Gann hexagon, although they are all based on a circle, they are also spiral magnified according to a certain volatility); For the spiral, the relationship between time and price is based on 0.618 or 1.618 to analyze the spiral amplification or reduction.
If we use the theory mentioned above to look at the five waves driven by the wave theory, when we know the length of the first wave, the end point of the five waves rising can also be calculated. The method is to multiply the length of the first wave by 1.618 times, and then add it to the top of the first wave. The calculated target is the top of the fifth wave. As shown in the figure below:
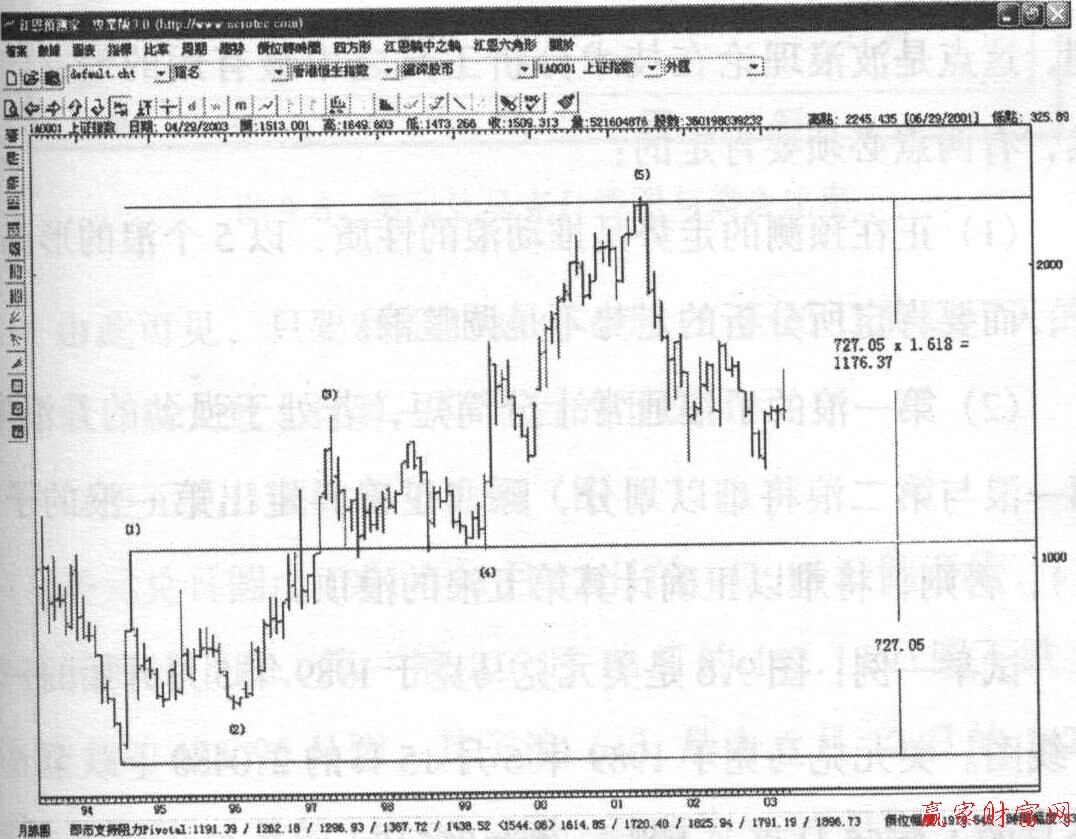
From the perspective of the Shanghai Stock Exchange Index, a study of the trend from 1994 to 2001 will find that it just confirms the above theory.
The Shanghai Stock Index rose from 325.89 in July 1994 to 1052.94 in September 1994. If (1) the wave rise is 727.05 points, the 1.618 times amplitude is 1176.37. Add 1176.37 to (1) wave crest 1052.94, and the calculation target is 2229.31, which is only 16.13 points different from the actual (5) wave crest 2245.44. Compared with the rise of the whole five waves from 325.89 to 2245.44 at 16.13, the difference is only 0.84% (as shown in the figure below).
Monthly line chart of Shanghai Stock Exchange Index and gold ratio
If the above five waves are only the sub waves (1) of the higher wave, turn the spiral again to get the fifth wave top of the higher wave. The calculation method is to multiply (1+1.618) R by 1.618 and add it to the top of sub wave (1).
To sum up, as long as we know the length R of sub wave 1 of sub wave (1), we can calculate the whole length of this group of waves. The answer is 1.618 × (1+1.618) R+(1+1.618) R, that is, the fourth power of 1.618, 6.853R.
The method of time is the same. Since the adjustment wave tends to slide along the spiral resistance line and has entered the third wave when breaking through, the time from the starting point of the first wave to the end point of the second wave is 1.618 times, which should theoretically be the end point of the adjustment wave of the higher level wave.
The most important point is that when we know the length of the sub wave (1) of the first wave of the five driving waves, the rise/fall of the whole five driving waves can be calculated approximately technical analysis The most useful part of tools. Of course, there are two things to be sure:
(1) The trend being predicted is to promote the nature of waves, rising in the form of five waves, and it is necessary to be sure that the trend being analyzed is not an adjustment wave.
(2) The sub waves of the first wave are usually very short. If they are in a strong rising wave, it will be difficult to distinguish the first wave from the second wave. Unless the sub waves (1) of the first wave are correctly defined, it will be difficult to correctly calculate the top of the fifth wave.
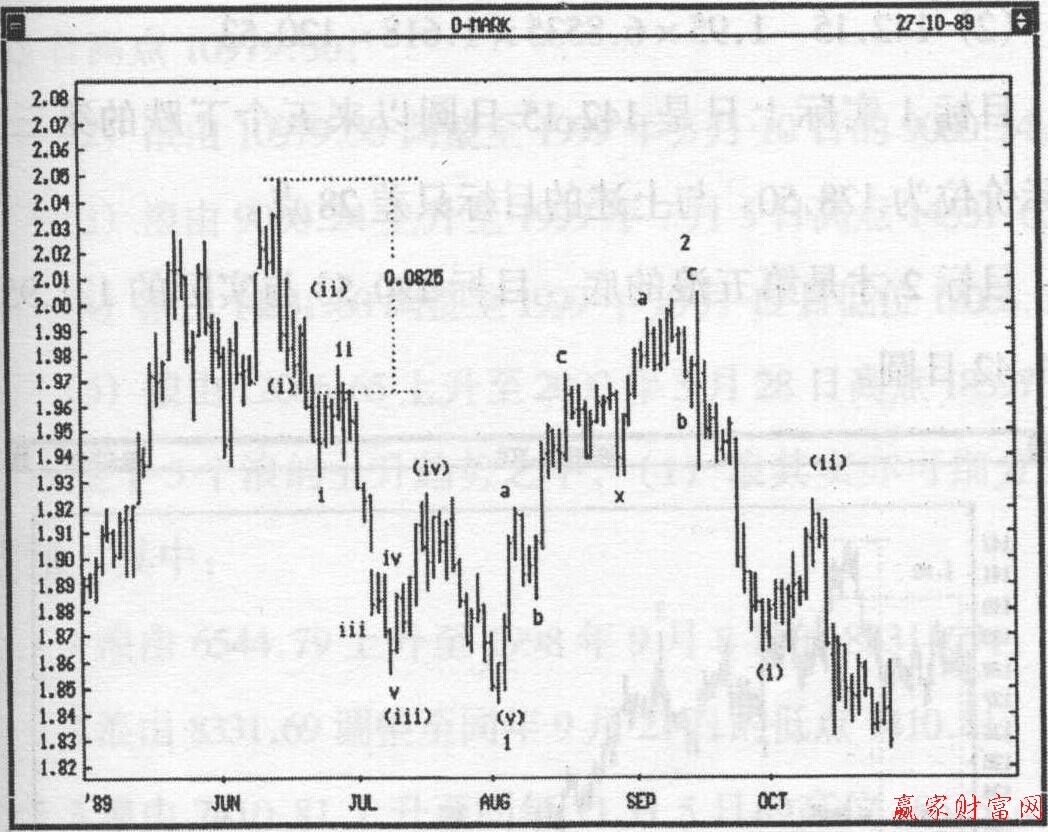
To take an example, the chart below shows a daily line chart of the US dollar against the Mark since May 1989. The dollar fell to 1.9655 mark on June 20, 1989 from 2.0480 mark on June 15, 1989, by 825 points.
Using the calculation method introduced above, the range of this group of medium-term falling waves should be 0.0825 times 6.8535, and the decline should be 0.5654. From 2.0480 mark on September 15, the decline target should be 1.4825. As a result, the dollar fell to 1.4430 marks against the mark on February 11, 1991, about 400 points away from the target, or 7% of the decline.
Daily USD/Mark Chart and Gold Ratio
It can be seen from this that as long as the decline in the six days before and after June 15 to 20, 1989 is used, we can roughly calculate the decline target one and a half years later.
Take the trend of the dollar against the yen as an example:
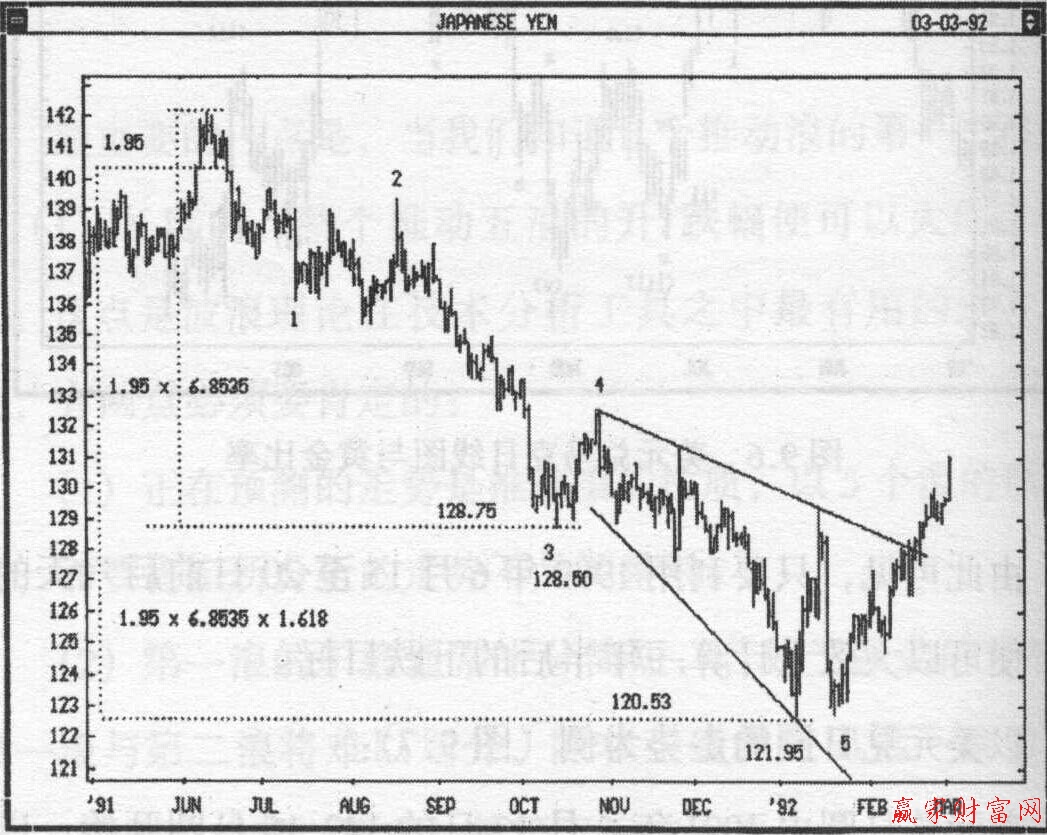
The US dollar against the Japanese yen started from 142.15 yen on June 12, 1991, and fell in five waves. The first wave fell from 142.15 yen on June 12 to 135.95 yen on July 12. Its sub wave (1) was 142.15 yen on June 12
It fell to 140.20 yen on June 14, a drop of 1.95 yen, which was completed in two days.
Using the decline in these two days, we can roughly calculate the target of five waves of medium-term decline starting from 142.15 yen. The drop of 1.95 yen in Zilang 1 mentioned above has several important goals:
(1) 142.15 - 1.95×6.8535=128.75
(2) 142.15 - 1.95×6.8535×1.618= 120.53
Target 1 is actually the third real price that has fallen for five times since 142.15 yen, which is 128.50, only 28 points short of the above target.
Target 2 is the bottom of the fifth wave. The difference between target 120.53 and actual 121.95 is 1.42 yen.
USD/JPY daily chart and gold ratio


