Atmospheric grid environment online monitoring system
1、 Overview
The grid air environment monitoring microstation is a new type of online multi parameter monitoring system for air quality, which is produced according to the 13th Five Year Plan and the air pollution monitoring and control policies of various regions SO2、NO2、O3)、 Two dust (PM2.5, PM10), five meteorological parameters (temperature, humidity, wind speed, wind direction, air pressure), optional TVOC, H2S, NH3 and other parameters are monitored, and the data are visually displayed through the big data analysis platform to achieve the goal of remote monitoring, remote warning, and strict prevention and control of pollution sources.
II Solution
2.1 System composition
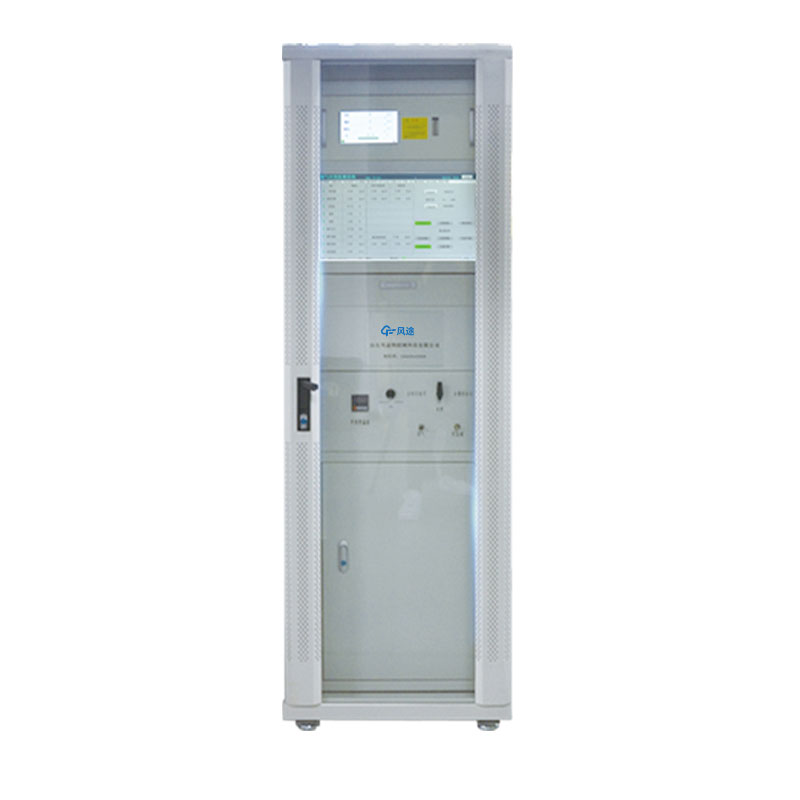
The monitoring system scheme consists of the following five parts: power supply system, electric cabinet, monitoring equipment, supporting components and big data platform.

Power supply system: solar energy+lithium battery (meet daily needs, but the rainy environment lasts for 21 days), mains power
Electric cabinet: transmission module, temperature compensation, anti cross interference coefficient, etc
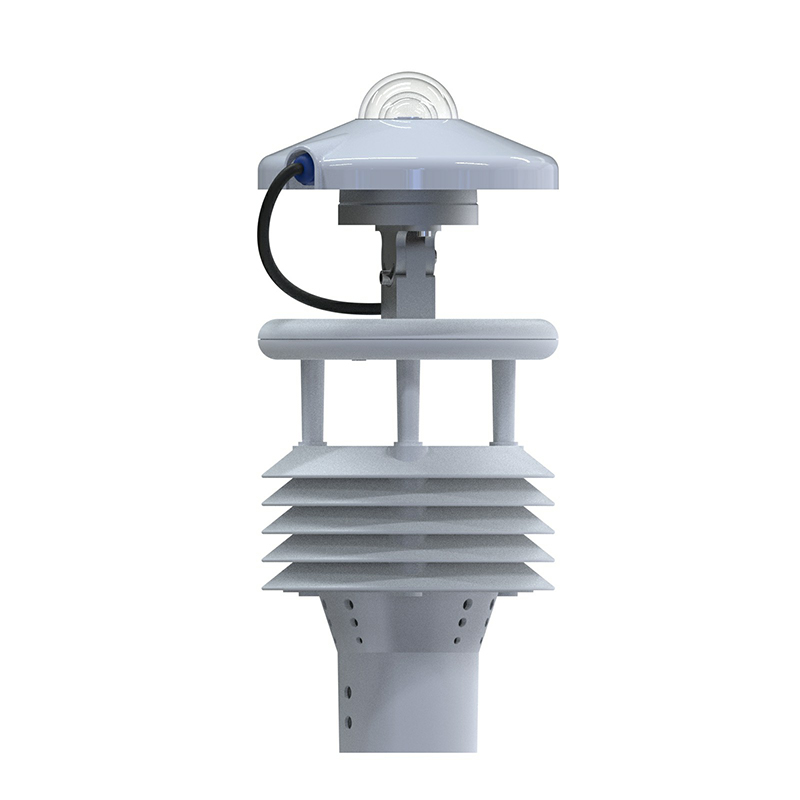
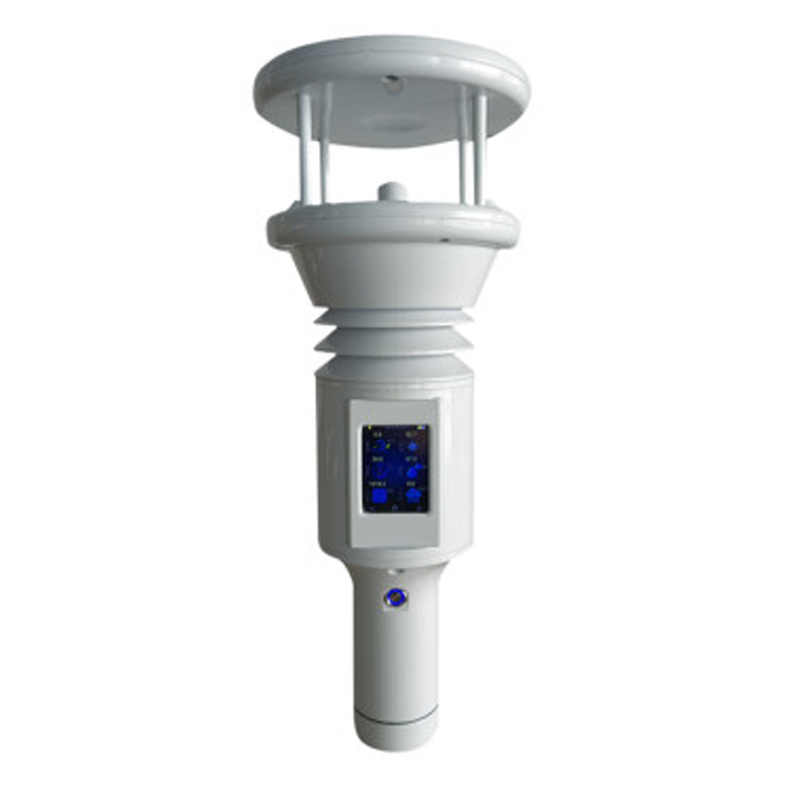
Monitoring equipment: four gases and two dusts, five meteorological parameters, TVOC (other gases will be expanded)
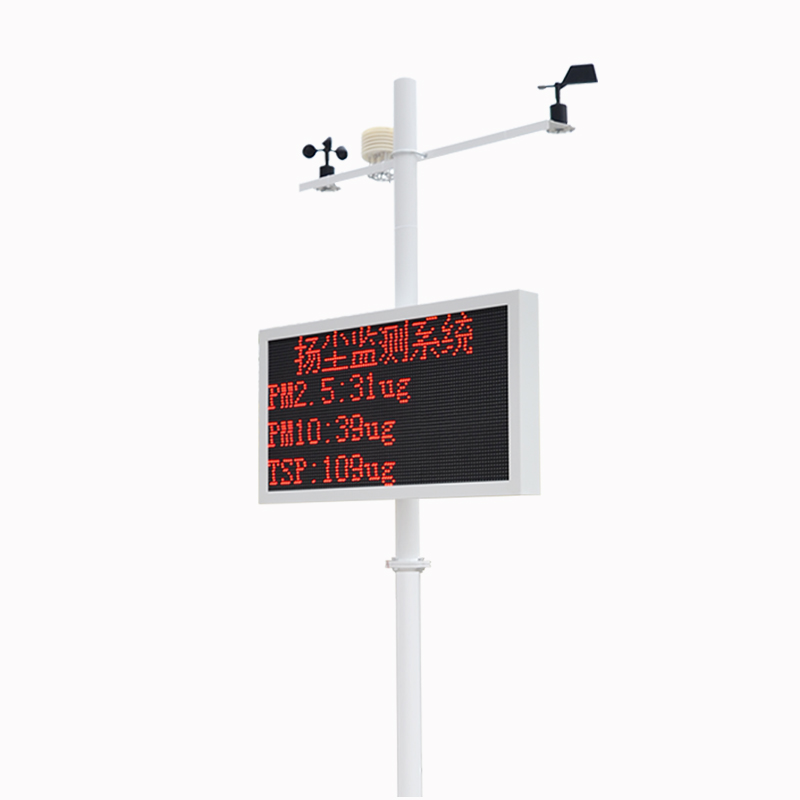
Supporting accessories: upright pole, shell, optional display screen, camera ball machine
Big data platform: the third generation data analysis platform has been updated since 15 years of research and development in Ampar
2.2 Applicable environment
Urban environmental monitoring, municipal environmental monitoring, mobile environmental monitoring, enterprise chemical park, traffic pollution environmental monitoring, residential area/school/hospital air quality environmental monitoring, park/forest environmental monitoring.

2.3 Functional characteristics
1. Sampling method: diffusion/pump suction
2. Communication mode: 4G/Ethernet interface
3. Built in large capacity SD card to store data for two years
4. Realize various parameters collection, data processing and data upload functions
5. Imported high sensitivity sensor is adopted, with fast response speed, high resolution, good linearity, lower detection limit reaching ppb level, and stable operation under high temperature conditions.
6. It has the equipment status indication function, and can visually identify the equipment working status.
7. Power supply system with solar energy+lithium battery+municipal electricity
8. The device can automatically report the sensor operation status, system power status, lithium battery status, etc
9. The equipment can be remotely calibrated and the program can be upgraded through the remote terminal
10. Support breakpoint resume function to avoid data loss caused by network environment problems.
11. Low maintenance cost, low price of spare parts, simple replacement, no tools for disassembly, and convenient point migration
III Point layout principle
For the demand of fine monitoring of air pollution prevention, the whole administrative region of XX can be divided into different grids according to the geographical environment and climate conditions of XX, and they can be monitored separately.
3.1 Point layout principle
1. Representativeness
It has good representativeness, can objectively reflect the ambient air quality level and change planning within a certain space, objectively evaluate the urban and regional ambient air conditions, the impact of pollution sources on ambient air quality, and meet the demand for providing the public with health guidance on ambient air conditions.
2. Comparability
The setting conditions of the same type of monitoring points shall be as consistent as possible to make the data obtained by each monitoring point comparable.
3. Integrity
The environmental air quality assessment of city points should consider the comprehensive environmental factors such as urban physical geography and meteorology, as well as the socio-economic characteristics such as industrial layout and population distribution. The layout should reflect the air quality status quo and change trend of the main functional areas and main air pollution sources of the city. The overall layout should be reasonable, and the monitoring points should be coordinated with each other.
4. Forward looking
The layout of monitoring points should be considered in combination with urban and rural construction planning, so that the determined monitoring points can take into account the trend of future urban and rural spatial pattern changes.
5. Stability
Once the location of the monitoring point is determined, it shall not be changed in principle to ensure the continuity and comparability of the detection data.
3.2 Requirements for point layout
1. Site environmental survey 
Before determining the layout of sampling points, a detailed investigation should be carried out, including:
1) Investigate the air pollution sources in this region, and preliminarily analyze the pollution source overview of each region;
2) Understand the perennial dominant wind direction in the region, and roughly estimate the possible diffusion of pollutants;
3) Use field survey and random population survey to preliminarily judge the impact of pollutants;
4) Use the existing monitoring data to infer and analyze the number and orientation of the points to be set.
2. Point layout method
1) Function area layout method
A city or an area can be divided into industrial area, residential area, traffic intensive area, commercial prosperous area, cultural area, clean area, control area and other functional areas according to its functions. It is not required to average the number of sampling points. Generally, more sampling points should be set in industrial areas with concentrated pollution, densely populated residential areas, and traffic intensive areas, At the same time, 1-2 control points shall be set in the control area or clean area.
2) Layout of geometric figures
At present, the following three deployment methods are commonly used:
A. Grid point distribution method: this method is to divide the ground of the monitoring area into several uniform mesh grids, and the sampling points are located at the intersection of two straight lines or the center of the grid. Each grid is a square, which can be evenly depicted from the map. The field area of the grid is determined by the size of the measured area, the intensity of pollution sources, the population distribution, the monitoring purpose and the monitoring force. Generally, one point is arranged for 1~9 square kilometers. If the dominant wind direction is clear, more downwind points should be set, generally accounting for 60% of the total number of sampling points. This method is applicable to the situation where there are multiple pollution sources and the distribution of pollution sources is relatively uniform.
B. Concentric circle distribution method: this distribution method is mainly used for the pollution group composed of multiple pollution sources or the areas with concentrated pollution. The distribution of points is to draw a concentric circle with the pollution source as the center, the radius depends on the specific situation, and then draw 45° from the concentric circle; There are several rays with included angles, and the intersection of radiation rays and concentric circles is the sampling point.
C. Fan layout method: this method is applicable to areas with obvious dominant wind direction or isolated elevated point sources. With the point source as the vertex and the dominant wind direction as the axis, draw a sector area on the downwind ground as the distribution range. The sector angle is generally 45 deg; ~ 90°。 The sampling points are set on several arcs at different distances from the point source, and the included angle between adjacent two points and the line connecting the vertex is generally 10 deg; ~ 20°。
The above sampling and distribution methods can be used alone or in combination, so as to reflect the concentration of pollutants in a representative manner and provide reliable samples for atmospheric monitoring
3. Point layout requirements
The layout requirements of monitoring points are mainly based on the regional pollution source data, meteorological data, geographical conditions and other factors to understand the characteristics, size and distribution of air pollutant emission sources, the nature and emission rules of pollutants, environmental conditions (terrain, ground features, etc.) and meteorological factors that affect the migration and diffusion of pollutants, The monitoring points shall be scientifically selected according to the purpose of detection through the investigation of ambient air quality.
According to different monitoring purposes, it can be divided into monitoring grids and quality control grids. The former is designed to monitor the air quality status, pollution characteristics and change trend of the area. The latter is deployed for the purpose of providing calibration data for micro air monitoring stations at each point in the monitoring grid.
1) Ambient air quality monitoring grid
The layout of environmental quality grid points shall be determined in combination with the population size of different monitoring areas, the conditions of built-up areas, terrain, meteorology and other natural factors. The points shall be evenly distributed as far as possible and can cover the whole monitoring area. At the same time, the distribution and planning of buildings and traffic in the monitoring area shall be considered to enhance operability. By consulting relevant experts and combining the application and experience of existing pilot cities, the grid side length is not more than 2 kilometers.
2) Pollution source area monitoring grid
According to the emission characteristics of different pollution sources, combined with building distribution, terrain, meteorology and other factors in the monitoring area, the guidance specifications for the layout of road traffic network, site dust grid, gas related enterprise grid and industrial park grid are respectively carried out. Among them, the floor area of the construction site dust grid, gas related enterprise grid and industrial park grid are quite different, so the number of points is further standardized.
A. Road traffic grid
For the monitoring of road traffic pollution sources, typical emission areas or road sections should be taken as the monitoring target. Important urban traffic intersections, important traffic hubs (bus stations, bus stations, railway stations, etc, The point is set at the downwind side; Considering the influence range of the road source and the field installation experience during the project implementation, it is required that the installation location of the point should be a certain distance from the road edge, generally 15-25m.
B. Site dust grid
The monitoring of dust pollution sources on the construction site is mainly aimed at the construction site currently under construction. The location of the monitoring points shall be determined according to the size of the construction site and the length of the construction period. Generally speaking, the construction site with an area of 10000 square meters or less shall be equipped with at least one monitoring point. When the construction site area increases, the monitoring points can be added as appropriate, and the principle of adding one monitoring point per 10000 square meters is generally. When there is only one monitoring point on the construction site, it should be set at the main entrance and exit of vehicles. If there are multiple monitoring points, the main entrance and exit of construction vehicles should be selected. The points shall be set within the safety range of the fence of the construction area of the construction site, and can directly monitor the main construction activities on the site. When the construction period of the construction site is too short, it shall be considered as appropriate.
C. Industrial Park Grid
The industrial park, as a concentration area of enterprise pollution sources, has the characteristics of many types of pollution sources and a large area. Therefore, the basic principles of ambient air quality monitoring grid can be referred to, and the grid monitoring method can be adopted. At the same time, due to the characteristics of multiple and complex types of internal pollution sources, in order to achieve the accurate positioning of pollution source troubleshooting, the grid should be further densified, The side length of the grid can be 500-1000 meters, depending on the size of the industrial park and the degree of pollution. At the same time, the concentrated pollution discharge of the industrial park is bound to have an impact on the surrounding environment, and the monitoring range can also be appropriately enlarged. Therefore, the industrial park should be increased to arrange border points to monitor the diffusion of the park to the surrounding area.
D. Life source grid
The sources of living mainly include coal-fired boilers, heating equipment, urban garbage stacking, incineration and other pollution sources, such as families, accommodation, catering, hospitals, large schools, parks, scenic spots, etc., which are relatively dispersed, but are concentrated in a few cases. Therefore, we can refer to the basic principles of ambient air quality monitoring grid, adopt the grid based monitoring method, and consider the appropriate increase of points in large commercial and residential communities, catering industry concentration areas, large schools or school concentration areas and other concentration areas in combination with the actual situation of the monitoring area.
3) Gradient occupation position
The gradient station shall be arranged in consideration of the local vertical pollution distribution characteristics from the ground to the upper air. Generally, the ground pollution concentration changes greatly, and the higher the altitude is, the smaller the change is. Therefore, the principle of close to the ground densification shall be adopted.
4) Grid quality control points
The purpose of grid quality control points is to provide calibration basis for the surrounding micro air monitoring stations. Therefore, the selection of points mainly considers the environmental background concentration that can represent the overall surrounding. Therefore, first of all, as a quality control point, it should meet the relevant requirements in Appendix A of the Technical Specifications for the Layout of Ambient Air Quality Monitoring Points (Trial), and then try to take into account the surrounding micro air monitoring stations. The specific range of quality control determines the change of the concentration of pollutants in the surrounding environment within the unit distance. The more average the concentration distribution of pollutants in the surrounding environment, the larger the quality control range. The larger the concentration change gradient of pollutants in the surrounding environment, the smaller the quality control range, which generally should not exceed 5 kilometers.
3.3 Point management
The management of air pollution prevention and control grid monitoring points basically follows the procurement unit as the management unit, or the procurement unit formulates the management unit, and the management unit is responsible for the approval of the later addition, change and cancellation of points. The management unit can be an administrative department or an enterprise or public institution.
IV Big data analysis platform
4.1 Visual display
Combined with geographical information, the uploaded minute level and massive monitoring data can be visualized and processed. At the same time, it is compatible with the data display of national stations, vividly showing the real-time data change trend and pollution distribution of air quality.

4.2 Pollution event monitoring alarm
According to the user's local air quality values and pollution characteristics alarm rules, the event capture technology can be used to analyze the alarm events at each point, and at the same time, the alarm message can be pushed to the customer in real time. The platform automatically pushes the monitoring alarm information of each pollution source to the relevant management personnel in real time through SMS, WeChat, email and other ways, starts the corresponding disposal process on the platform according to the alarm level, instructs the on-site staff to collect evidence and process, and then uploads the processing results to the management platform, so as to achieve closed-loop management of pollution sources.

4.3 Pollution area analysis
By calculating the cumulative probability of pollution exceeding the standard in each region over a period of time, we can get the areas where pollution often occurs, namely, the key areas where pollution exceeds the standard or the potential pollution sources. Managers need to focus on the supervision of such areas.

4.4 Basic statistical analysis
It provides basic data analysis functions such as single point or multi-point historical data comparative analysis, regional pollution status analysis, multi-point air quality ranking, etc. The functional design is simple and straightforward, which frees users from complicated data sorting work and solves practical problems that users are concerned about.

4.5 Mobile management
APAQ is not only used through WEB browser, but also provides mobile and portable query and statistics functions for mobile phones, tablets and other terminals.

V Application case