-
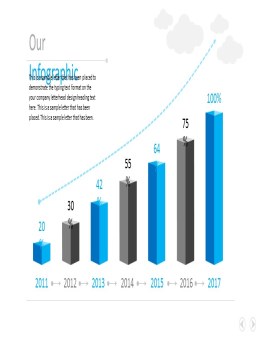
PPT increasing year by year histogram Category: Histogram |Download: 7 -
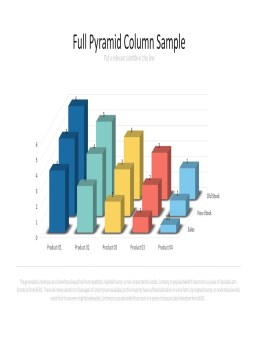
PPT three-dimensional histogram Category: Histogram |Download: 7 -
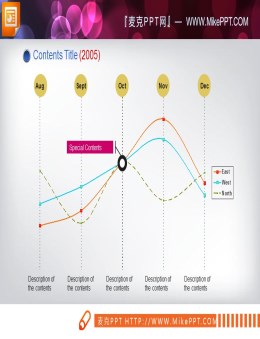
Simple PPT curve Category: Ppt curve |Download: 6 -

PPT price fluctuation curve Category: Ppt curve |Download: 7 -
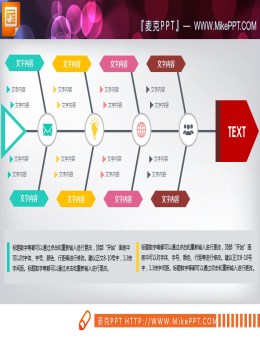
Fishbone PPT Chart Category: Structure diagram |Download: 6 -
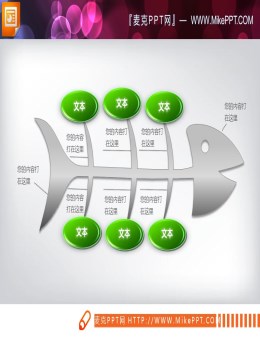
PPT3D fishbone structure drawing template Category: Structure diagram |Download: 6 -
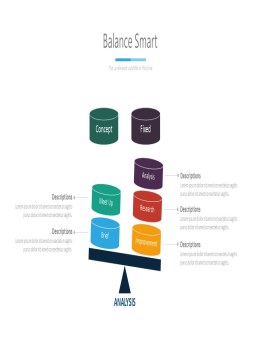
The seesaw comparison of PPT materials Category: Contrast relation |Download: 6 -
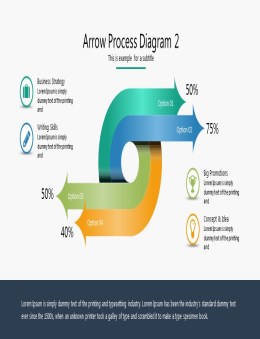
PPT opposite arrow comparison diagram Category: Contrast relation |Download: 6 -
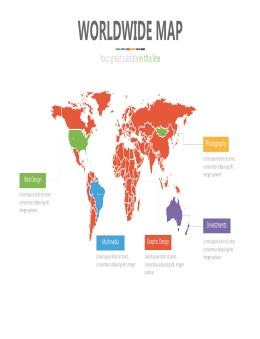
PPT vector world map material Category: Map |Download: 6 -
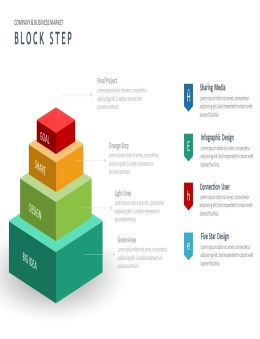
PPT step hierarchical relationship Category: Hierarchy |Download: 6 -
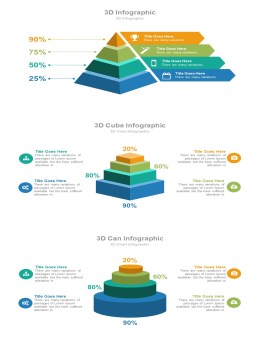
PPT three-dimensional hierarchical relationship material Category: Hierarchy |Download: 7 -
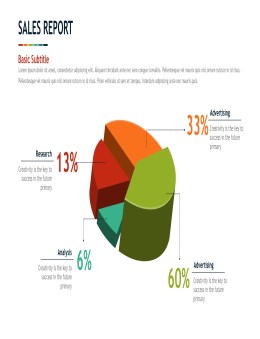
PPT three-dimensional high and low scale pie chart material Category: Pie chart |Download: 8 -
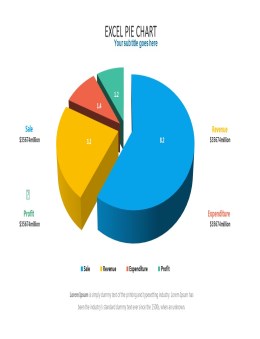
PPT separated solid pie chart Category: Pie chart |Download: 6 -
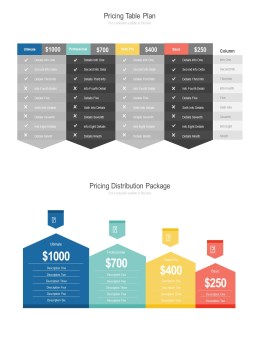
PPT Detailed Price Report Category: form |Download: 6 -
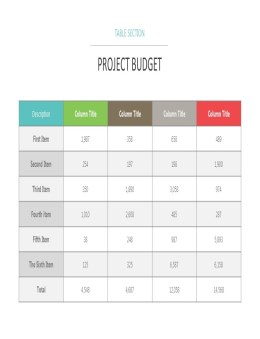
PPT Program Budget Form Category: form |Download: 7