Kensington, Connecticut Submit your own pictures of this place and show them to the world
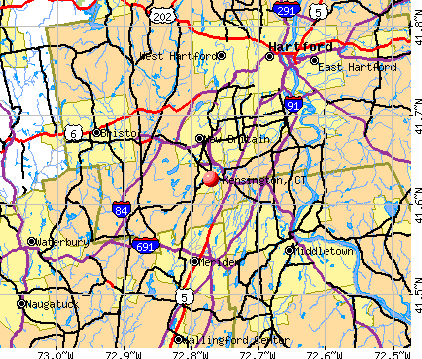
OSM Map
General Map
Google Map
MSN Map
OSM Map
General Map
Google Map
MSN Map
OSM Map
General Map
Google Map
MSN Map
OSM Map
General Map
Google Map
MSN Map
Please wait while loading the map...
Population in 2010: 8,459. Population change since 2000: -1.0% Males: 4,365 (51.6%) Females: 4,094 (48.4%)
March 2022 cost of living index in Kensington: one hundred and four point eight (near average, U.S. average is 100) Percentage of residents living in poverty in 2022: 7% Business Search - 14 Million verified businesses
Data:
Median household income ($)
Median household income (% change since 2000)
Household income diversity
Ratio of average income to average house value (%)
Ratio of average income to average rent
Median household income ($) - White
Median household income ($) - Black or African American
Median household income ($) - Asian
Median household income ($) - Hispanic or Latino
Median household income ($) - American Indian and Alaska Native
Median household income ($) - Multirace
Median household income ($) - Other Race
Median household income for houses/condos with a mortgage ($)
Median household income for apartments without a mortgage ($)
Races - White alone (%)
Races - White alone (% change since 2000)
Races - Black alone (%)
Races - Black alone (% change since 2000)
Races - American Indian alone (%)
Races - American Indian alone (% change since 2000)
Races - Asian alone (%)
Races - Asian alone (% change since 2000)
Races - Hispanic (%)
Races - Hispanic (% change since 2000)
Races - Native Hawaiian and Other Pacific Islander alone (%)
Races - Native Hawaiian and Other Pacific Islander alone (% change since 2000)
Races - Two or more races (%)
Races - Two or more races (% change since 2000)
Races - Other race alone (%)
Races - Other race alone (% change since 2000)
Racial diversity
Unemployment (%)
Unemployment (% change since 2000)
Unemployment (%) - White
Unemployment (%) - Black or African American
Unemployment (%) - Asian
Unemployment (%) - Hispanic or Latino
Unemployment (%) - American Indian and Alaska Native
Unemployment (%) - Multirace
Unemployment (%) - Other Race
Population density (people per square mile)
Population - Males (%)
Population - Females (%)
Population - Males (%) - White
Population - Males (%) - Black or African American
Population - Males (%) - Asian
Population - Males (%) - Hispanic or Latino
Population - Males (%) - American Indian and Alaska Native
Population - Males (%) - Multirace
Population - Males (%) - Other Race
Population - Females (%) - White
Population - Females (%) - Black or African American
Population - Females (%) - Asian
Population - Females (%) - Hispanic or Latino
Population - Females (%) - American Indian and Alaska Native
Population - Females (%) - Multirace
Population - Females (%) - Other Race
Coronavirus confirmed cases (Jul 03, 2024)
Deaths caused by coronavirus (Jul 03, 2024)
Coronavirus confirmed cases (per 100k population) (Jul 03, 2024)
Deaths caused by coronavirus (per 100k population) (Jul 03, 2024)
Daily increase in number of cases (Jul 03, 2024)
Weekly increase in number of cases (Jul 03, 2024)
Cases doubled (in days) (Jul 03, 2024)
Hospitalized patients (Apr 18, 2022)
Negative test results (Apr 18, 2022)
Total test results (Apr 18, 2022)
COVID Vaccine doses distributed (per 100k population) (Sep 19, 2023)
COVID Vaccine doses administered (per 100k population) (Sep 19, 2023)
COVID Vaccine doses distributed (Sep 19, 2023)
COVID Vaccine doses administered (Sep 19, 2023)
Likely homosexual households (%)
Likely homosexual households (% change since 2000)
Likely homosexual households - Lesbian couples (%)
Likely homosexual households - Lesbian couples (% change since 2000)
Likely homosexual households - Gay men (%)
Likely homosexual households - Gay men (% change since 2000)
Cost of living index
Median gross rent ($)
Median contract rent ($)
Median monthly housing costs ($)
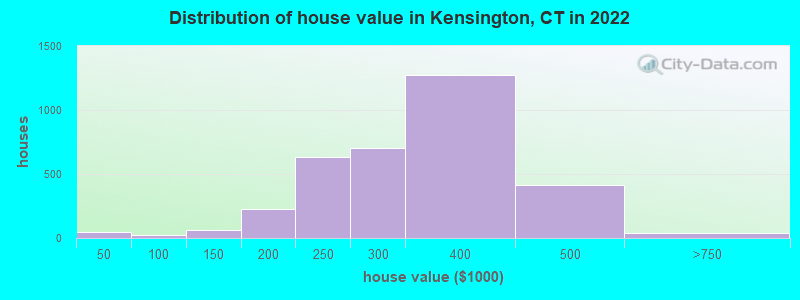
Median house or condo value ($)
Median house or condo value ($ change since 2000)
Mean house or condo value by units in structure - 1, detached ($)
Mean house or condo value by units in structure - 1, attached ($)
Mean house or condo value by units in structure - 2 ($)
Mean house or condo value by units in structure by units in structure - 3 or 4 ($)
Mean house or condo value by units in structure - 5 or more ($)
Mean house or condo value by units in structure - Boat, RV, van, etc. ($)
Mean house or condo value by units in structure - Mobile home ($)
Median house or condo value ($) - White
Median house or condo value ($) - Black or African American
Median house or condo value ($) - Asian
Median house or condo value ($) - Hispanic or Latino
Median house or condo value ($) - American Indian and Alaska Native
Median house or condo value ($) - Multirace
Median house or condo value ($) - Other Race
Median resident age
Resident age diversity
Median resident age - Males
Median resident age - Females
Median resident age - White
Median resident age - Black or African American
Median resident age - Asian
Median resident age - Hispanic or Latino
Median resident age - American Indian and Alaska Native
Median resident age - Multirace
Median resident age - Other Race
Median resident age - Males - White
Median resident age - Males - Black or African American
Median resident age - Males - Asian
Median resident age - Males - Hispanic or Latino
Median resident age - Males - American Indian and Alaska Native
Median resident age - Males - Multirace
Median resident age - Males - Other Race
Median resident age - Females - White
Median resident age - Females - Black or African American
Median resident age - Females - Asian
Median resident age - Females - Hispanic or Latino
Median resident age - Females - American Indian and Alaska Native
Median resident age - Females - Multirace
Median resident age - Females - Other Race
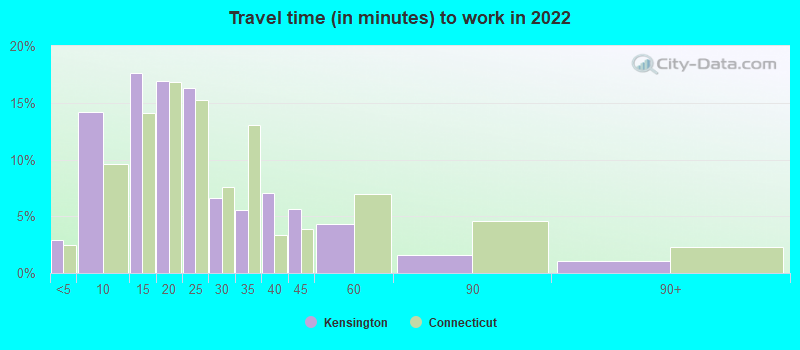
Commute - mean travel time to work (minutes)
Travel time to work - Less than 5 minutes (%)
Travel time to work - Less than 5 minutes (% change since 2000)
Travel time to work - 5 to 9 minutes (%)
Travel time to work - 5 to 9 minutes (% change since 2000)
Travel time to work - 10 to 19 minutes (%)
Travel time to work - 10 to 19 minutes (% change since 2000)
Travel time to work - 20 to 29 minutes (%)
Travel time to work - 20 to 29 minutes (% change since 2000)
Travel time to work - 30 to 39 minutes (%)
Travel time to work - 30 to 39 minutes (% change since 2000)
Travel time to work - 40 to 59 minutes (%)
Travel time to work - 40 to 59 minutes (% change since 2000)
Travel time to work - 60 to 89 minutes (%)
Travel time to work - 60 to 89 minutes (% change since 2000)
Travel time to work - 90 or more minutes (%)
Travel time to work - 90 or more minutes (% change since 2000)
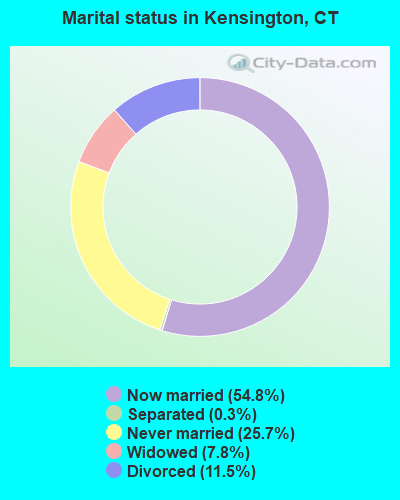
Marital status - Never married (%)
Marital status - Now married (%)
Marital status - Separated (%)
Marital status - Widowed (%)
Marital status - Divorced (%)
Median family income ($)
Median family income (% change since 2000)
Median non-family income ($)
Median non-family income (% change since 2000)
Median per capita income ($)
Median per capita income (% change since 2000)
Median family income ($) - White
Median family income ($) - Black or African American
Median family income ($) - Asian
Median family income ($) - Hispanic or Latino
Median family income ($) - American Indian and Alaska Native
Median family income ($) - Multirace
Median family income ($) - Other Race
Median year house/condo built
Median year apartment built
Year house built - Built 2005 or later (%)
Year house built - Built 2000 to 2004 (%)
Year house built - Built 1990 to 1999 (%)
Year house built - Built 1980 to 1989 (%)
Year house built - Built 1970 to 1979 (%)
Year house built - Built 1960 to 1969 (%)
Year house built - Built 1950 to 1959 (%)
Year house built - Built 1940 to 1949 (%)
Year house built - Built 1939 or earlier (%)
Average household size
Household density (households per square mile)
Average household size - White
Average household size - Black or African American
Average household size - Asian
Average household size - Hispanic or Latino
Average household size - American Indian and Alaska Native
Average household size - Multirace
Average household size - Other Race
Occupied housing units (%)
Vacant housing units (%)
Owner occupied housing units (%)
Renter occupied housing units (%)
Vacancy status - For rent (%)
Vacancy status - For sale only (%)
Vacancy status - Rented or sold, not occupied (%)
Vacancy status - For seasonal, recreational, or occasional use (%)
Vacancy status - For migrant workers (%)
Vacancy status - Other vacant (%)
Residents with income below the poverty level (%)
Residents with income below 50% of the poverty level (%)
Children below poverty level (%)
Poor families by family type - Married-couple family (%)
Poor families by family type - Male, no wife present (%)
Poor families by family type - Female, no husband present (%)
Poverty status for native-born residents (%)
Poverty status for foreign-born residents (%)
Poverty among high school graduates not in families (%)
Poverty among people who did not graduate high school not in families (%)
Residents with income below the poverty level (%) - White
Residents with income below the poverty level (%) - Black or African American
Residents with income below the poverty level (%) - Asian
Residents with income below the poverty level (%) - Hispanic or Latino
Residents with income below the poverty level (%) - American Indian and Alaska Native
Residents with income below the poverty level (%) - Multirace
Residents with income below the poverty level (%) - Other Race
Air pollution - Air Quality Index (AQI)
Air pollution - CO
Air pollution - NO2
Air pollution - SO2
Air pollution - Ozone
Air pollution - PM10
Air pollution - PM25
Air pollution - Pb
Crime - Murders per 100,000 population
Crime - Rapes per 100,000 population
Crime - Robberies per 100,000 population
Crime - Assaults per 100,000 population
Crime - Burglaries per 100,000 population
Crime - Thefts per 100,000 population
Crime - Auto thefts per 100,000 population
Crime - Arson per 100,000 population
Crime - City-data.com crime index
Crime - Violent crime index
Crime - Property crime index
Crime - Murders per 100,000 population (5 year average)
Crime - Rapes per 100,000 population (5 year average)
Crime - Robberies per 100,000 population (5 year average)
Crime - Assaults per 100,000 population (5 year average)
Crime - Burglaries per 100,000 population (5 year average)
Crime - Thefts per 100,000 population (5 year average)
Crime - Auto thefts per 100,000 population (5 year average)
Crime - Arson per 100,000 population (5 year average)
Crime - City-data.com crime index (5 year average)
Crime - Violent crime index (5 year average)
Crime - Property crime index (5 year average)
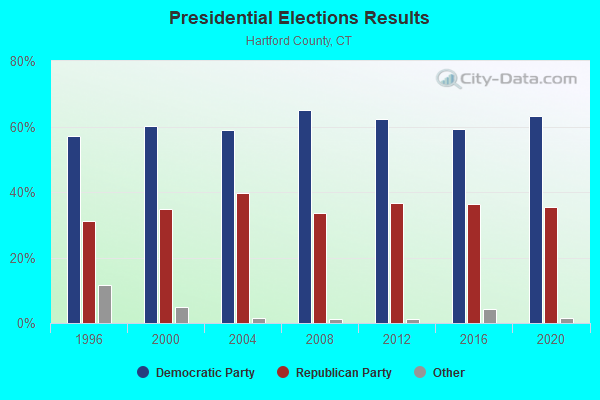
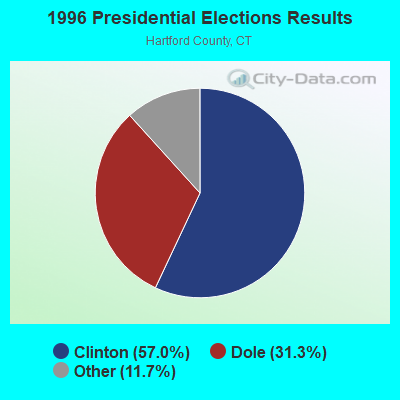
1996 Presidential Elections Results (%) - Democratic Party (Clinton)
1996 Presidential Elections Results (%) - Republican Party (Dole)
1996 Presidential Elections Results (%) - Other
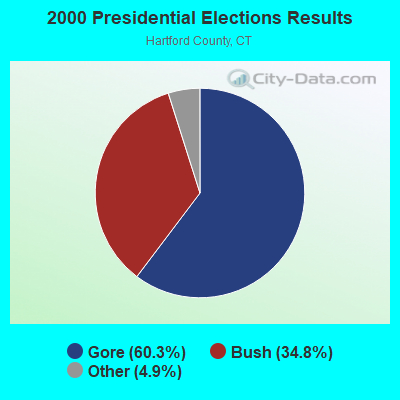
2000 Presidential Elections Results (%) - Democratic Party (Gore)
2000 Presidential Elections Results (%) - Republican Party (Bush)
2000 Presidential Elections Results (%) - Other
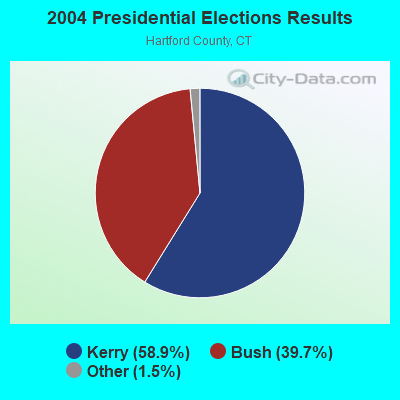
2004 Presidential Elections Results (%) - Democratic Party (Kerry)
2004 Presidential Elections Results (%) - Republican Party (Bush)
2004 Presidential Elections Results (%) - Other
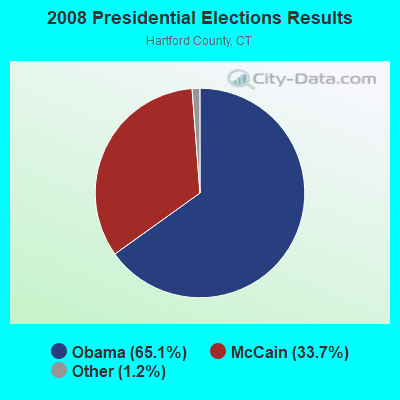
2008 Presidential Elections Results (%) - Democratic Party (Obama)
2008 Presidential Elections Results (%) - Republican Party (McCain)
2008 Presidential Elections Results (%) - Other
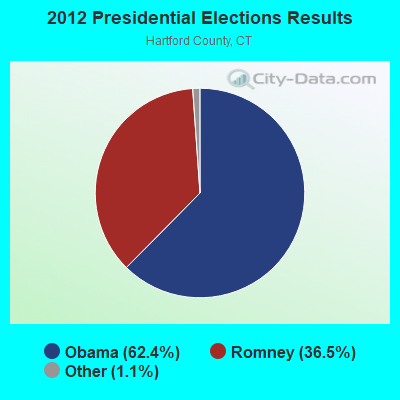
2012 Presidential Elections Results (%) - Democratic Party (Obama)
2012 Presidential Elections Results (%) - Republican Party (Romney)
2012 Presidential Elections Results (%) - Other
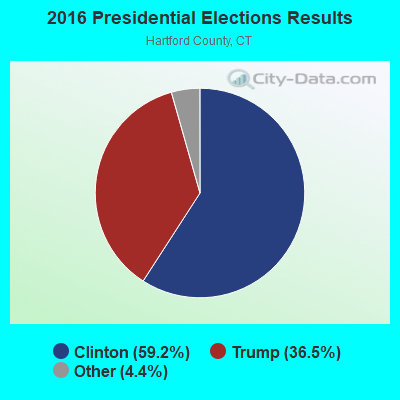
2016 Presidential Elections Results (%) - Democratic Party (Clinton)
2016 Presidential Elections Results (%) - Republican Party (Trump)
2016 Presidential Elections Results (%) - Other
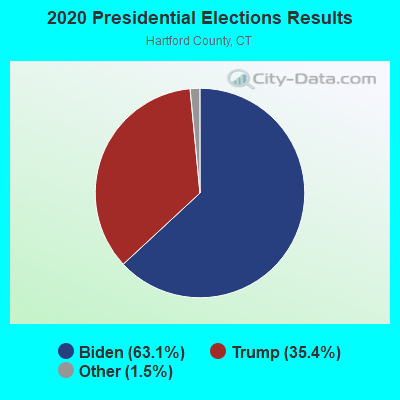
2020 Presidential Elections Results (%) - Democratic Party (Biden)
2020 Presidential Elections Results (%) - Republican Party (Trump)
2020 Presidential Elections Results (%) - Other
Ancestries Reported - Arab (%)
Ancestries Reported - Czech (%)
Ancestries Reported - Danish (%)
Ancestries Reported - Dutch (%)
Ancestries Reported - English (%)
Ancestries Reported - French (%)
Ancestries Reported - French Canadian (%)
Ancestries Reported - German (%)
Ancestries Reported - Greek (%)
Ancestries Reported - Hungarian (%)
Ancestries Reported - Irish (%)
Ancestries Reported - Italian (%)
Ancestries Reported - Lithuanian (%)
Ancestries Reported - Norwegian (%)
Ancestries Reported - Polish (%)
Ancestries Reported - Portuguese (%)
Ancestries Reported - Russian (%)
Ancestries Reported - Scotch-Irish (%)
Ancestries Reported - Scottish (%)
Ancestries Reported - Slovak (%)
Ancestries Reported - Subsaharan African (%)
Ancestries Reported - Swedish (%)
Ancestries Reported - Swiss (%)
Ancestries Reported - Ukrainian (%)
Ancestries Reported - United States (%)
Ancestries Reported - Welsh (%)
Ancestries Reported - West Indian (%)
Ancestries Reported - Other (%)
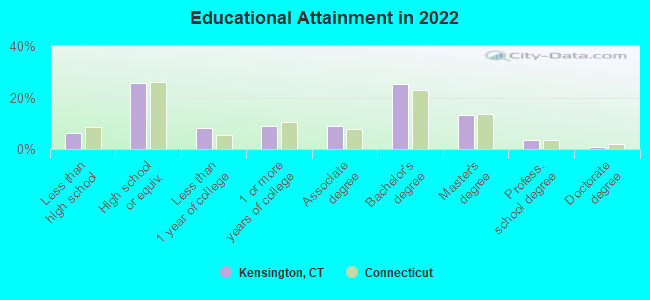
Educational Attainment - No schooling completed (%)
Educational Attainment - Less than high school (%)
Educational Attainment - High school or equivalent (%)
Educational Attainment - Less than 1 year of college (%)
Educational Attainment - 1 or more years of college (%)
Educational Attainment - Associate degree (%)
Educational Attainment - Bachelor's degree (%)
Educational Attainment - Master's degree (%)
Educational Attainment - Professional school degree (%)
Educational Attainment - Doctorate degree (%)
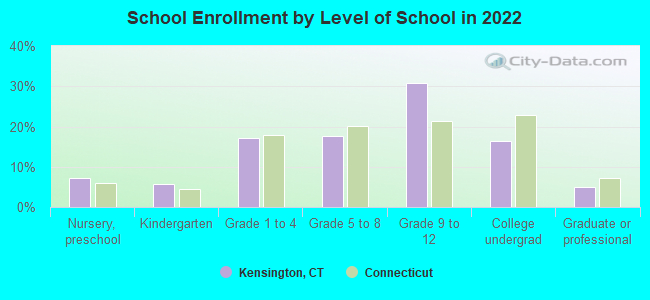
School Enrollment - Nursery, preschool (%)
School Enrollment - Kindergarten (%)
School Enrollment - Grade 1 to 4 (%)
School Enrollment - Grade 5 to 8 (%)
School Enrollment - Grade 9 to 12 (%)
School Enrollment - College undergrad (%)
School Enrollment - Graduate or professional (%)
School Enrollment - Not enrolled in school (%)
School enrollment - Public schools (%)
School enrollment - Private schools (%)
School enrollment - Not enrolled (%)
Median number of rooms in houses and condos
Median number of rooms in apartments
Housing units lacking complete plumbing facilities (%)
Housing units lacking complete kitchen facilities (%)
Density of houses
Urban houses (%)
Rural houses (%)
Households with people 60 years and over (%)
Households with people 65 years and over (%)
Households with people 75 years and over (%)
Households with one or more nonrelatives (%)
Households with no nonrelatives (%)
Population in households (%)
Family households (%)
Nonfamily households (%)
Population in families (%)
Family households with own children (%)
Median number of bedrooms in owner occupied houses
Mean number of bedrooms in owner occupied houses
Median number of bedrooms in renter occupied houses
Mean number of bedrooms in renter occupied houses
Median number of vehichles in owner occupied houses
Mean number of vehichles in owner occupied houses
Median number of vehichles in renter occupied houses
Mean number of vehichles in renter occupied houses
Mortgage status - with mortgage (%)
Mortgage status - with second mortgage (%)
Mortgage status - with home equity loan (%)
Mortgage status - with both second mortgage and home equity loan (%)
Mortgage status - without a mortgage (%)
Average family size
Average family size - White
Average family size - Black or African American
Average family size - Asian
Average family size - Hispanic or Latino
Average family size - American Indian and Alaska Native
Average family size - Multirace
Average family size - Other Race
Geographical mobility - Same house 1 year ago (%)
Geographical mobility - Moved within same county (%)
Geographical mobility - Moved from different county within same state (%)
Geographical mobility - Moved from different state (%)
Geographical mobility - Moved from abroad (%)
Place of birth - Born in state of residence (%)
Place of birth - Born in other state (%)
Place of birth - Native, outside of US (%)
Place of birth - Foreign born (%)
Housing units in structures - 1, detached (%)
Housing units in structures - 1, attached (%)
Housing units in structures - 2 (%)
Housing units in structures - 3 or 4 (%)
Housing units in structures - 5 to 9 (%)
Housing units in structures - 10 to 19 (%)
Housing units in structures - 20 to 49 (%)
Housing units in structures - 50 or more (%)
Housing units in structures - Mobile home (%)
Housing units in structures - Boat, RV, van, etc. (%)
House/condo owner moved in on average (years ago)
Renter moved in on average (years ago)
Year householder moved into unit - Moved in 1999 to March 2000 (%)
Year householder moved into unit - Moved in 1995 to 1998 (%)
Year householder moved into unit - Moved in 1990 to 1994 (%)
Year householder moved into unit - Moved in 1980 to 1989 (%)
Year householder moved into unit - Moved in 1970 to 1979 (%)
Year householder moved into unit - Moved in 1969 or earlier (%)
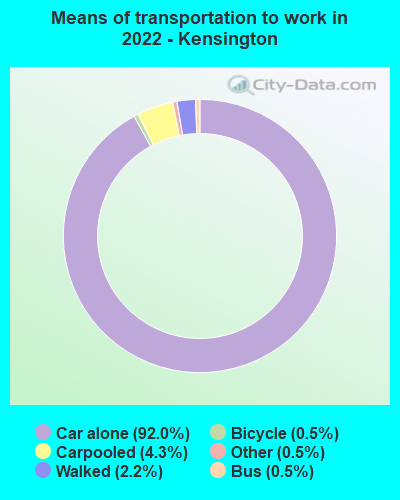
Means of transportation to work - Drove car alone (%)
Means of transportation to work - Carpooled (%)
Means of transportation to work - Public transportation (%)
Means of transportation to work - Bus or trolley bus (%)
Means of transportation to work - Streetcar or trolley car (%)
Means of transportation to work - Subway or elevated (%)
Means of transportation to work - Railroad (%)
Means of transportation to work - Ferryboat (%)
Means of transportation to work - Taxicab (%)
Means of transportation to work - Motorcycle (%)
Means of transportation to work - Bicycle (%)
Means of transportation to work - Walked (%)
Means of transportation to work - Other means (%)
Working at home (%)
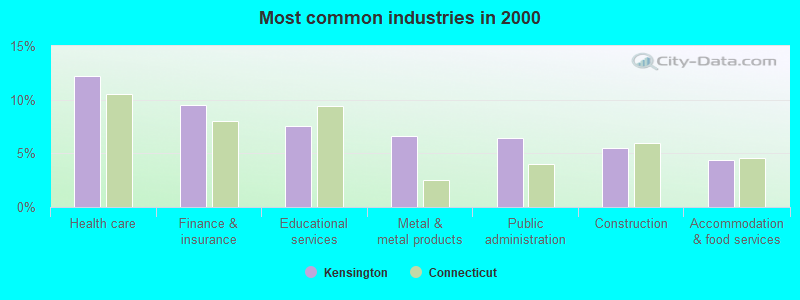
Industry diversity
Most Common Industries - Agriculture, forestry, fishing and hunting, and mining (%)
Most Common Industries - Agriculture, forestry, fishing and hunting (%)
Most Common Industries - Mining, quarrying, and oil and gas extraction (%)
Most Common Industries - Construction (%)
Most Common Industries - Manufacturing (%)
Most Common Industries - Wholesale trade (%)
Most Common Industries - Retail trade (%)
Most Common Industries - Transportation and warehousing, and utilities (%)
Most Common Industries - Transportation and warehousing (%)
Most Common Industries - Utilities (%)
Most Common Industries - Information (%)
Most Common Industries - Finance and insurance, and real estate and rental and leasing (%)
Most Common Industries - Finance and insurance (%)
Most Common Industries - Real estate and rental and leasing (%)
Most Common Industries - Professional, scientific, and management, and administrative and waste management services (%)
Most Common Industries - Professional, scientific, and technical services (%)
Most Common Industries - Management of companies and enterprises (%)
Most Common Industries - Administrative and support and waste management services (%)
Most Common Industries - Educational services, and health care and social assistance (%)
Most Common Industries - Educational services (%)
Most Common Industries - Health care and social assistance (%)
Most Common Industries - Arts, entertainment, and recreation, and accommodation and food services (%)
Most Common Industries - Arts, entertainment, and recreation (%)
Most Common Industries - Accommodation and food services (%)
Most Common Industries - Other services, except public administration (%)
Most Common Industries - Public administration (%)
Occupation diversity
Most Common Occupations - Management, business, science, and arts occupations (%)
Most Common Occupations - Management, business, and financial occupations (%)
Most Common Occupations - Management occupations (%)
Most Common Occupations - Business and financial operations occupations (%)
Most Common Occupations - Computer, engineering, and science occupations (%)
Most Common Occupations - Computer and mathematical occupations (%)
Most Common Occupations - Architecture and engineering occupations (%)
Most Common Occupations - Life, physical, and social science occupations (%)
Most Common Occupations - Education, legal, community service, arts, and media occupations (%)
Most Common Occupations - Community and social service occupations (%)
Most Common Occupations - Legal occupations (%)
Most Common Occupations - Education, training, and library occupations (%)
Most Common Occupations - Arts, design, entertainment, sports, and media occupations (%)
Most Common Occupations - Healthcare practitioners and technical occupations (%)
Most Common Occupations - Health diagnosing and treating practitioners and other technical occupations (%)
Most Common Occupations - Health technologists and technicians (%)
Most Common Occupations - Service occupations (%)
Most Common Occupations - Healthcare support occupations (%)
Most Common Occupations - Protective service occupations (%)
Most Common Occupations - Fire fighting and prevention, and other protective service workers including supervisors (%)
Most Common Occupations - Law enforcement workers including supervisors (%)
Most Common Occupations - Food preparation and serving related occupations (%)
Most Common Occupations - Building and grounds cleaning and maintenance occupations (%)
Most Common Occupations - Personal care and service occupations (%)
Most Common Occupations - Sales and office occupations (%)
Most Common Occupations - Sales and related occupations (%)
Most Common Occupations - Office and administrative support occupations (%)
Most Common Occupations - Natural resources, construction, and maintenance occupations (%)
Most Common Occupations - Farming, fishing, and forestry occupations (%)
Most Common Occupations - Construction and extraction occupations (%)
Most Common Occupations - Installation, maintenance, and repair occupations (%)
Most Common Occupations - Production, transportation, and material moving occupations (%)
Most Common Occupations - Production occupations (%)
Most Common Occupations - Transportation occupations (%)
Most Common Occupations - Material moving occupations (%)
People in Group quarters - Institutionalized population (%)
People in Group quarters - Correctional institutions (%)
People in Group quarters - Federal prisons and detention centers (%)
People in Group quarters - Halfway houses (%)
People in Group quarters - Local jails and other confinement facilities (including police lockups) (%)
People in Group quarters - Military disciplinary barracks (%)
People in Group quarters - State prisons (%)
People in Group quarters - Other types of correctional institutions (%)
People in Group quarters - Nursing homes (%)
People in Group quarters - Hospitals/wards, hospices, and schools for the handicapped (%)
People in Group quarters - Hospitals/wards and hospices for chronically ill (%)
People in Group quarters - Hospices or homes for chronically ill (%)
People in Group quarters - Military hospitals or wards for chronically ill (%)
People in Group quarters - Other hospitals or wards for chronically ill (%)
People in Group quarters - Hospitals or wards for drug/alcohol abuse (%)
People in Group quarters - Mental (Psychiatric) hospitals or wards (%)
People in Group quarters - Schools, hospitals, or wards for the mentally retarded (%)
People in Group quarters - Schools, hospitals, or wards for the physically handicapped (%)
People in Group quarters - Institutions for the deaf (%)
People in Group quarters - Institutions for the blind (%)
People in Group quarters - Orthopedic wards and institutions for the physically handicapped (%)
People in Group quarters - Wards in general hospitals for patients who have no usual home elsewhere (%)
People in Group quarters - Wards in military hospitals for patients who have no usual home elsewhere (%)
People in Group quarters - Juvenile institutions (%)
People in Group quarters - Long-term care (%)
People in Group quarters - Homes for abused, dependent, and neglected children (%)
People in Group quarters - Residential treatment centers for emotionally disturbed children (%)
People in Group quarters - Training schools for juvenile delinquents (%)
People in Group quarters - Short-term care, detention or diagnostic centers for delinquent children (%)
People in Group quarters - Type of juvenile institution unknown (%)
People in Group quarters - Noninstitutionalized population (%)
People in Group quarters - College dormitories (includes college quarters off campus) (%)
People in Group quarters - Military quarters (%)
People in Group quarters - On base (%)
People in Group quarters - Barracks, unaccompanied personnel housing (UPH), (Enlisted/Officer), ; and similar group living quarters for military personnel (%)
People in Group quarters - Transient quarters for temporary residents (%)
People in Group quarters - Military ships (%)
People in Group quarters - Group homes (%)
People in Group quarters - Homes or halfway houses for drug/alcohol abuse (%)
People in Group quarters - Homes for the mentally ill (%)
People in Group quarters - Homes for the mentally retarded (%)
People in Group quarters - Homes for the physically handicapped (%)
People in Group quarters - Other group homes (%)
People in Group quarters - Religious group quarters (%)
People in Group quarters - Dormitories (%)
People in Group quarters - Agriculture workers' dormitories on farms (%)
People in Group quarters - Job Corps and vocational training facilities (%)
People in Group quarters - Other workers' dormitories (%)
People in Group quarters - Crews of maritime vessels (%)
People in Group quarters - Other nonhousehold living situations (%)
People in Group quarters - Other noninstitutional group quarters (%)
Residents speaking English at home (%)
Residents speaking English at home - Born in the United States (%)
Residents speaking English at home - Native, born elsewhere (%)
Residents speaking English at home - Foreign born (%)
Residents speaking Spanish at home (%)
Residents speaking Spanish at home - Born in the United States (%)
Residents speaking Spanish at home - Native, born elsewhere (%)
Residents speaking Spanish at home - Foreign born (%)
Residents speaking other language at home (%)
Residents speaking other language at home - Born in the United States (%)
Residents speaking other language at home - Native, born elsewhere (%)
Residents speaking other language at home - Foreign born (%)
Class of Workers - Employee of private company (%)
Class of Workers - Self-employed in own incorporated business (%)
Class of Workers - Private not-for-profit wage and salary workers (%)
Class of Workers - Local government workers (%)
Class of Workers - State government workers (%)
Class of Workers - Federal government workers (%)
Class of Workers - Self-employed workers in own not incorporated business and Unpaid family workers (%)
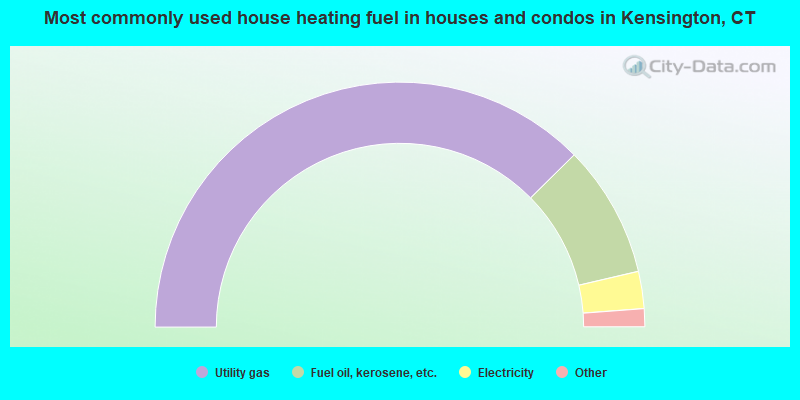
House heating fuel used in houses and condos - Utility gas (%)
House heating fuel used in houses and condos - Bottled, tank, or LP gas (%)
House heating fuel used in houses and condos - Electricity (%)
House heating fuel used in houses and condos - Fuel oil, kerosene, etc. (%)
House heating fuel used in houses and condos - Coal or coke (%)
House heating fuel used in houses and condos - Wood (%)
House heating fuel used in houses and condos - Solar energy (%)
House heating fuel used in houses and condos - Other fuel (%)
House heating fuel used in houses and condos - No fuel used (%)
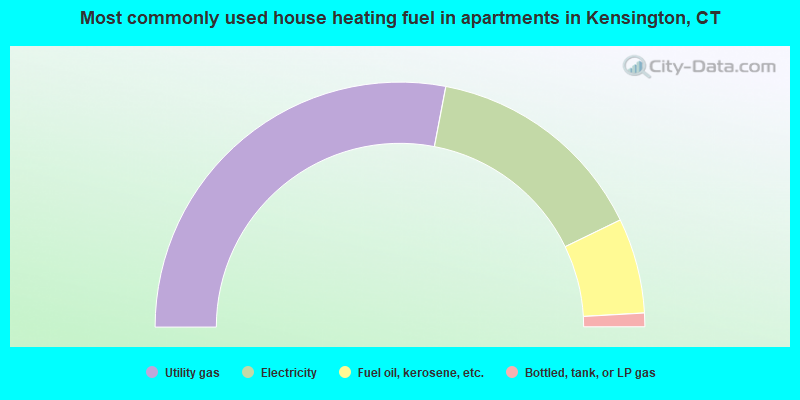
House heating fuel used in apartments - Utility gas (%)
House heating fuel used in apartments - Bottled, tank, or LP gas (%)
House heating fuel used in apartments - Electricity (%)
House heating fuel used in apartments - Fuel oil, kerosene, etc. (%)
House heating fuel used in apartments - Coal or coke (%)
House heating fuel used in apartments - Wood (%)
House heating fuel used in apartments - Solar energy (%)
House heating fuel used in apartments - Other fuel (%)
House heating fuel used in apartments - No fuel used (%)
Armed forces status - In Armed Forces (%)
Armed forces status - Civilian (%)
Armed forces status - Civilian - Veteran (%)
Armed forces status - Civilian - Nonveteran (%)
Fatal accidents locations in years 2005-2021
Fatal accidents locations in 2005
Fatal accidents locations in 2006
Fatal accidents locations in 2007
Fatal accidents locations in 2008
Fatal accidents locations in 2009
Fatal accidents locations in 2010
Fatal accidents locations in 2011
Fatal accidents locations in 2012
Fatal accidents locations in 2013
Fatal accidents locations in 2014
Fatal accidents locations in 2015
Fatal accidents locations in 2016
Fatal accidents locations in 2017
Fatal accidents locations in 2018
Fatal accidents locations in 2019
Fatal accidents locations in 2020
Fatal accidents locations in 2021
Alcohol use - People drinking some alcohol every month (%)
Alcohol use - People not drinking at all (%)
Alcohol use - Average days/month drinking alcohol
Alcohol use - Average drinks/week
Alcohol use - Average days/year people drink much
Audiometry - Average condition of hearing (%)
Audiometry - People that can hear a whisper from across a quiet room (%)
Audiometry - People that can hear normal voice from across a quiet room (%)
Audiometry - Ears ringing, roaring, buzzing (%)
Audiometry - Had a job exposure to loud noise (%)
Audiometry - Had off-work exposure to loud noise (%)
Blood Pressure & Cholesterol - Has high blood pressure (%)
Blood Pressure & Cholesterol - Checking blood pressure at home (%)
Blood Pressure & Cholesterol - Frequently checking blood cholesterol (%)
Blood Pressure & Cholesterol - Has high cholesterol level (%)
Consumer Behavior - Money monthly spent on food at supermarket/grocery store
Consumer Behavior - Money monthly spent on food at other stores
Consumer Behavior - Money monthly spent on eating out
Consumer Behavior - Money monthly spent on carryout/delivered foods
Consumer Behavior - Income spent on food at supermarket/grocery store (%)
Consumer Behavior - Income spent on food at other stores (%)
Consumer Behavior - Income spent on eating out (%)
Consumer Behavior - Income spent on carryout/delivered foods (%)
Current Health Status - General health condition (%)
Current Health Status - Blood donors (%)
Current Health Status - Has blood ever tested for HIV virus (%)
Current Health Status - Left-handed people (%)
Dermatology - People using sunscreen (%)
Diabetes - Diabetics (%)
Diabetes - Had a blood test for high blood sugar (%)
Diabetes - People taking insulin (%)
Diet Behavior & Nutrition - Diet health (%)
Diet Behavior & Nutrition - Milk product consumption (# of products/month)
Diet Behavior & Nutrition - Meals not home prepared (#/week)
Diet Behavior & Nutrition - Meals from fast food or pizza place (#/week)
Diet Behavior & Nutrition - Ready-to-eat foods (#/month)
Diet Behavior & Nutrition - Frozen meals/pizza (#/month)
Drug Use - People that ever used marijuana or hashish (%)
Drug Use - Ever used hard drugs (%)
Drug Use - Ever used any form of cocaine (%)
Drug Use - Ever used heroin (%)
Drug Use - Ever used methamphetamine (%)
Health Insurance - People covered by health insurance (%)
Kidney Conditions-Urology - Avg. # of times urinating at night
Medical Conditions - People with asthma (%)
Medical Conditions - People with anemia (%)
Medical Conditions - People with psoriasis (%)
Medical Conditions - People with overweight (%)
Medical Conditions - Elderly people having difficulties in thinking or remembering (%)
Medical Conditions - People who ever received blood transfusion (%)
Medical Conditions - People having trouble seeing even with glass/contacts (%)
Medical Conditions - People with arthritis (%)
Medical Conditions - People with gout (%)
Medical Conditions - People with congestive heart failure (%)
Medical Conditions - People with coronary heart disease (%)
Medical Conditions - People with angina pectoris (%)
Medical Conditions - People who ever had heart attack (%)
Medical Conditions - People who ever had stroke (%)
Medical Conditions - People with emphysema (%)
Medical Conditions - People with thyroid problem (%)
Medical Conditions - People with chronic bronchitis (%)
Medical Conditions - People with any liver condition (%)
Medical Conditions - People who ever had cancer or malignancy (%)
Mental Health - People who have little interest in doing things (%)
Mental Health - People feeling down, depressed, or hopeless (%)
Mental Health - People who have trouble sleeping or sleeping too much (%)
Mental Health - People feeling tired or having little energy (%)
Mental Health - People with poor appetite or overeating (%)
Mental Health - People feeling bad about themself (%)
Mental Health - People who have trouble concentrating on things (%)
Mental Health - People moving or speaking slowly or too fast (%)
Mental Health - People having thoughts they would be better off dead (%)
Oral Health - Average years since last visit a dentist
Oral Health - People embarrassed because of mouth (%)
Oral Health - People with gum disease (%)
Oral Health - General health of teeth and gums (%)
Oral Health - Average days a week using dental floss/device
Oral Health - Average days a week using mouthwash for dental problem
Oral Health - Average number of teeth
Pesticide Use - Households using pesticides to control insects (%)
Pesticide Use - Households using pesticides to kill weeds (%)
Physical Activity - People doing vigorous-intensity work activities (%)
Physical Activity - People doing moderate-intensity work activities (%)
Physical Activity - People walking or bicycling (%)
Physical Activity - People doing vigorous-intensity recreational activities (%)
Physical Activity - People doing moderate-intensity recreational activities (%)
Physical Activity - Average hours a day doing sedentary activities
Physical Activity - Average hours a day watching TV or videos
Physical Activity - Average hours a day using computer
Physical Functioning - People having limitations keeping them from working (%)
Physical Functioning - People limited in amount of work they can do (%)
Physical Functioning - People that need special equipment to walk (%)
Physical Functioning - People experiencing confusion/memory problems (%)
Physical Functioning - People requiring special healthcare equipment (%)
Prescription Medications - Average number of prescription medicines taking
Preventive Aspirin Use - Adults 40+ taking low-dose aspirin (%)
Reproductive Health - Vaginal deliveries (%)
Reproductive Health - Cesarean deliveries (%)
Reproductive Health - Deliveries resulted in a live birth (%)
Reproductive Health - Pregnancies resulted in a delivery (%)
Reproductive Health - Women breastfeeding newborns (%)
Reproductive Health - Women that had a hysterectomy (%)
Reproductive Health - Women that had both ovaries removed (%)
Reproductive Health - Women that have ever taken birth control pills (%)
Reproductive Health - Women taking birth control pills (%)
Reproductive Health - Women that have ever used Depo-Provera or injectables (%)
Reproductive Health - Women that have ever used female hormones (%)
Sexual Behavior - People 18+ that ever had sex (vaginal, anal, or oral) (%)
Sexual Behavior - Males 18+ that ever had vaginal sex with a woman (%)
Sexual Behavior - Males 18+ that ever performed oral sex on a woman (%)
Sexual Behavior - Males 18+ that ever had anal sex with a woman (%)
Sexual Behavior - Males 18+ that ever had any sex with a man (%)
Sexual Behavior - Females 18+ that ever had vaginal sex with a man (%)
Sexual Behavior - Females 18+ that ever performed oral sex on a man (%)
Sexual Behavior - Females 18+ that ever had anal sex with a man (%)
Sexual Behavior - Females 18+ that ever had any kind of sex with a woman (%)
Sexual Behavior - Average age people first had sex
Sexual Behavior - Average number of female sex partners in lifetime (males 18+)
Sexual Behavior - Average number of female vaginal sex partners in lifetime (males 18+)
Sexual Behavior - Average age people first performed oral sex on a woman (18+)
Sexual Behavior - Average number of woman performed oral sex on in lifetime (18+)
Sexual Behavior - Average number of male sex partners in lifetime (males 18+)
Sexual Behavior - Average number of male anal sex partners in lifetime (males 18+)
Sexual Behavior - Average age people first performed oral sex on a man (18+)
Sexual Behavior - Average number of male oral sex partners in lifetime (18+)
Sexual Behavior - People using protection when performing oral sex (%)
Sexual Behavior - Average number of times people have vaginal or anal sex a year
Sexual Behavior - People having sex without condom (%)
Sexual Behavior - Average number of male sex partners in lifetime (females 18+)
Sexual Behavior - Average number of male vaginal sex partners in lifetime (females 18+)
Sexual Behavior - Average number of female sex partners in lifetime (females 18+)
Sexual Behavior - Circumcised males 18+ (%)
Sleep Disorders - Average hours sleeping at night
Sleep Disorders - People that has trouble sleeping (%)
Smoking-Cigarette Use - People smoking cigarettes (%)
Taste & Smell - People 40+ having problems with smell (%)
Taste & Smell - People 40+ having problems with taste (%)
Taste & Smell - People 40+ that ever had wisdom teeth removed (%)
Taste & Smell - People 40+ that ever had tonsils teeth removed (%)
Taste & Smell - People 40+ that ever had a loss of consciousness because of a head injury (%)
Taste & Smell - People 40+ that ever had a broken nose or other serious injury to face or skull (%)
Taste & Smell - People 40+ that ever had two or more sinus infections (%)
Weight - Average height (inches)
Weight - Average weight (pounds)
Weight - Average BMI
Weight - People that are obese (%)
Weight - People that ever were obese (%)
Weight - People trying to lose weight (%)
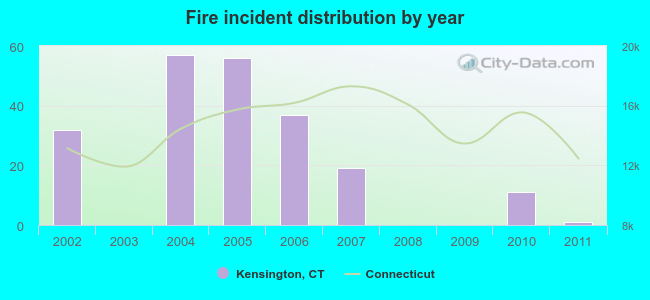
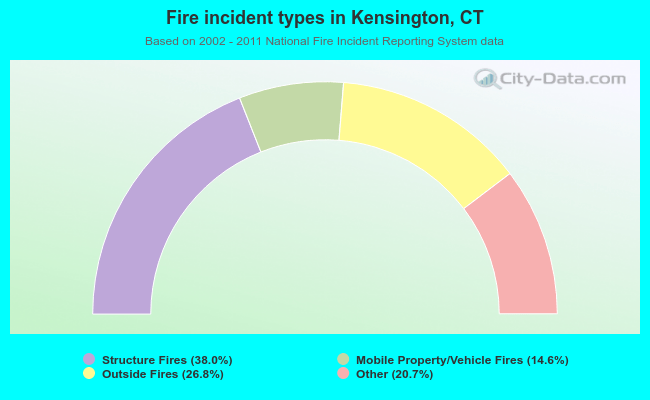
Based on 2000-2022 data
Loading data...
one hundred and twenty-three
Hide US histogram
According to our research of Connecticut and other state lists, there was 1 registered sex offender living in Kensington, Connecticut as of July 03, 2024 . The ratio of all residents to sex offenders in Kensington is 8,496 to 1. The ratio of registered sex offenders to all residents in this city is much lower than the state average.
Recent articles from our blog. Our writers, many of them Ph.D. graduates or candidates, create easy-to-read articles on a wide variety of topics.
Latest news from Kensington, CT collected exclusively by city-data.com from local newspapers, TV, and radio stations
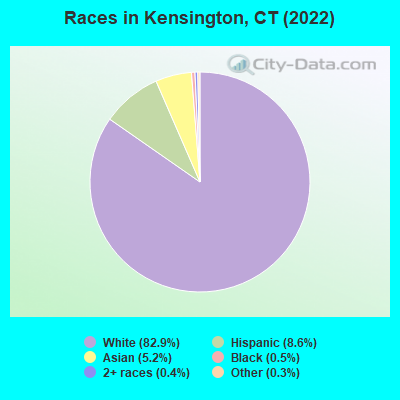
Ancestries: Polish (29.0%), Italian (11.3%), English (9.0%), American (5.3%), Irish (4.7%), German (3.0%).
Current Local Time: EST time zone
Land area: five point two six square miles.
Population density: 1,607 people per square mile (low).
eight hundred and seventy-seven residents are foreign born (4.3% Europe , 3.7% Asia ).
This place:
9.1% Connecticut:
15%
Median real estate property taxes paid for housing units with mortgages in 2022: $5,699 (1.9%) Median real estate property taxes paid for housing units with no mortgage in 2022: $5,865 (1.8%)
Nearest city with pop. 50,000+: New Britain, CT (3.2 miles , pop. 71,538).
Nearest city with pop. 200,000+: North Hempstead, NY (75.1 miles , pop. 222,611).
Nearest city with pop. 1,000,000+: Bronx, NY (78.8 miles , pop. 1,332,650).
Nearest cities:
Latitude: 41.63 N , Longitude: 72.77 W
Daytime population change due to commuting: -418 (-4.3%) Workers who live and work in this place: 1,458 (26.2%)
Area code commonly used in this area: eight hundred and sixty
Unemployment in December 2023: Here:
4% Connecticut:
3.9%
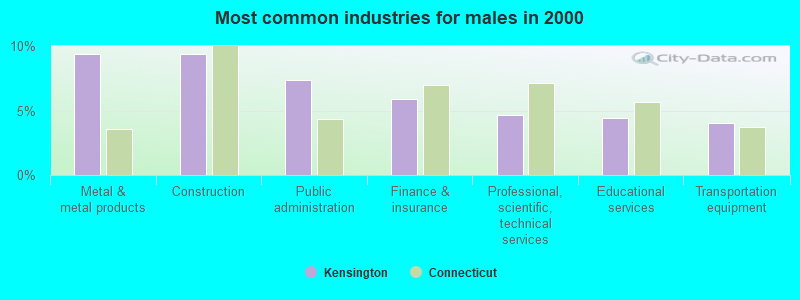
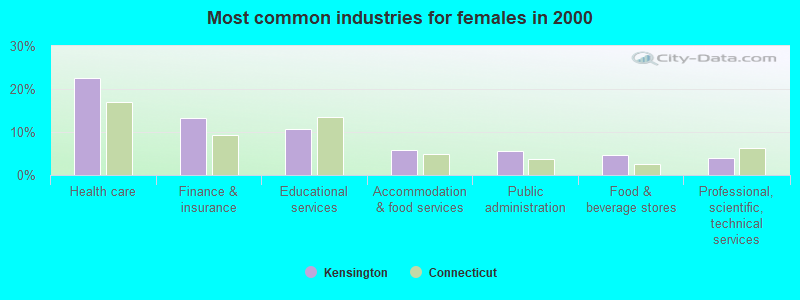
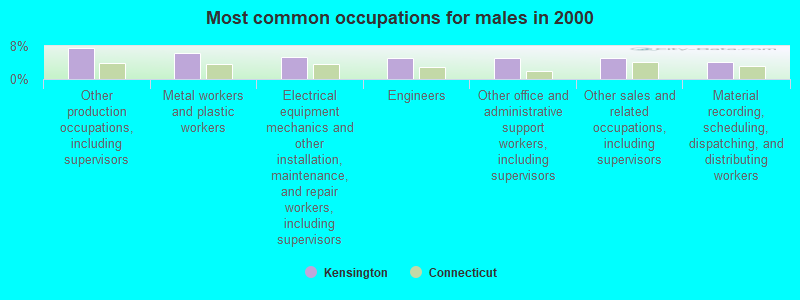
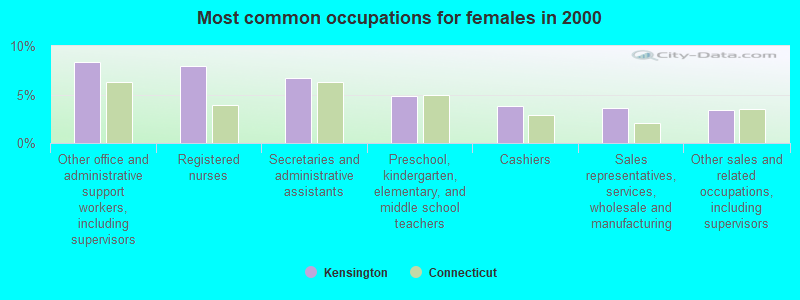
Most common occupations in Kensington, CT (%)
Both Males Females
Other office and administrative support workers, including supervisors (6.7%)
Other production occupations, including supervisors (4.6%)
Other sales and related occupations, including supervisors (4.3%)
Metal workers and plastic workers (3.9%)
Registered nurses (3.9%)
Secretaries and administrative assistants (3.5%)
Material recording, scheduling, dispatching, and distributing workers (2.9%)
Other production occupations, including supervisors (7.6%)
Metal workers and plastic workers (6.3%)
Electrical equipment mechanics and other installation, maintenance, and repair workers, including supervisors (5.4%)
Engineers (5.2%)
Other office and administrative support workers, including supervisors (5.1%)
Other sales and related occupations, including supervisors (5.1%)
Material recording, scheduling, dispatching, and distributing workers (4.0%)
Other office and administrative support workers, including supervisors (8.3%)
Registered nurses (8.0%)
Secretaries and administrative assistants (6.7%)
Preschool, kindergarten, elementary, and middle school teachers (4.8%)
Cashiers (3.8%)
Sales representatives, services, wholesale and manufacturing (3.6%)
Other sales and related occupations, including supervisors (3.4%)
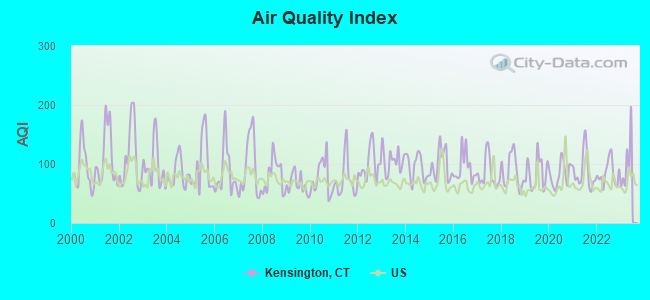
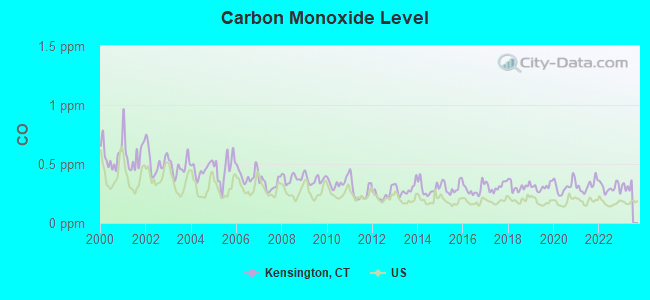
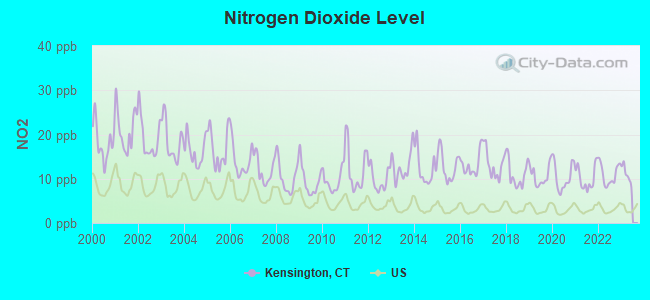
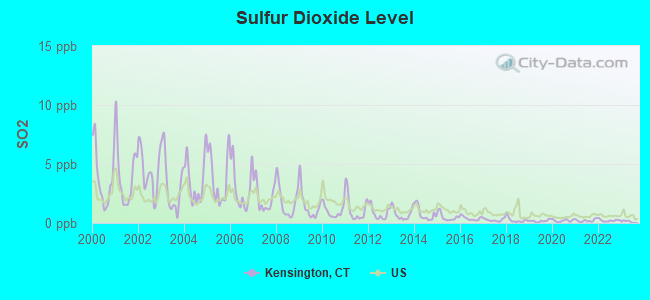
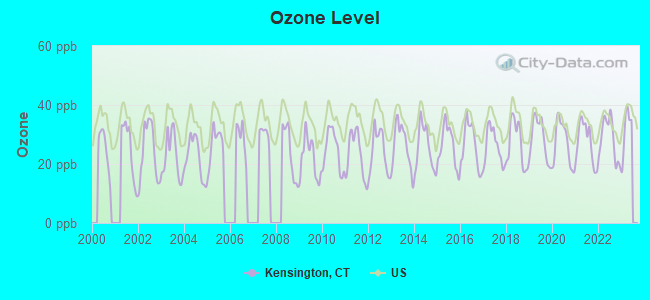
Air pollution and air quality trends (lower is better)
AQI CO NO two SO two Ozone PM ten PM two point five
Air Quality Index (AQI) level in 2022 was eighty-four point five . This is about average.
City:
eighty-four point five U.S.:
seventy-two point six
Carbon Monoxide (CO) [ppm] level in 2022 was zero point three zero zero . This is about average. Closest monitor was 2.8 miles away from the city center.
City:
zero point three zero zero U.S.:
zero point two five one
Nitrogen Dioxide (NO two ) [ppb] level in 2022 was eleven . This is significantly worse than average. Closest monitor was 2.8 miles away from the city center.
City:
eleven U.S.:
five point one
Sulfur Dioxide (SO two ) [ppb] level in 2022 was zero point two one four . This is significantly better than average. Closest monitor was 2.3 miles away from the city center.
City:
zero point two one four U.S.:
one point five one five
Ozone [ppb] level in 2022 was twenty-eight point six . This is about average. Closest monitor was 1.6 miles away from the city center.
City:
twenty-eight point six U.S.:
thirty-three point three
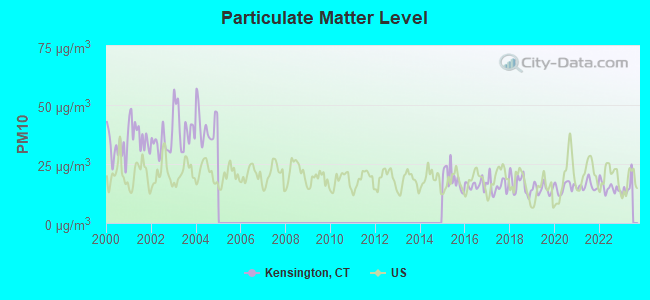
Particulate Matter (PM ten ) [µg/m three ] level in 2022 was fifteen . This is better than average. Closest monitor was 1.0 miles away from the city center.
City:
fifteen U.S.:
nineteen point two
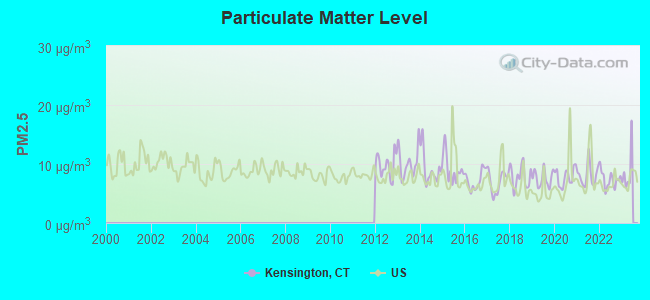
Particulate Matter (PM two point five ) [µg/m three ] level in 2022 was seven point four one . This is about average. Closest monitor was 10.5 miles away from the city center.
City:
seven point four one U.S.:
eight point one one
Tornado activity:
Kensington-area historical tornado activity is near Connecticut state average. It is 24% smaller than the overall U.S. average.
On 10/3/1979 , a category F4 ( max. wind speeds 207-260 mph) tornado eighteen point two miles away from the Kensington place center killed three people and injured five hundred people and caused between $50,000,000 and $500,000,000 in damages.
On 7/10/1989 , a category F4 tornado eighteen point four miles away from the place center injured forty people and caused between $50,000,000 and $500,000,000 in damages.
Earthquake activity:
Kensington-area historical earthquake activity is significantly above Connecticut state average. It is 70% smaller than the overall U.S. average. On 10/7/1983 at 10:18:46 , a magnitude 5.3 (5.1 MB , 5.3 LG , 5.1 ML , Class: Moderate , Intensity: VI - VII) earthquake occurred one hundred and seventy-nine point five miles away from Kensington center On 4/20/2002 at 10:50:47 , a magnitude 5.3 (5.3 ML , Depth: 3.0 mi) earthquake occurred two hundred and four point nine miles away from Kensington center On 4/20/2002 at 10:50:47 , a magnitude 5.2 (5.2 MB , 4.2 MS , 5.2 MW , 5.0 MW) earthquake occurred two hundred and three point four miles away from the city center On 1/19/1982 at 00:14:42 , a magnitude 4.7 (4.5 MB , 4.7 MD , 4.5 LG , Class: Light , Intensity: IV - V) earthquake occurred one hundred and forty-two point five miles away from the city center On 8/23/2011 at 17:51:04 , a magnitude 5.8 (5.8 MW , Depth: 3.7 mi) earthquake occurred three hundred and seventy-six point one miles away from Kensington center On 10/16/2012 at 23:12:25 , a magnitude 4.7 (4.7 ML , Depth: 10.0 mi) earthquake occurred one hundred and seventy-three point six miles away from Kensington center Magnitude types: regional Lg-wave magnitude (LG), body-wave magnitude (MB), duration magnitude (MD), local magnitude (ML), surface-wave magnitude (MS), moment magnitude (MW) Natural disasters: The number of natural disasters in Hartford County (24) is greater than the US average (15). Major Disasters (Presidential) Declared: thirteen Emergencies Declared: eleven Causes of natural disasters: Storms: seven , Hurricanes: five , Floods: four , Snowstorms: four , Blizzards: three , Snows: three , Tropical Storms: two , Winter Storms: two , Snowfall: one , Tornado: one , Wind: one (Note: some incidents may be assigned to more than one category). Hospitals and medical centers in Kensington: LEDGECREST HEALTH CARE (154 KENSINGTON RD)
Other hospitals and medical centers near Kensington: BERLIN VISITING NURSE ASSOCIATION (Home Health Center, about 1 miles away; BERLIN, CT)
ANDREW HOUSE HEALTHCARE (Nursing Home, about 2 miles away; NEW BRITAIN, CT)
ANDREW HOUSE SNF (Nursing Home, about 2 miles away; NEW BRITAIN, CT)
WALNUT HILL CARE CENTER (Nursing Home, about 3 miles away; NEW BRITAIN, CT)
HOSPITAL OF CENTRAL CONNECTICUT, THE Acute Care Hospitals (about 3 miles away; NEW BRITAIN, CT)
VNA OF CENTRAL CONNECTICUT INC (Home Health Center, about 3 miles away; NEW BRITAIN, CT)
JEROME HOME (Nursing Home, about 3 miles away; NEW BRITAIN, CT)
Amtrak station: BERLIN (DEPOT RD.) . Services: ticket office, partially wheelchair accessible, enclosed waiting area, public restrooms, public payphones, free short-term parking, free long-term parking, call for car rental service, call for taxi service, public transit connection. Colleges/universities with over 2000 students nearest to Kensington:
Central Connecticut State University ( about five miles; New Britain, CT ; Full-time enrollment: 9,989)
Tunxis Community College ( about eight miles; Farmington, CT ; FT enrollment: 2,787)
Wesleyan University ( about eight miles; Middletown, CT ; FT enrollment: 3,517)
Trinity College ( about ten miles; Hartford, CT ; FT enrollment: 2,355)
Goodwin College ( about eleven miles; East Hartford, CT ; FT enrollment: 3,017)
Capital Community College ( about eleven miles; Hartford, CT ; FT enrollment: 2,609)
University of Hartford ( about twelve miles; West Hartford, CT ; FT enrollment: 6,398)
Public elementary/middle school in Kensington:
Private elementary/middle schools in Kensington: ST PAUL SCHOOL ( Students: 239, Location: 461 ALLING ST, Grades: PK-8)
MOORELAND HILL SCHOOL ( Students: 40, Location: 166 LINCOLN ST, Grades: 4-8)
See full list of schools located in Kensington
Notable locations in Kensington: Berlin Station (A) , Berlin Town Emergency Management Office (B) , Kensington Fire District Tax Office (C) , Saint Pauls Convent (D) , New Britain Youth Museum at Hungerford Park (E) , Kensington Volunteer Fire Department (F) , Berlin-Peck Memorial Library (G) . Display/hide their locations on the map
Churches in Kensington include: Kensington Congregational Church (A) , Kensington United Methodist Church (B) , Saint Pauls Church (C) , Christian Life Church (D) . Display/hide their locations on the map
Cemeteries: Christian Lane Cemetery (1) , Blue Hills Cemetery (2) . Display/hide their locations on the map
Lakes and reservoirs: Norton Pond (A) , Papel Goods Pond (B) , Hart Ponds (C) , Paper Goods Pond (D) . Display/hide their locations on the map
Streams, rivers, and creeks: Belcher Brook (A) , Crooked Brook (B) . Display/hide their locations on the map
Parks in Kensington include: Griswold Park (1) , Percival Field (2) , Treasure Field (3) , Dennehy Field (4) , Hungerford Park (5) . Display/hide their locations on the map
Hotels: Coronet Motel (811 Wilbur Crossing Highway), Deylin Motor Lodge (1191 Wilbur Crossing Highway), Johnson's Motel (1867 Wilbur Crossing Highway), Little Village (1401 Wilbur Crossing Highway), MT Royal Motel (2447 Wilbur Crossing Highway), Kenilworth Motel (176 Wilbur Crossing Highway), A Comfort Motel (354 Wilbur Crossing Highway), Salsbury Motel (829 Wilbur Crossing Highway), Berlin Motor Inn (1737 Wilbur Crossing Highway).
Birthplace of: Austin Stowell - Actor , Bob Hart (umpire) - Baseball umpire.
Hartford County has a predicted average indoor radon screening level less than 2 pCi/L (pico curies per liter) - Low Potential Drinking water stations with addresses in Kensington and their reported violations in the past: KENSINGTON FIRE DISTRICT ( Population served: 7,553 , Purch surface water): Past monitoring violations:
Monitoring and Reporting (DBP) - Between FEB-2013 and APR-2013 , Contaminant: TTHM . Follow-up actions: St Public Notif requested (AUG-06-2013), St Violation/Reminder Notice (AUG-06-2013), St Compliance achieved (SEP-30-2013), St Public Notif received (SEP-15-2014)
Monitoring and Reporting (DBP) - Between FEB-2013 and APR-2013 , Contaminant: Total Haloacetic Acids (HAA5) . Follow-up actions: St Public Notif requested (AUG-06-2013), St Violation/Reminder Notice (AUG-06-2013), St Compliance achieved (SEP-30-2013), St Public Notif received (SEP-15-2014)
Monitoring and Reporting (DBP) - Between JAN-2013 and MAR-2013 , Contaminant: TTHM . Follow-up actions: St Public Notif requested (AUG-06-2013), St Violation/Reminder Notice (AUG-06-2013), St Compliance achieved (SEP-30-2013), St Public Notif received (SEP-15-2014)
Monitoring and Reporting (DBP) - Between JAN-2013 and MAR-2013 , Contaminant: Total Haloacetic Acids (HAA5) . Follow-up actions: St Public Notif requested (AUG-06-2013), St Violation/Reminder Notice (AUG-06-2013), St Compliance achieved (SEP-30-2013), St Public Notif received (SEP-15-2014)
Monitoring and Reporting (DBP) - In OCT-2012 , Contaminant: Total Haloacetic Acids (HAA5) . Follow-up actions: St Public Notif requested (APR-03-2013), St Violation/Reminder Notice (APR-03-2013), St Compliance achieved (SEP-30-2013)
One routine major monitoring violation
four other older monitoring violations
Average household size: This place:
2.5 people Connecticut:
2.5 people
Percentage of family households: This place:
69.5% Whole state:
66.3%
Percentage of households with unmarried partners: This place:
4.9% Whole state:
6.6%
Likely homosexual households (counted as self-reported same-sex unmarried-partner households)
Lesbian couples: 0.3% of all households Gay men: 0.4% of all households
People in group quarters in Kensington in 2010:
fifty-three people in nursing facilities/skilled-nursing facilities
nine people in group homes intended for adults
three people in other noninstitutional facilities
fifty-nine people in nursing homes in 2000 three people in religious group quarters in 2000 Banks with branches in Kensington (2011 data):
Webster Bank, National Association: Kensington Branch at 346 Main Street , branch established on 1873/01/01 . Info updated 2008/12/23: Bank assets: $18,674.3 mil , Deposits: $13,861.5 mil , headquarters in Waterbury, CT , positive income , Commercial Lending Specialization , one hundred and sixty-seven total offices , Holding Company: Webster Financial Corporation
For population 15 years and over in Kensington:
Never married: 25.7% Now married: 54.8% Separated: 0.3% Widowed: 7.8% Divorced: 11.5% For population 25 years and over in Kensington:
High school or higher: 93.7% Bachelor's degree or higher: 42.2% Graduate or professional degree: 17.1% Unemployed: 2.7% Mean travel time to work (commute): 17.4 minutes
Education Gini index (Inequality in education) Here:
eleven point eight Connecticut average:
twelve point six
Religion statistics for Kensington, CT (based on Hartford County data)
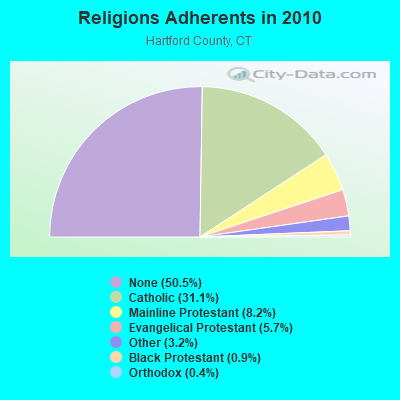
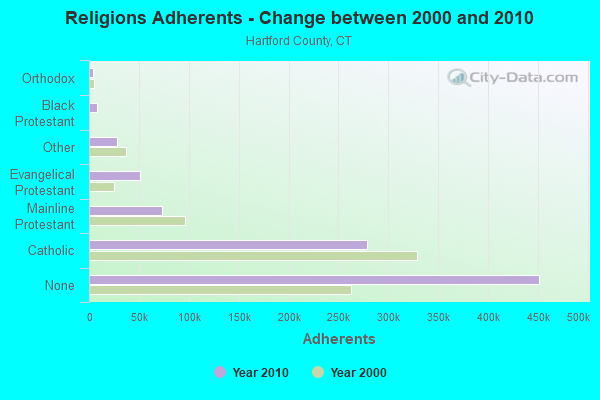
Religion Adherents Congregations Catholic 278,203 one hundred Mainline Protestant 73,522 one hundred and eighty-three Evangelical Protestant 50,619 two hundred and fourteen Other 28,183 ninety-four Black Protestant 8,446 twenty-six Orthodox 3,665 thirteen None 451,376 -
Source: Clifford Grammich, Kirk Hadaway, Richard Houseal, Dale E.Jones, Alexei Krindatch, Richie Stanley and Richard H.Taylor. 2012. 2010 U.S.Religion Census: Religious Congregations & Membership Study. Association of Statisticians of American Religious Bodies. Jones, Dale E., et al. 2002. Congregations and Membership in the United States 2000. Nashville, TN: Glenmary Research Center. Graphs represent county-level data
Food Environment Statistics: Number of grocery stores : 215 This county :
2.46 / 10,000 pop. Connecticut :
2.21 / 10,000 pop.
Number of supercenters and club stores : 5 Here :
0.06 / 10,000 pop. Connecticut :
0.07 / 10,000 pop.
Number of convenience stores (no gas) : 92 Here :
1.05 / 10,000 pop. Connecticut :
1.02 / 10,000 pop.
Number of convenience stores (with gas) : 203 Hartford County :
2.32 / 10,000 pop. Connecticut :
2.27 / 10,000 pop.
Number of full-service restaurants : 755 Here :
8.63 / 10,000 pop. Connecticut :
9.19 / 10,000 pop.
Adult obesity rate : Hartford County :
22.1% Connecticut :
21.5%
Low-income preschool obesity rate : This county :
16% State :
15.8%
Health and Nutrition: Healthy diet rate : Here:
53.9% Connecticut:
50%
Average overall health of teeth and gums : Here:
51.5% Connecticut:
47.5%
Average BMI : This city:
twenty-eight point three Connecticut:
twenty-eight point seven
People feeling badly about themselves : Kensington:
20.5% Connecticut:
20.9%
People not drinking alcohol at all : This city:
10.1% Connecticut:
10.5%
Average hours sleeping at night : This city:
seven Connecticut:
six point eight
Overweight people : Kensington:
33.3% Connecticut:
34.2%
General health condition : Kensington:
59.6% State:
56.4%
Average condition of hearing : This city:
78.2% Connecticut:
78.9%
More about Health and Nutrition of Kensington, CT Residents 4.94% of this county's 2021 resident taxpayers lived in other counties in 2020 ($69,891 average adjusted gross income )
Here:
4.94% Connecticut average:
5.79%
0.04% of residents moved from foreign countries ($102 average AGI ) Hartford County:
0.04% Connecticut average:
0.02%
Top counties from which taxpayers relocated into this county between 2020 and 2021: 5.15% of this county's 2020 resident taxpayers moved to other counties in 2021 ($92,529 average adjusted gross income )
Here:
5.15% Connecticut average:
5.82%
0.03% of residents moved to foreign countries ($235 average AGI ) Hartford County:
0.03% Connecticut average:
0.02%
Top counties to which taxpayers relocated from this county between 2020 and 2021:
Businesses in Kensington, CT
Name Count Name Count
7-Eleven one H&R Block one CVS one Kincaid one Dairy Queen one Rite Aid one FedEx two
Strongest AM radio stations in Kensington:
WTIC (1080 AM; 50 kW; HARTFORD, CT; Owner: INFINITY RADIO OPERATIONS INC.)
WPOP (1410 AM; 5 kW; HARTFORD, CT; Owner: CAPSTAR TX LIMITED PARTNERSHIP)
WLAT (910 AM; 5 kW; NEW BRITAIN, CT; Owner: MEGA COMMUNICATIONS OF NEW BRITAIN LICENSEE, LLC)
WMMW (1470 AM; 2 kW; MERIDEN, CT; Owner: BUCKLEY BROADCASTING CORP OF CT)
WXCT (990 AM; 2 kW; SOUTHINGTON, CT; Owner: THE ADD RADIO GROUP, INC.)
WRYM (840 AM; 1 kW; NEW BRITAIN, CT)
WNNZ (640 AM; 50 kW; WESTFIELD, MA; Owner: CLEAR CHANNEL BROADCASTING LICENSES, INC.)
WMRD (1150 AM; 2 kW; MIDDLETOWN, CT; Owner: CROSSROADS COMMUNICATIONS, INC.)
WDRC (1360 AM; 5 kW; HARTFORD, CT; Owner: BUCKLEY BROADCASTING CORPORATION)
WATR (1320 AM; 5 kW; WATERBURY, CT; Owner: WATR, INC.)
WCRN (830 AM; 50 kW; WORCESTER, MA; Owner: CARTER BROADCASTING CORPORATION)
WELI (960 AM; 5 kW; NEW HAVEN, CT; Owner: CLEAR CHANNEL BROADCASTING LICENSES, INC.)
WFNW (1380 AM; 5 kW; NAUGATUCK, CT; Owner: CANDIDO DIAS CARRELO)
Strongest FM radio stations in Kensington:
WRCH (100.5 FM; NEW BRITAIN, CT; Owner: INFINITY RADIO OPERATIONS INC.)
WWYZ (92.5 FM; WATERBURY, CT; Owner: CAPSTAR TX LIMITED PARTNERSHIP)
WKSS (95.7 FM; HARTFORD-MERIDEN, CT; Owner: CAPSTAR TX LIMITED PARTNERSHIP)
WHCN (105.9 FM; HARTFORD, CT; Owner: CAPSTAR TX LIMITED PARTNERSHIP)
WZMX (93.7 FM; HARTFORD, CT; Owner: INFINITY RADIO OPERATIONS INC.)
WMRQ (104.1 FM; WATERBURY, CT; Owner: CAPSTAR TX LIMITED PARTNERSHIP)
WDRC-FM (102.9 FM; HARTFORD, CT; Owner: BUCKLEY BROADCASTING CORPORATION)
WPKT (90.5 FM; MERIDEN, CT; Owner: CONNECTICUT PUBLIC BROADCASTING, INC)
WTIC-FM (96.5 FM; HARTFORD, CT; Owner: INFINITY RADIO OPERATIONS INC.)
WWUH (91.3 FM; WEST HARTFORD, CT; Owner: UNIVERSITY OF HARTFORD)
WERB (94.5 FM; BERLIN, CT; Owner: BERLIN BOARD OF EDUCATION)
WCCC-FM (106.9 FM; HARTFORD, CT; Owner: MARLIN BROADCASTING, LLC)
WKCI-FM (101.3 FM; HAMDEN, CT; Owner: CLEAR CHANNEL BROADCASTING LICENSES, INC.)
WPLR (99.1 FM; NEW HAVEN, CT; Owner: COX RADIO, INC.)
WJMJ (88.9 FM; HARTFORD, CT; Owner: ST. THOMAS SEMINARY)
W227AJ (93.3 FM; NORTHFORD, CT; Owner: SACRED HEART UNIVERSITY)
WIHS (104.9 FM; MIDDLETOWN, CT; Owner: CONNECTICUT RADIO FELLOWSHIP, INC.)
WFCS (107.7 FM; NEW BRITAIN, CT; Owner: CENTRAL CONNECTICUT STATE UNIVERSITY)
WAQY (102.1 FM; SPRINGFIELD, MA; Owner: SAGA COMMUNICATIONS OF NEW ENGLAND, LLC)
WYBC-FM (94.3 FM; NEW HAVEN, CT; Owner: YALE BROADCASTING CO., INC.)
TV broadcast stations around Kensington:
WTIC-TV ( Channel 61; HARTFORD, CT; Owner: TRIBUNE TELEVISION COMPANY)
W11BJ ( Channel 11; HARTFORD, CT; Owner: COMMUNICATIONS SITE MANAGEMENT LLC)
WTXX ( Channel 20; WATERBURY, CT; Owner: WTXX INC.)
WVIT ( Channel 30; NEW BRITAIN, CT; Owner: OUTLET BROADCASTING, INC)
WEDH ( Channel 24; HARTFORD, CT; Owner: CONNECTICUT PUBLIC BROADCASTING, INC.)
WUVN ( Channel 18; HARTFORD, CT; Owner: ENTRAVISION HOLDINGS, LLC)
WFSB ( Channel 3; HARTFORD, CT; Owner: MEREDITH CORPORATION)
WTNH ( Channel 8; NEW HAVEN, CT; Owner: WTNH BROADCASTING, INC.)
WCTX ( Channel 59; NEW HAVEN, CT; Owner: WTNH BROADCASTING, INC.)
WEDY ( Channel 65; NEW HAVEN, CT; Owner: CONNECTICUT PUBLIC BROADCASTING, INC.)
WHTX-LP ( Channel 10; HARTFORD, CT; Owner: ENTRAVISION HOLDINGS, LLC)
WHCT-LP ( Channel 38; HARTFORD, CT; Owner: VENTURE TECHNOLOGIES GROUP, LLC)
WRDM-LP ( Channel 13; HARTFORD, CT; Owner: ZGS HARTFORD, INC.)
WMLD-LP ( Channel 6; HARTFORD, CT; Owner: HARVARD BROADCASTING, INC.)
WHPX ( Channel 26; NEW LONDON, CT; Owner: PAXSON HARTFORD LICENSE, INC.)
W51BZ ( Channel 51; NEW HAVEN, CT; Owner: it COMMUNICATIONS, INC.)
WYDN ( Channel 48; WORCESTER, MA; Owner: EDUCATIONAL PUBLIC TV CORPORATION)
WUTH-CA ( Channel 47; HARTFORD, CT; Owner: ENTRAVISION HOLDINGS, LLC)
W12BH ( Channel 12; WATERBURY, CT; Owner: CONN.PUBLIC BROADCASTING, INC.)
National Bridge Inventory (NBI) Statistics one Number of bridges 3ft / 1.4m Total length 12,100 Total average daily traffic four hundred and eighty-four Total average daily truck traffic 17,979 Total future (year 2035) average daily traffic
FCC Registered Broadcast Land Mobile Towers: three 311 Reservior Rd ( Lat: forty-one point six one three one six seven Lon: -72.802333), Call Sign: KNEG216, Assigned Frequencies: 151.745 MHz, Grant Date: 02/19/1998, Expiration Date: 02/16/2003, Cancellation Date: 05/18/2003, Registrant: Park Radio & Tv Inc, 380 Park St, New Britain, CT 06051 Lat: forty-one point six four three three zero six Lon: -72.796139, Call Sign: WPXZ303, Assigned Frequencies: 452.050 MHz, Grant Date: 04/27/2013, Expiration Date: 07/03/2023, Cancellation Date: 09/02/2023, Certifier: John Steffen, Registrant: Universal Licensing Service, 4401-A Connecticut Ave Nw #232, Washington, DC 20008, Phone: (877) 677-3639, Fax: (949) 209-3097, Email:
222 Lincoln St ( Lat: forty-one point six four two one six seven Lon: -72.791278), Call Sign: WQXM223, Assigned Frequencies: 467.412 MHz, Grant Date: 04/12/2016, Expiration Date: 04/12/2026, Certifier: Mike Connors, Registrant: Connecticut Radio, Inc., 1208 Cromwell Ave, Rocky Hill, CT 06067, Phone: (860) 563-4867, Fax: (860) 563-1179, Email:
FCC Registered Microwave Towers: two TURKEY HILL, Elwood Road ( Lat: forty-one point six one five five eight three Lon: -72.784639), Type: Ltower, Structure height: 27.4 m, Call Sign: WPUB491, Assigned Frequencies: 953.550 MHz, 17850.0 MHz, 17910.0 MHz, 17850.0 MHz, 17910.0 MHz, 17850.0 MHz, 17910.0 MHz, 17850.0 MHz, 17910.0 MHz, 17850.0 MHz... (+23 more), Grant Date: 11/09/2021, Expiration Date: 01/29/2032, Certifier: James Simon, Registrant: Marcus Communications, 33 Mitchell Dr, Manchester, CT 06045, Phone: (860) 646-1839, Email:
CT-HFD0123A, 240 Kensington Ave ( Lat: forty-one point six two six one nine four Lon: -72.775611), Type: Pole, Structure height: 57.9 m, Call Sign: WQMQ313, Assigned Frequencies: 17815.0 MHz, 17915.0 MHz, Grant Date: 11/03/2020, Expiration Date: 10/20/2030, Cancellation Date: 10/20/2021, Certifier: Nadja S Sodos-Wallace, Registrant: T-Mobile Usa, Inc., 12920 Se 38th Street, Bellevue, WA 98006, Phone: (425) 383-8402, Fax: (425) 383-4840, Email:
FCC Registered Amateur Radio Licenses: 52 ( See the full list of FCC Registered Amateur Radio Licenses in Kensington )
FAA Registered Aircraft: 9 ( See the full list of FAA Registered Aircraft in Kensington )
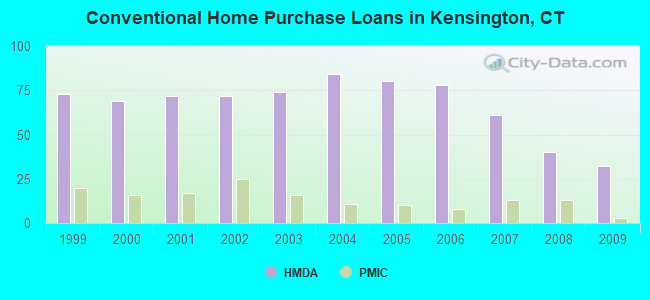
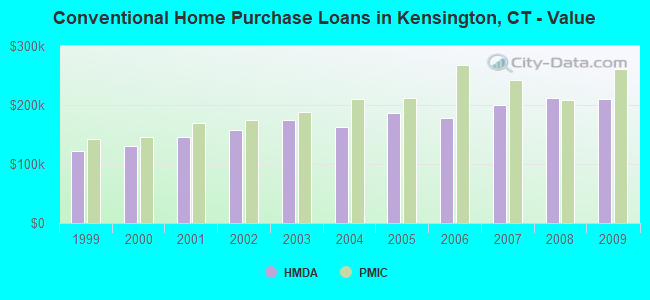
Home Mortgage Disclosure Act Aggregated Statistics For Year 2009 (Based on 2 partial tracts) A) FHA, FSA/RHS & VA Home Purchase Loans B) Conventional Home Purchase Loans C) Refinancings D) Home Improvement Loans F) Non-occupant Loans on < 5 Family Dwellings (A B C & D) Number Average Value Number Average Value Number Average Value Number Average Value Number Average Value
LOANS ORIGINATED eighteen $219,492 thirty-two $210,816 one hundred and fifty-two $192,722 twelve $67,005 three $234,730 APPLICATIONS APPROVED, NOT ACCEPTED one $145,270 one $267,800 thirteen $225,659 two $27,125 zero $0 APPLICATIONS DENIED two $181,130 five $140,760 forty-five $211,636 four $28,745 two $151,115 APPLICATIONS WITHDRAWN two $226,365 three $181,903 thirty $216,875 two $240,885 zero $0 FILES CLOSED FOR INCOMPLETENESS zero $0 one $241,390 five $194,970 one $11,860 zero $0
Aggregated Statistics For Year 2008 (Based on 2 partial tracts) A) FHA, FSA/RHS & VA Home Purchase Loans B) Conventional Home Purchase Loans C) Refinancings D) Home Improvement Loans F) Non-occupant Loans on < 5 Family Dwellings (A B C & D) Number Average Value Number Average Value Number Average Value Number Average Value Number Average Value
LOANS ORIGINATED seventeen $226,164 forty $211,355 fifty-nine $192,643 twenty-two $62,342 five $151,364 APPLICATIONS APPROVED, NOT ACCEPTED one $184,130 five $226,912 ten $179,871 one $79,630 one $268,190 APPLICATIONS DENIED one $178,470 five $249,738 thirty-one $193,512 eight $59,179 one $241,570 APPLICATIONS WITHDRAWN one $173,770 three $202,030 seventeen $217,520 two $55,545 zero $0 FILES CLOSED FOR INCOMPLETENESS zero $0 one $369,590 three $246,653 one $18,390 zero $0
Aggregated Statistics For Year 2007 (Based on 2 partial tracts) A) FHA, FSA/RHS & VA Home Purchase Loans B) Conventional Home Purchase Loans C) Refinancings D) Home Improvement Loans F) Non-occupant Loans on < 5 Family Dwellings (A B C & D) Number Average Value Number Average Value Number Average Value Number Average Value Number Average Value
LOANS ORIGINATED seven $238,941 sixty-one $200,698 ninety-two $160,989 thirty-one $74,830 six $160,635 APPLICATIONS APPROVED, NOT ACCEPTED zero $0 twelve $201,287 sixteen $167,808 three $47,700 one $236,720 APPLICATIONS DENIED zero $0 twelve $185,921 forty-seven $195,530 twelve $66,593 six $123,668 APPLICATIONS WITHDRAWN one $123,250 five $187,144 seventeen $174,683 three $49,183 one $234,010 FILES CLOSED FOR INCOMPLETENESS zero $0 two $165,150 eight $256,819 one $59,760 zero $0
Aggregated Statistics For Year 2006 (Based on 2 partial tracts) A) FHA, FSA/RHS & VA Home Purchase Loans B) Conventional Home Purchase Loans C) Refinancings D) Home Improvement Loans F) Non-occupant Loans on < 5 Family Dwellings (A B C & D) Number Average Value Number Average Value Number Average Value Number Average Value Number Average Value
LOANS ORIGINATED eight $218,981 seventy-eight $177,140 one hundred and eight $152,343 forty-nine $56,856 nine $138,121 APPLICATIONS APPROVED, NOT ACCEPTED zero $0 sixteen $169,337 nineteen $177,477 five $49,284 two $111,935 APPLICATIONS DENIED zero $0 eight $172,198 thirty-nine $177,010 fifteen $69,019 two $105,095 APPLICATIONS WITHDRAWN zero $0 seven $210,541 thirty-seven $185,750 one $51,590 one $215,430 FILES CLOSED FOR INCOMPLETENESS zero $0 two $158,110 five $223,764 two $61,265 zero $0
Aggregated Statistics For Year 2005 (Based on 2 partial tracts) A) FHA, FSA/RHS & VA Home Purchase Loans B) Conventional Home Purchase Loans C) Refinancings D) Home Improvement Loans F) Non-occupant Loans on < 5 Family Dwellings (A B C & D) G) Loans On Manufactured Home Dwelling (A B C & D) Number Average Value Number Average Value Number Average Value Number Average Value Number Average Value Number Average Value
LOANS ORIGINATED seven $173,917 eighty $186,932 one hundred and forty-four $159,702 thirty-four $61,741 five $143,984 zero $0 APPLICATIONS APPROVED, NOT ACCEPTED zero $0 eight $213,010 twenty-four $157,578 four $91,610 one $141,970 zero $0 APPLICATIONS DENIED zero $0 thirteen $151,825 fifty-four $168,921 twelve $75,513 five $141,784 one $141,290 APPLICATIONS WITHDRAWN zero $0 seven $188,320 fifty-two $176,947 five $219,816 zero $0 zero $0 FILES CLOSED FOR INCOMPLETENESS zero $0 one $196,280 twenty-six $186,266 one $115,030 zero $0 zero $0
Aggregated Statistics For Year 2004 (Based on 2 partial tracts) A) FHA, FSA/RHS & VA Home Purchase Loans B) Conventional Home Purchase Loans C) Refinancings D) Home Improvement Loans F) Non-occupant Loans on < 5 Family Dwellings (A B C & D) G) Loans On Manufactured Home Dwelling (A B C & D) Number Average Value Number Average Value Number Average Value Number Average Value Number Average Value Number Average Value
LOANS ORIGINATED seven $160,497 eighty-four $162,700 one hundred and fifty-six $148,383 thirty-two $57,335 five $132,968 zero $0 APPLICATIONS APPROVED, NOT ACCEPTED zero $0 nine $152,064 twenty-three $162,751 four $58,655 one $129,180 zero $0 APPLICATIONS DENIED zero $0 eleven $156,685 forty-one $155,872 ten $57,115 one $85,310 one $42,160 APPLICATIONS WITHDRAWN zero $0 five $140,732 forty-nine $160,540 six $78,227 two $114,820 zero $0 FILES CLOSED FOR INCOMPLETENESS zero $0 one $201,720 thirteen $188,662 one $80,910 zero $0 zero $0
Aggregated Statistics For Year 2003 (Based on 2 partial tracts) A) FHA, FSA/RHS & VA Home Purchase Loans B) Conventional Home Purchase Loans C) Refinancings D) Home Improvement Loans F) Non-occupant Loans on < 5 Family Dwellings (A B C & D) Number Average Value Number Average Value Number Average Value Number Average Value Number Average Value
LOANS ORIGINATED four $144,340 seventy-four $175,243 three hundred and eighty-seven $139,034 seventeen $28,651 six $149,295 APPLICATIONS APPROVED, NOT ACCEPTED zero $0 seven $147,089 forty-five $133,958 five $29,774 zero $0 APPLICATIONS DENIED one $286,200 seven $169,201 fifty-two $130,193 six $39,148 one $144,350 APPLICATIONS WITHDRAWN zero $0 six $146,710 sixty-four $138,459 two $47,040 one $122,050 FILES CLOSED FOR INCOMPLETENESS zero $0 one $121,880 eleven $185,509 one $59,220 zero $0
Aggregated Statistics For Year 2002 (Based on 2 partial tracts) A) FHA, FSA/RHS & VA Home Purchase Loans B) Conventional Home Purchase Loans C) Refinancings D) Home Improvement Loans F) Non-occupant Loans on < 5 Family Dwellings (A B C & D) Number Average Value Number Average Value Number Average Value Number Average Value Number Average Value
LOANS ORIGINATED nine $149,927 seventy-two $157,651 two hundred and thirty-one $131,121 twenty-five $33,284 five $123,106 APPLICATIONS APPROVED, NOT ACCEPTED zero $0 seven $159,434 twenty-nine $123,847 five $27,948 one $115,620 APPLICATIONS DENIED one $67,300 seven $126,730 forty-one $128,534 five $26,206 two $142,360 APPLICATIONS WITHDRAWN one $169,630 five $195,554 twenty-nine $130,003 two $52,595 one $123,520 FILES CLOSED FOR INCOMPLETENESS zero $0 zero $0 seven $159,581 zero $0 zero $0
Aggregated Statistics For Year 2001 (Based on 2 partial tracts) A) FHA, FSA/RHS & VA Home Purchase Loans B) Conventional Home Purchase Loans C) Refinancings D) Home Improvement Loans F) Non-occupant Loans on < 5 Family Dwellings (A B C & D) Number Average Value Number Average Value Number Average Value Number Average Value Number Average Value
LOANS ORIGINATED thirteen $146,181 seventy-two $145,741 one hundred and sixty-four $126,346 twenty-five $38,928 two $87,545 APPLICATIONS APPROVED, NOT ACCEPTED one $121,220 five $131,166 twenty-one $102,781 four $39,325 one $99,950 APPLICATIONS DENIED one $220,390 six $147,768 forty $112,006 nine $28,570 zero $0 APPLICATIONS WITHDRAWN one $67,860 three $184,490 twenty-nine $116,287 three $50,167 zero $0 FILES CLOSED FOR INCOMPLETENESS zero $0 one $108,370 nine $132,713 one $16,470 zero $0
Aggregated Statistics For Year 2000 (Based on 2 partial tracts) A) FHA, FSA/RHS & VA Home Purchase Loans B) Conventional Home Purchase Loans C) Refinancings D) Home Improvement Loans F) Non-occupant Loans on < 5 Family Dwellings (A B C & D) Number Average Value Number Average Value Number Average Value Number Average Value Number Average Value
LOANS ORIGINATED thirteen $136,223 sixty-nine $130,600 thirty-six $90,827 twenty-two $28,250 one $71,650 APPLICATIONS APPROVED, NOT ACCEPTED zero $0 six $156,977 nine $92,643 seven $33,210 zero $0 APPLICATIONS DENIED two $103,760 seven $157,909 twenty-one $84,857 eight $30,238 zero $0 APPLICATIONS WITHDRAWN zero $0 seven $116,887 fourteen $75,488 four $73,990 one $84,990 FILES CLOSED FOR INCOMPLETENESS one $130,410 zero $0 four $138,512 one $14,820 zero $0
Aggregated Statistics For Year 1999 (Based on 2 partial tracts) A) FHA, FSA/RHS & VA Home Purchase Loans B) Conventional Home Purchase Loans C) Refinancings D) Home Improvement Loans F) Non-occupant Loans on < 5 Family Dwellings (A B C & D) Number Average Value Number Average Value Number Average Value Number Average Value Number Average Value
LOANS ORIGINATED fifteen $128,681 seventy-three $122,831 seventy-four $106,692 twenty-three $28,322 five $74,500 APPLICATIONS APPROVED, NOT ACCEPTED one $124,660 six $124,722 eleven $105,693 three $34,240 zero $0 APPLICATIONS DENIED zero $0 six $85,057 twenty-three $98,398 twelve $25,666 zero $0 APPLICATIONS WITHDRAWN one $76,480 seven $105,196 twenty-two $109,605 six $63,562 one $71,650 FILES CLOSED FOR INCOMPLETENESS zero $0 two $104,780 eight $134,298 zero $0 one $100,290
Detailed HMDA statistics for the following Tracts:
four thousand and one , four thousand and three
Private Mortgage Insurance Companies Aggregated Statistics For Year 2009 (Based on 2 partial tracts) A) Conventional Home Purchase Loans B) Refinancings Number Average Value Number Average Value
LOANS ORIGINATED three $260,877 four $241,052 APPLICATIONS APPROVED, NOT ACCEPTED one $169,310 three $315,093 APPLICATIONS DENIED one $371,560 one $269,800 APPLICATIONS WITHDRAWN one $181,830 one $267,560 FILES CLOSED FOR INCOMPLETENESS zero $0 zero $0
Aggregated Statistics For Year 2008 (Based on 2 partial tracts) A) Conventional Home Purchase Loans B) Refinancings C) Non-occupant Loans on < 5 Family Dwellings (A & B) Number Average Value Number Average Value Number Average Value
LOANS ORIGINATED thirteen $208,625 three $259,783 one $193,530 APPLICATIONS APPROVED, NOT ACCEPTED five $241,996 three $305,557 one $249,160 APPLICATIONS DENIED zero $0 zero $0 zero $0 APPLICATIONS WITHDRAWN zero $0 zero $0 zero $0 FILES CLOSED FOR INCOMPLETENESS zero $0 zero $0 zero $0
Aggregated Statistics For Year 2007 (Based on 2 partial tracts) A) Conventional Home Purchase Loans B) Refinancings Number Average Value Number Average Value
LOANS ORIGINATED thirteen $242,308 four $256,595 APPLICATIONS APPROVED, NOT ACCEPTED four $213,905 zero $0 APPLICATIONS DENIED zero $0 zero $0 APPLICATIONS WITHDRAWN one $124,650 zero $0 FILES CLOSED FOR INCOMPLETENESS zero $0 zero $0
Aggregated Statistics For Year 2006 (Based on 2 partial tracts) A) Conventional Home Purchase Loans B) Refinancings Number Average Value Number Average Value
LOANS ORIGINATED eight $267,452 three $192,950 APPLICATIONS APPROVED, NOT ACCEPTED two $284,150 two $211,635 APPLICATIONS DENIED zero $0 one $461,540 APPLICATIONS WITHDRAWN zero $0 zero $0 FILES CLOSED FOR INCOMPLETENESS zero $0 zero $0
Aggregated Statistics For Year 2005 (Based on 2 partial tracts) A) Conventional Home Purchase Loans B) Refinancings C) Non-occupant Loans on < 5 Family Dwellings (A & B) Number Average Value Number Average Value Number Average Value
LOANS ORIGINATED ten $211,211 two $282,955 one $175,610 APPLICATIONS APPROVED, NOT ACCEPTED two $264,575 four $223,338 zero $0 APPLICATIONS DENIED zero $0 zero $0 zero $0 APPLICATIONS WITHDRAWN one $286,450 zero $0 zero $0 FILES CLOSED FOR INCOMPLETENESS zero $0 zero $0 zero $0
Aggregated Statistics For Year 2004 (Based on 2 partial tracts) A) Conventional Home Purchase Loans B) Refinancings C) Non-occupant Loans on < 5 Family Dwellings (A & B) Number Average Value Number Average Value Number Average Value
LOANS ORIGINATED eleven $210,067 three $216,463 one $153,280 APPLICATIONS APPROVED, NOT ACCEPTED zero $0 one $288,520 zero $0 APPLICATIONS DENIED zero $0 zero $0 zero $0 APPLICATIONS WITHDRAWN one $181,830 zero $0 zero $0 FILES CLOSED FOR INCOMPLETENESS zero $0 zero $0 zero $0
Aggregated Statistics For Year 2003 (Based on 2 partial tracts) A) Conventional Home Purchase Loans B) Refinancings C) Non-occupant Loans on < 5 Family Dwellings (A & B) Number Average Value Number Average Value Number Average Value
LOANS ORIGINATED sixteen $188,938 fifteen $182,583 one $108,490 APPLICATIONS APPROVED, NOT ACCEPTED one $286,420 three $212,473 zero $0 APPLICATIONS DENIED zero $0 zero $0 zero $0 APPLICATIONS WITHDRAWN zero $0 two $202,360 zero $0 FILES CLOSED FOR INCOMPLETENESS zero $0 zero $0 zero $0
Aggregated Statistics For Year 2002 (Based on 2 partial tracts) A) Conventional Home Purchase Loans B) Refinancings C) Non-occupant Loans on < 5 Family Dwellings (A & B) Number Average Value Number Average Value Number Average Value
LOANS ORIGINATED twenty-five $174,812 nine $170,592 one $59,620 APPLICATIONS APPROVED, NOT ACCEPTED three $190,217 three $180,837 zero $0 APPLICATIONS DENIED zero $0 zero $0 zero $0 APPLICATIONS WITHDRAWN one $228,210 zero $0 zero $0 FILES CLOSED FOR INCOMPLETENESS zero $0 zero $0 zero $0
Aggregated Statistics For Year 2001 (Based on 2 partial tracts) A) Conventional Home Purchase Loans B) Refinancings Number Average Value Number Average Value
LOANS ORIGINATED seventeen $170,141 eleven $148,655 APPLICATIONS APPROVED, NOT ACCEPTED two $125,170 two $145,510 APPLICATIONS DENIED one $95,200 zero $0 APPLICATIONS WITHDRAWN zero $0 one $90,910 FILES CLOSED FOR INCOMPLETENESS zero $0 zero $0
Aggregated Statistics For Year 2000 (Based on 2 partial tracts) A) Conventional Home Purchase Loans B) Refinancings Number Average Value Number Average Value
LOANS ORIGINATED sixteen $146,528 three $157,517 APPLICATIONS APPROVED, NOT ACCEPTED two $124,305 zero $0 APPLICATIONS DENIED zero $0 zero $0 APPLICATIONS WITHDRAWN zero $0 zero $0 FILES CLOSED FOR INCOMPLETENESS zero $0 zero $0
Aggregated Statistics For Year 1999 (Based on 2 partial tracts) A) Conventional Home Purchase Loans B) Refinancings C) Non-occupant Loans on < 5 Family Dwellings (A & B) Number Average Value Number Average Value Number Average Value
LOANS ORIGINATED twenty $141,618 five $132,880 one $47,100 APPLICATIONS APPROVED, NOT ACCEPTED two $119,430 two $164,625 zero $0 APPLICATIONS DENIED zero $0 zero $0 zero $0 APPLICATIONS WITHDRAWN zero $0 zero $0 zero $0 FILES CLOSED FOR INCOMPLETENESS zero $0 one $131,630 zero $0
Detailed PMIC statistics for the following Tracts:
four thousand and one , four thousand and three Kensington compared to Connecticut state average:
Unemployed percentage significantly below state average. Black race population percentage significantly below state average. Hispanic race population percentage below state average. Median age above state average. Renting percentage below state average. Length of stay since moving in significantly above state average. Kensington on our top lists :
#28 on the list of "Top 101 cities with the most residents born in Poland (population 500+)"
#65 on the list of "Top 101 cities with largest percentage of males in industries: utilities (population 5,000+)"
#66 on the list of "Top 101 cities with the most residents born in Europe, n.e.c. (population 500+)"
#75 on the list of "Top 101 cities with the most residents born in United Kingdom (population 500+)"
#75 on the list of "Top 101 cities with the most residents born in Yugoslavia (population 500+)"
#75 on the list of "Top 101 cities with the most residents born in Asia, n.e.c. (population 500+)"
#75 on the list of "Top 101 cities with the most residents born in Melanesia (population 500+)"
#75 on the list of "Top 101 cities with the most residents born in Micronesia (population 500+)"
#75 on the list of "Top 101 cities with the most residents born in Polynesia (population 500+)"
#97 on the list of "Top 101 cities with the most residents born in Other South Eastern Asia (population 500+)"
#69 (06037) on the list of "Top 101 zip codes with the largest percentage of Polish first ancestries (pop 5,000+)"
#2 on the list of "Top 101 counties with highest percentage of residents voting for Obama (Democrat) in the 2012 Presidential Election"
#17 on the list of "Top 101 counties with the most Catholic congregations"
#19 on the list of "Top 101 counties with the lowest Particulate Matter (PM ten ) Annual air pollution readings in 2012 (µg/m three )"
#24 on the list of "Top 101 counties with the highest percentage of residents that visited a dentist within the past year"
#29 on the list of "Top 101 counties with the most Mainline Protestant congregations"
Top Patent Applicants
David C. Jarmon (26)
James L. Hubbard (15)
Enzo Dibenedetto (13)
Paul P. Tamburini (11)
Gregory A. Kohlenberg (10)
Thomas Casasanta, Jr. (6)
Richard E. Zovich (6)
Jay Breindel (6)
Jason Leroux (5)
Radoslaw Narel (5)
Total of 147 patent applications in 2008-2024.